All published articles of this journal are available on ScienceDirect.

Stroke Prognostication in Patients Treated with Thrombolysis Using Random Forest
Authors Info & Affiliations
Abstract
Background
Early identification and accurate prognostication of acute ischemic stroke are crucial due to the narrow time frame for treatment and potential complications associated with thrombolysis intervention.
Objectives
This pilot study in the Southeast Asian region using Indonesian data, aims to develop a novel machine learning model for predicting the clinical outcome of acute ischemic stroke patients following thrombolysis. The model seeks to aid clinicians in identifying eligible candidates for thrombolysis therapy.
Methods
This retrospective study at Cipto Mangunkusumo Hospital’s medical records from 2014 to 2023 used non-contrast brain CT, clinical, and lab data to develop a Random Forest (RF) algorithm predicting Δ NIHSS (National Institutes of Health Stroke Scale) score, indicating functional outcome. The developed RF model was applied to a validation dataset, with performance evaluated. The study also compared RF with a previous Convolutional Neural Networks (CNN) algorithm.
Results
This study included 145 acute ischemic stroke patients treated with thrombolysis. It demonstrated the promising feasibility of using machine learning algorithms to predict clinical outcomes in this population. Integration of CT, clinical, and laboratory data as inputs to the RF models shows the best prediction performance (Accuracy = 0.75, AUC = 0.72, F1=0.50, Precision=0.60, Sensitivity=0.43, Specificity=0.88)
Conclusions
The application of machine learning shows the potential to enhance the selection process for thrombolysis intervention in treating acute ischemic stroke. Further research with larger multicenter datasets and additional imaging modalities is required to improve predictive ability.
1. INTRODUCTION
Stroke is the leading cause of both death and disability in Indonesia, with the highest mortality rate (193.3/100,000) and disability-adjusted life years (3382.2/100,000) among Southeast Asian nations. The 2018 Riset Kesehatan Dasar (RISKESDAS), a national-scale community research, reports a stroke prevalence of 10.9/1,000,000 individuals in Indonesia. Prompt and accurate intervention is vital to minimize the associated risk of disability and mortality [1]. Intravenous thrombolytic therapy with recombinant tissue plasminogen activator (r-tPA) is the established treatment for acute ischemic stroke cases with an onset of less than 4.5 hours [2]. However, its use should be selective due to potential complications, including intracranial haemorrhage, major systemic bleeding, and angioedema [3]. Indications and contraindications for r-tPA thrombolytic therapy are determined by brain imaging, the patient's clinical condition, and laboratory values [4]. Computed tomography scan (CT) is the preferred modality for brain imaging in stroke cases due to its exceptional accuracy, speed, and availability in ruling out other pathologies [5]. Stroke severity, assessed by the National Institutes of Health Stroke Scale (NIHSS) score, serves as an indicator and predictor of successful reperfusion therapy. NIHSS can evaluate patients' functional outcomes and identify those who may benefit or be at risk for complications from either the therapy or the stroke itself [6-8].
The rapid advancement of technology has led to increased utilization of machine learning for imaging-based stroke prognostication, offering advantages such as objective and expeditious evaluations, fine voxel-level pattern detection capability, and large-scale applicability [9, 10]. The Random Forest (RF) algorithm, a tree-based machine learning approach, has been widely employed in CT scan imaging to predict stroke clinical outcomes [11, 12]. A recent study by Monteiro et al. demonstrated that RF implementation yields a prediction model with optimal performance in predicting clinical outcomes for patients following acute ischemic stroke, as measured by Modified Rankin Scale (mRS) scores after three months, with an area under the receiver operating characteristic (ROC) curve (AUC) value of 0.936±0.34. The most effective predictor variable in this model is NIHSS [12].
Given the narrow time frame for treating acute ischemic stroke and the potential complications associated with thrombolysis intervention, early identification, and accurate clinical outcomes’ prognostication are essential to ensure prompt and appropriate treatment. This study has the potential to be a significant breakthrough because, to the best of the authors' knowledge, there is currently no clinical outcome prediction model for acute ischemic stroke utilizing data from Indonesia. Our study differs from previous ones in that it incorporates laboratory values that have yet to be included. By utilizing machine learning, the author aims to develop a model capable of predicting the clinical outcome (∆ NIHSS) of acute ischemic stroke patients following thrombolysis based on brain CT scans, clinical data, and laboratory values. This model is expected to enhance the efficiency of acute ischemic stroke management by providing clinicians with additional information to aid in their decision-making regarding thrombolysis intervention.
2. METHODS
2.1. Data Collection
In this study, we leveraged patient data obtained at the initial presentation, comprising a comprehensive spectrum of clinical, laboratory, and non-contrast brain CT data sourced from the medical records and Picture Archiving Communication System (PACS) of Cipto Mangunkusumo Hospital, Jakarta. The inclusion criteria encompassed individuals who had encountered acute ischemic stroke and undergone thrombolysis treatment within a decade-long period spanning from November 2014 to February 2023, resulting in a total of 145 patients.
The clinical dataset employed in this research comprised six essential parameters: stroke onset, age, systolic and diastolic blood pressure, NIHSS scores upon admission (NIHSS_In), and 24 hours after therapy (NIHSS_24). With additional laboratory data of prothrombin time (PT), activated partial thromboplastin time (APTT), fibrinogen levels, and random blood glucose (RBG).
After acquiring non-contrast brain CT data with substantial slice thickness from PACS, an imperative preprocessing step was undertaken to optimize the CT dataset for subsequent analyses. The integration of clinical, laboratory, and post-processed CT data served as vital inputs for predicting the Δ NIHSS score, representing the difference between NIHSS_In and NIHSS_24 scores, crucial for understanding the progression and outcomes of acute ischemic stroke post-thrombolysis treatment.
The acquired Δ NIHSS scores are segmented into two distinctive classes—Significant reduction (≥4) and Insignificant reduction (<4)—outlined in Table 1. This classification schema was adopted to structure and categorize the responses observed post-thrombolysis treatment in other studies [13, 14]. In this study, a significant reduction was labelled as negative, meaning there is an improvement in clinical outcome 24 hours after thrombolysis therapy.
| S.No. | Constrain | Label |
|---|---|---|
| 1 | Δ NIHSS ≥ 4 | Significant reduction (-) |
| 2 | Δ NIHSS < 4 | Insignificant reduction (+) |
2.2. Data Preprocessing
The first step in processing the data was to use the nibabel library in Python to load the volumetric data in NIFTI format. This step was necessary due to the complexities of medical imaging datasets, particularly those from modalities like MRI or CT scans. Nibabel library ensures accurate handling of 3D medical imaging data, maintaining data integrity throughout the extraction process (Fig. 1).
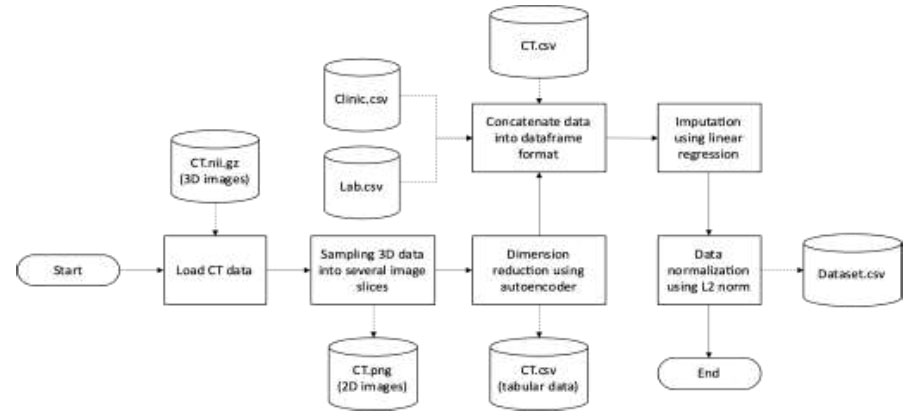
Data preprocessing.
CT data transformation.
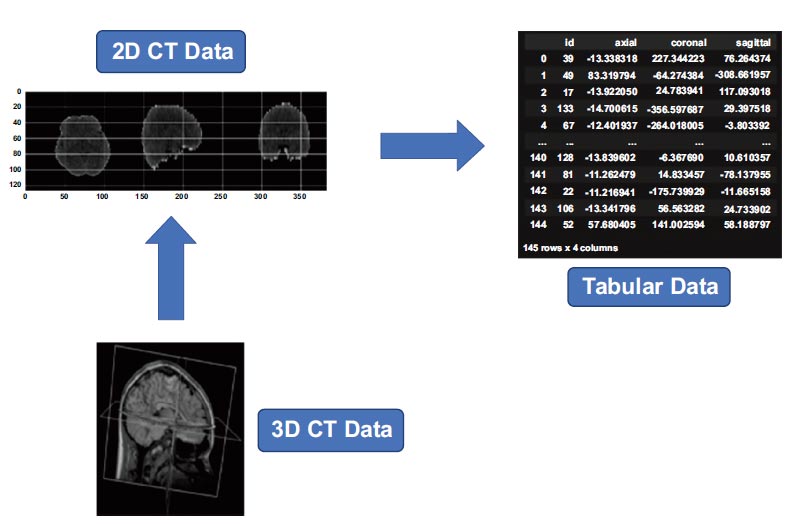
Subsequently, the 3D volumetric data was sampled into multiple 2D image slices. This transformation into 2D slices facilitated subsequent algorithms and models tailored for 2D image analysis. Transformation of the image data into a tabular format was accomplished through the application of an autoencoder [15, 16]. This step focused on reducing the dimensionality of the image data while preserving salient information. Dimensionality reduction helped to reduce computational burdens and expedite more efficient processing in subsequent analytical stages. Converting the image data into a tabular structure made it easier to integrate with diverse datasets, forming a robust foundation for various analytical techniques and models tailored for tabular data. The visualization of CT data is outlined in Fig. (2).
CT scans, clinical records, and laboratory findings are unified in a single data frame. This confluence enabled a comprehensive analysis, identifying correlations and patterns across different data types, potentially revealing insights into underlying medical conditions or outcomes.
Imputation by linear regression was used to replace missing values and to ensure dataset integrity [17]. Additionally, standardizing the dataset through L2 norm-based normalization, which scales the data to a range of 0 to 1, ensured uniformity and comparability across different features. This step effectively addressed the issue of varying scales in the dataset, promoting unbiased analyses and enhancing the interpretability and reliability of subsequent models and findings.
2.3. Data Imputation
In the realm of machine learning, medical datasets frequently contain missing values arising from a variety of factors such as equipment malfunction, incomplete patient records, data corruption, and differences in data recording sources [x+1]. These data gaps can manifest across diverse types of medical information, encompassing imaging scans, clinical measurements, and laboratory tests. Given the pivotal role of medical data in machine learning models for decision-making in healthcare settings, addressing missing values becomes imperative to uphold the reliability and accuracy of analyses and predictions. Inadequate handling of missing data can introduce biases, lead to erroneous conclusions, and potentially impact patient care adversely. Therefore, employing effective strategies for imputing missing values is crucial to maintain the integrity and usefulness of medical datasets in machine learning applications.
Imputation methods are vital for addressing missing values in medical datasets, with linear regression-based imputation being particularly noteworthy for its ability to capture relationships between variables and predict missing values based on observed data [x+2]. In medical datasets, where variables are often interconnected, linear regression provides a systematic approach to imputing missing values while preserving the underlying data structure.
Linear regression for imputation involves fitting a linear equation to the observed data, where the relationship between independent variables (features) and dependent variable (target) is represented as:
y = β 0+β1x1+β2x2+...+βnxn+ϵ
• y is the dependent variable to be predicted.
• β 0 is the intercept term.
• β1, β2, ... , βn are the coefficients of the independent variables x1, x2, ... , xn
• ϵ is the error term, representing the difference between the observed and predicted values.
The model is trained using observed data without missing values, enabling it to predict missing values for the target variable based on the values of other variables in the dataset. This process completes the dataset and ensures its usability for subsequent analyses and modeling tasks. However, it is essential to validate the model's assumptions, such as linearity and homoscedasticity, to ensure the reliability of the imputed values. Overall, linear regression provides a robust framework for imputing missing values in medical datasets, contributing to the integrity and usability of the data.
[x+1] Liu, M., Li, S., Yuan, H., Ong, M. E. H., Ning, Y., Xie, F., ... & Liu, N. (2023). Handling missing values in healthcare data: A systematic review of deep learning-based imputation techniques. Artificial Intelligence in Medicine, 102587.
[x+2] Codella J, Sarker H, Chakraborty P, Ghalwash M, Yao Z, and Sow D. EXITs: An ensemble approach for imputing missing EHR data. In: 2019 IEEE International Conference on Healthcare Informatics (ICHI), IEEE, 2019, 1–3.
2.4. Random Forest
The RF algorithm represents a machine learning algorithm constructed using multiple decision trees (following the bagging concept) [18]. Notably, this algorithm offers distinct advantages over conventional tree algorithms. It exhibits enhanced resistance to noise, mitigating the impact of extraneous data points, and it avoids the issue of overfitting, thus enhancing its predictive accuracy [19, 20].
The RF algorithm, a form of machine learning, operates in two distinct stages: model creation and inference (prediction/classification) [19].
2.4.1. Model Creation Stage
1. Data and features are randomly selected for each tree.
2. Individual tree-based models are constructed.
2.4.2. Inference Stage
1. Test data is input into each tree, generating decisions for each tree.
2. The decisions from each tree are aggregated using methods like majority voting or averaging to derive the final outcome.
Furthermore, for a more comprehensive understanding, an inference visualization is detailed in Fig. (3), providing a visual representation of the described process. This illustration visually depicts the flow and aggregation of decisions in the RF algorithm during the inference stage.
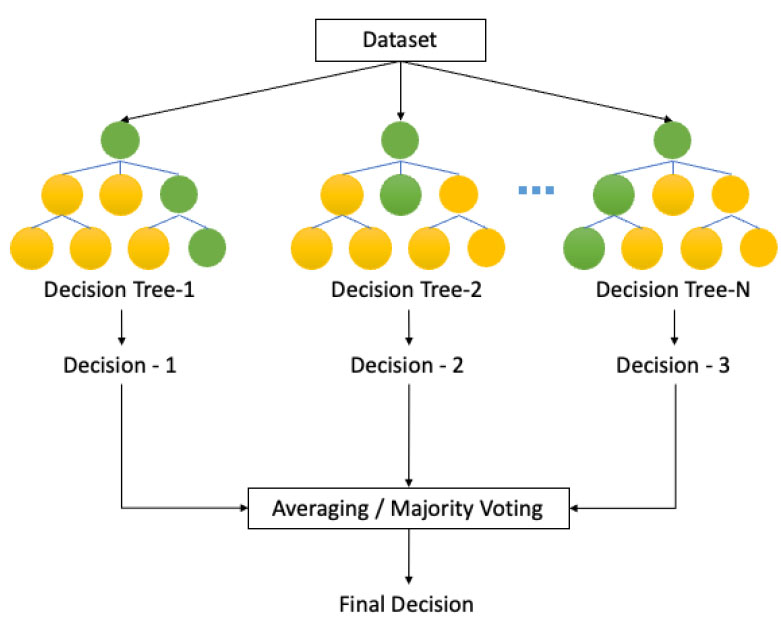
Decision tree algorithm. Adapted with permission from Zhang K, Wu X, Niu R, Yang K, Zhao L. The assessment of landslide susceptibility mapping using random forest and decision tree methods in the Three Gorges Reservoir area, China. Environ Earth Sci 2017; 76(11): 405 [19].
2.5. Model Evaluation
This study meticulously evaluates the performance of various experimental scenarios by employing a range of standard metrics tailored for classification tasks. These metrics, encompassing accuracy, F1 score, precision, recall, sensitivity, specificity, and AUC (Area Under the ROC Curve), collectively provide a robust assessment of the model's predictive capabilities, enabling a comprehensive analysis of its effectiveness across diverse experimental setups. Notably, the dataset was partitioned into development and validation subsets, with metrics generated solely using the validation data to ensure unbiased evaluation.
Accuracy serves as a fundamental metric, measuring the model's ability to correctly classify data and providing a foundational understanding of its overall performance. Meanwhile, the F1 score offers a nuanced perspective on the balance between precision and recall, offering insights into the model's ability to manage false positives and false negatives.
AUC, represented by the Area Under the Receiver Operating Characteristic (ROC) Curve, quantifies the model's ability to discriminate between classes across various thresholds. Higher AUC values indicate better discrimination performance, with 1 representing perfect classification and 0.5 indicating random classification. This metric is particularly valuable for evaluating the overall performance of the model irrespective of class imbalance or threshold selection.
Moreover, the selection of metrics depends on the specific objectives and characteristics of the task under study. Precision and recall become crucial metrics in scenarios where the costs associated with false positives or false negatives vary significantly. Similarly, sensitivity and specificity play vital roles in evaluating the model's ability to differentiate between different classes, particularly in scenarios characterized by class imbalance.
By integrating these diverse metrics, including accuracy, F1 score, precision, recall, sensitivity, specificity, and AUC, into the evaluation framework, researchers gain a thorough understanding of the model's performance nuances under varying experimental conditions. Such meticulous assessment, conducted solely on the validation data, not only guides decisions concerning the model's deployment and optimization but also underscores its relevance in real-world applications where precise classification is paramount.
2.6. Experiment
The detailed process of the experiment is outlined in Fig. (4). The initial phase involves loading the pre-processed clean dataset. Subsequently, the dataset is bifurcated into two main segments: the development and validation datasets. The validation data subset is specifically extracted from the primary dataset, spanning the timeframe from 2022 to 2023, ensuring the model's adaptability and performance on more recent data.
Following dataset segmentation, the core phase involves constructing an RF-based machine-learning model. The evaluation of the developed models is performed based on predefined metrics. This assessment is intended to gauge the model's performance, compare predictions, and validate the accuracy and robustness of the machine learning models generated. These metrics serve as critical benchmarks to assess the predictive accuracy, generalizability, and overall reliability of the constructed models in this experimental framework.
To further evaluate the model's effectiveness, we aimed to integrate an alternative architecture derived from the research conducted by Bacchi et al. [21]. Their study employed a convolutional neural network (CNN) for predicting functional outcomes following thrombolysis, notably excluding laboratory values from its evaluation criteria. This contrast in methodology prompts a reconsideration of the model's construction and lends insight into the potential impact of excluding certain variables in predictive models.
Furthermore, performance assessments for both RF and CNN models were generated in three experimental scenarios: CT, CT + Clinic, and CT + Clinic + Laboratory. In this research, we deliberately avoided parameter tuning to ensure a focus on the models' inherent capabilities without introducing potential biases from extensive parameter adjustments. By refraining from parameter tuning, we aimed to provide a transparent and unbiased evaluation of the model's performance based on their default configurations, ensuring robust and reflective results.
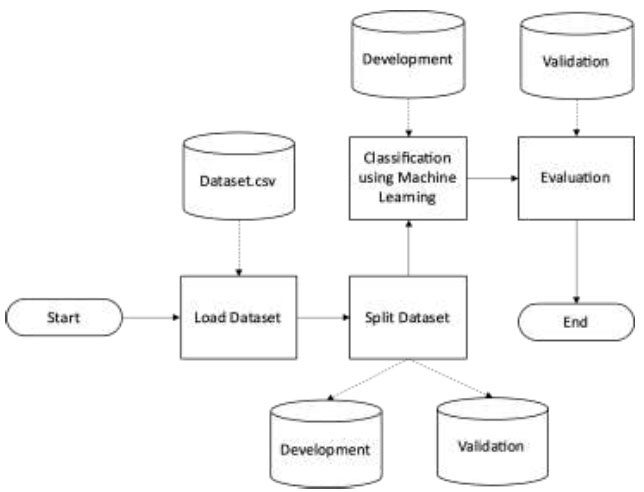
Experiment.
| Sample Characteristics | N | Median | Min. | Max. |
|---|---|---|---|---|
| Male | 89 (59.7%) | - | - | - |
| NIHSS_In | 145 | 9.0 | 1.0 | 26.0 |
| NIHSS_24 | 134 | 7.0 | 0.0 | 26.0 |
| Stroke Onset (Minute) | 145 | 150.0 | 15.0 | 351.0 |
| Age (Years) | 145 | 59.0 | 27.0 | 88.0 |
| Systolic Blood Pressure (mmHg) | 128 | 150.0 | 90.0 | 220.0 |
| Diastolic Blood Pressure (mmHg) | 128 | 90.0 | 45.0 | 124.0 |
| PT (Second) | 140 | 10.5 | 9.2 | 16.9 |
| APTT (Second) | 142 | 32.3 | 22.2 | 162.6 |
| Fibrinogen (mg/dL) | 116 | 321.8 | 132.7 | 792.1 |
| RBG (mg/dL) | 132 | 138.0 | 49.0 | 1522.0 |
3. RESULTS
3.1. Sample Characteristics
From 145 samples included in this study, the median age was 59 years (ranging from 27 to 88), and 59.7% of the samples were male. The median NIHSS_In and NIHSS_24 were 9 (ranging from 1 – 26) and 7 (ranging from 0 – 26). Notably, 43 patients (29.7%) showed favorable progress according to the criteria of ΔNIHSS ≥ 4. Other variables are presented in Table 2 below.
3.2. Feature Analysis
In this study, we employed the Gini Impurity method to conduct a comprehensive analysis of variable importance, aimed at identifying key predictors significantly influencing the Δ NIHSS outcome [22]. This method allows for the quantification of each variable's contribution to impurity reduction within the decision tree's sub-nodes, providing insights into their relative importance.
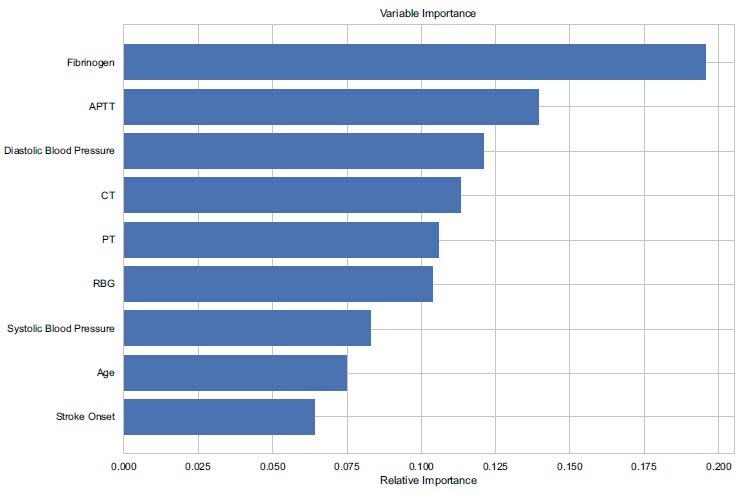
Ranking of features using gini impurity.
| Scenario | Accuracy | F1 | Precision | AUC | Sensitivity (Recall) |
Specificity | TP | FN | FP | TN |
|---|---|---|---|---|---|---|---|---|---|---|
| CT | 0.71 | 0.36 | 0.50 | 0.29 | 0.29 | 0.88 | 2 | 5 | 2 | 15 |
| CT + Clinic | 0.71 | 0.22 | 0.50 | 0.62 | 0.14 | 0.94 | 1 | 6 | 1 | 16 |
| CT + Clinic + Lab | 0.75 | 0.50 | 0.60 | 0.72 | 0.43 | 0.88 | 3 | 4 | 2 | 15 |
As depicted in Fig. (5), the outcomes of this ranking process unveil pivotal insights into the predictive power of various factors. Fibrinogen emerges as the foremost predictor, exhibiting a substantial score surpassing 0.175, indicative of its profound impact on Δ NIHSS. Alongside, APTT demonstrates significant contribution, with scores ranging from 0.125 to 0.150, highlighting its relevance in outcome prediction.
Moreover, Diastolic Blood Pressure and CT Images showcase notable importance, with scores ranging from 0.10 to 0.125, closely followed by PT and RBG within the same range. These findings underscore the multifaceted nature of predictive variables, each playing a discernible role in shaping the outcome.
Of particular interest are factors like systolic blood pressure, age, and stroke onset, which exhibit intermediate importance, presenting scores within the range of 0.05 to 0.10. While their influence is not as pronounced as the aforementioned variables, they nonetheless contribute significantly to the predictive model.
In conclusion, our analysis utilizing the Gini Impurity method has provided valuable insights into the predictors significantly influencing the Δ NIHSS outcome. Fibrinogen emerges as a pivotal predictor, followed by APTT, Diastolic Blood Pressure, CT Images, PT, and RBG, each playing a notable role in outcome prediction. Additionally, factors such as systolic blood pressure, age, and stroke onset exhibit intermediate importance, further enriching our understanding of the predictive landscape. This comprehensive examination underscores the complex interplay of various variables in forecasting Δ NIHSS, emphasizing the need for a nuanced approach to predictive modelling in stroke management. By elucidating the diverse degrees of influence wielded by different variables, our findings pave the way for enhanced predictive accuracy and improved patient outcomes in clinical settings.
3.3. Classification of Δ NIHSS
The evaluation of the Random Forest (RF) model's performance reveals intriguing trends across different scenarios. Notably, there is a consistent improvement in accuracy, with a gradual enhancement observed from the CT scenario's initial accuracy of 0.71 to 0.71 in the CT + Clinic scenario, culminating in a peak accuracy of 0.75 in the CT + Clinic + Lab scenario. Concurrently, the Area Under the Curve (AUC) scores show a similar progression, with values of 0.29, 0.62, and 0.72 for the CT, CT + Clinic, and CT + Clinic + Lab scenarios, respectively. This sequential improvement underscores the synergistic effect of integrating clinic and laboratory data, as elucidated in Table 3.
Furthermore, the RF model demonstrates notable proficiency in distinguishing negative instances compared to positive ones, as evidenced by its high specificity of 0.88 alongside a sensitivity of 0.43. This capability underscores the model's robustness in identifying cases where the outcome is not observed, thus contributing to its overall predictive prowess.
In conclusion, our comparative analysis underscores the importance of considering architectural nuances in model selection for predictive tasks. The RF model showcases consistent and reliable performance, particularly beneficial in scenarios where interpretability and stability are paramount. Conversely, while the CNN model may offer potential in certain contexts, its performance variability and lower accuracy suggest a need for further refinement or exploration of alternative architectures. By recognizing these differences, researchers can make informed decisions regarding model selection, ultimately enhancing predictive accuracy and efficacy in clinical applications.
In contrast to the performance trends observed with the RF architecture, the CNN model, implemented from Bacchi’s architecture, yields diverse outcomes, as outlined in Table 4. Initially, for the CT scenario, the CNN model achieves a comparatively lower accuracy of 0.42. Although there's a marginal improvement in accuracy with the incorporation of clinic or laboratory data, reaching 0.54 for CT + Clinic and 0.58 for CT + Clinic + Lab, the CNN model still falls short when compared to the RF model.
| Scenario | Accuracy | F1 | Precision | AUC | Sensitivity (Recall) |
Specificity | TP | FN | FP | TN |
|---|---|---|---|---|---|---|---|---|---|---|
| CT | 0.42 | 0.59 | 0.42 | 0.55 | 1.00 | 0.00 | 10 | 0 | 14 | 0 |
| CT + Clinic | 0.54 | 0.00 | 0.00 | 0.54 | 0.00 | 0.93 | 0 | 10 | 1 | 13 |
| CT + Clinic + Lab | 0.58 | 0.00 | 0.00 | 0.50 | 0.00 | 1.00 | 0 | 10 | 0 | 14 |
Moreover, the CNN model exhibits distinctive patterns in various metrics. While specificity demonstrates an increasing trend across the scenarios, other key metrics such as AUC, F1 scores, precision, and sensitivity show a declining trend. This divergence in performance metrics underscores the nuanced differences between the RF and CNN architectures in their predictive capabilities.
4. DISCUSSION
This study showed the promising feasibility of functional outcome prediction on acute ischemic stroke patients using machine learning algorithms. To the best of the authors' knowledge, this study was the first to predict thrombolysis outcomes using machine learning strategies on the Southeast Asian population with additional input of laboratory values.
The selection of machine learning algorithm largely depends on the nature of the input data and the sample size. Our study employed tabular datasets derived from CT imaging containing many uninformative features. As stated in a previous study by Grinsztajn et al. [23], multi-layer perceptron-like architectures are not robust to uninformative features. Moreover, RF has demonstrated its efficacy in addressing challenges that arise from small sample sizes, according to another study by Han et al. [24]. A study by Dong et al. [25] about genomic studies also illustrates that non-deep learning models outperformed deep learning models in analyzing small dataset samples and imbalanced data structure. Given the characteristics of the input data and the limited sample size in this study, RF is chosen as the most suitable algorithm. The RF algorithm is frequently utilized in the medical field due to its efficacy in producing significant results with lower sample size requirements, while also being robust to high-dimensional data without the need for a proportionally large training set [26].
Feature analysis shows that fibrinogen and APTT emerged as the two most significant factors affecting Δ NIHSS outcome, consistent with the pathological embolic stroke process. Fibrinogen is the inactivated form of fibrin, the main constituent of thrombus plaque in thrombotic stroke. High fibrinogen levels are correlated to increased risk of stroke occurrence and severity [27]. A study by Mehta et al. [28] showed that the fibrinogen value of infarct stroke patients at hospital admission was associated with poor clinical outcomes (OR 1.004 [95% CI 1.000-1.007], P = 0.38). High levels of fibrinogen potentially inhibit the effectiveness of thrombolysis therapy in ischemic stroke patients [29]. Meanwhile, a low APTT value reflects high blood viscosity, suggesting a higher chance of thrombus formation based on the Virchow triad. A study by Lin et al. [30] found that APTT values were significantly associated with neurological worsening in ischemic stroke patients (OR 5 3.72 with 95% CI 1.03-13.5, P 5.046). Non-contrast CT was used in this study because of its availability throughout hospitals in Indonesia. Despite not being the gold standard modality for stroke detection, CT scans remain relevant for screening, assessing, and deciding on thrombolysis therapy for individuals experiencing acute ischemic strokes. Additionally, CT data serves as a valuable input for machine learning in studies related to stroke prediction, significantly impacting the prediction accuracy [21, 31, 32].
Upon evaluating the performance metrics, it becomes evident that RF showcases notable improvements across several measures compared to CNN. Specifically, RF achieves higher accuracy in all scenarios (0.42 to 0.71 in CT, 0.54 to 0.71 in CT + Clinic, and 0.58 to 0.75 in CT + Clinic + Lab), signalling an enhancement in overall predictive capability. The AUC for the RF Model also improves with additional clinical and laboratory data, depicting increased predictive capability with additional data integration. Low AUC for CT-only models is commonly found in machine learning computations. However, this model is typically confined to research settings and not widely utilized in practice. This study, being a pilot in the Southeast Asian region using Indonesian data, necessitates further external validation and impact study to establish its effectiveness. Additionally, expanding the sample size could enhance model performance. The analysis highlights higher specificity rates in the RF model, signifying the model's capability to identify true negative cases accurately. The RF model's overall performance indicates its ability to assist clinicians in predicting the necessity of thrombolysis intervention.
| References | Study Objectives | ML-based Approaches | Strength | Weaknesses |
|---|---|---|---|---|
| Bachhi et al. [21] | Applying deep learning methods to predict outcomes of thrombolysis | CNN | Deep learning strategies provide the best outcome, optimal results at AUC 0.75 and accuracy 0.74. | Pilot study, small sample sizes, single center study. |
| Wang et al. [11] | Predicting functional outcome (mRS) at 1st and 6th months | RF | 1 month outcome: AUC 0.899; 6 months outcome AUC: 0.917; Predicting functional outcome after ICH is feasible using ML & RF model that provides the best prognostication results. | Limited sample size, excluded large hematomas, did not assess hematoma or edema expansion, and no external validation. |
| Monteiro et al [12] | Prediction of mRS score (0–2 vs. 3–6) at day-90 | RF | Optimal results at AUC 0.936 ± 0.34 | Single center study, no external validation, retrospective. |
| Bentley et al. [31] | Prediction of SICH | Support Vector Machine (SVM) | Optimal results at AUC 0.744 (superior to the SEDAN and HAT scores); Predicts 3 of 4 remote SICHs, none predicted conventionally. | Limited SICH cases; Image processing took ∼30 min. |
| C. C. Chung et al. [33] | Predict outcomes in AIS patients given IV thrombolysis using pretreatment parameters | Artificial Neural Network (ANN) | Optimal results at accuracy 0.975 & AUC 0.950. | Non-inclusion of high dimensionality data (CT). |
| Heo et al. [34] | Prediction of mRS score (0–2 vs. 3–6) at day-90 |
Deep Neural Network (DNN) | Large sample set; Optimal results at AUC 0.888; DNN approach provides better results compared to RF or linear regression. | Single center study, requires external validation. |
| A. A. Khan et al. [35] | Early and accurate Alzheimer’s diagnosis using MRI and PET scans. | Dual-3DM3−AD model, BEMD, RF, SVM |
Dual-3DM3−AD model exhibits superior performance with 0.980 of accuracy, with baseline approach; RF model performed better than SVM and NB. | Reliance on scarce high-quality data, heavy computational demands, limited interpretability affecting trust, need to standardize imaging across clinics for consistent performance. |
| A. A. Khan et al. [36] | Identify pneumonia causes from radiology images, distinguishing between COVID-19 and other infections, including Omicron variants using three CNNs at each stage. | Convolution Neural Networks (CNN) | Performed classification & discrimination of images efficiently; High accuracy of detection ranging from 0.980 to 0.780. | Limited dataset. |
| Kujur A. et al. [37] | Evaluating the dependence of MRI on various CNN models based on the complexity of the data for brain tumor and Alzheimer's disease. | S-CNN, Resnet50, InceptionV3, Xception | Xception model reported higher scores for all five performance measures for the Brain Tumor dataset. |
Alzheimer's dataset has high data complexity with correctly labelled data observed at 66% and 50%. |
| A. A. Khan et al. [38] | Classifying pre-ictal signals in epilepsy patients using brain signals. | DNN (with Deep Dual Patch attention mechanism), SVM, CNN, PIES, LSTM, ANN | DNN with D2PAM has best parameters compared to other machine learning methods with accuracy reaching 99% in sample 4. | Low applicability due to low number of patients with a probability of selection bias. |
In contrast to the RF model, the CNN showed lower accuracy and imbalance performance, indicating its limitations in identifying true positive cases. There are some considerable differences between our CNN implemented from Bacchi’s architecture compared to the study conducted by Bacchi et al. [21]. Bacchi et al. [21] show superior outcomes with a larger dataset (204 patients) and more balanced distribution between those with favorable and less favorable outcomes (53.4% vs. 46.6%), thus better results were obtained by integrating CT and clinical data as inputs (with Accuracy 0.74, AUC 0.75, Sensitivity 0.56, Specificity 0.93, F1 0.69).
Our study shows that RF can outperform CNN and be an alternative algorithm in limited data settings and uneven data distribution. Integrating CT, clinical, and laboratory data will enhance RF predictive ability. In the future, larger multicenter datasets and the incorporation of MRI as the gold standard in stroke assessment are required to improve prediction (Table 5).
CONCLUSION
Our research demonstrates that machine learning (RF) could offer supplementary insights for clinicians when choosing which ischemic stroke patients are suitable for thrombolysis therapy. This is done by predicting patients' clinical outcomes, specifically the change in NIHSS score before and 24 hours after thrombolysis therapy (∆ NIHSS) based on brain CT scans, clinical data, and laboratory values, which give the best prediction results. Further studies and development with larger datasets, different machine learning approaches, or alternative imaging modalities can potentially enhance the model's predictive performance. Hopefully this research model can undergo further validation with external data to confirm the validity of its parameters, while additional impact studies are recommended to demonstrate substantive improvements in the field stemming from this research.
AUTHORS' CONTRIBUTIONS
It is hereby acknowledged that all authors have accepted responsibility for the manuscript's content and consented to its submission. They have meticulously reviewed all results and unanimously approved the final version of the manuscript.
LIST OF ABBREVIATIONS
| APTT | = Activated Partial Thromboplastin Time |
| AUC | = Area Under the Curve |
| CNN | = Convolutional Neural Networks |
| CT-scan | = Computer Tomography scan |
| FP | = False Positive |
| FN | = False Negative |
| mRS | = modified Rankin Scale |
| NIFTI | = Neuro Informatics Technology Initiative |
| NIHSS | = National Institutes of Health Stroke Scale |
| PACS | = Picture Archiving Communication System |
| PT | = Prothrombin Time |
| RISKESDAS | = Riset Kesehatan Dasar |
| RBG | = Random Blood Glucose |
| RF | = Random Forest |
| r-tPA | = recombinant Tissue Plasminogen Activator |
| TP | = True Positive |
| TN | = True Negative |
ETHICS APPROVAL AND CONSENT TO PARTICIPATE
This study was approved by The Ethics Committee of the Faculty of Medicine, University of Indonesia-Cipto Mangunkusumo Hospital, with protocol number 22-04-0352.
HUMAN AND ANIMAL RIGHTS
All procedures performed in studies involving human participants were in accordance with the ethical standards of institutional and/or research committee and with the 1975 Declaration of Helsinki, as revised in 2013.
CONSENT FOR PUBLICATION
Not applicable as this study uses secondary data taken from anonymized CT scan data of the patients as its learning model.
AVAILABILITY OF DATA AND MATERIALS
The data supporting the findings of the article is available in the Zenodo Repository at: https://zenodo.org/records/11243848

