All published articles of this journal are available on ScienceDirect.

Enhancing Classification of Alzheimer’s Disease using Spatial Attention Mechanism
Authors Info & Affiliations
Abstract
Aim
This study aims to enhance the precision of Alzheimer's disease (AD) detection by integrating Spatial Attention Mechanism into a Convolutional Neural Network (CNN) architecture.
Background
Alzheimer's disease is a progressive neurodegenerative disorder characterized by abnormal protein deposits in the brain, leading to nerve cell loss and posing a significant global health challenge. Early and accurate detection is crucial for disease management and treatment due to the lack of a cure and the disease's severe progression.
Objective
The objective of this research is to improve the accuracy of Alzheimer's disease classification using MRI data by implementing a Spatial Attention Mechanism in a CNN architecture.
Methods
The study utilized T1-weighted MRI data from the OASIS 1 and OASIS 2 datasets. The key innovation is the Spatial Attention layer incorporated within a CNN model, which computes the average of each channel in the input feature map. This layer guides subsequent layers to focus on critical brain regions, enhancing the model's accuracy in differentiating between Alzheimer's disease stages.
Results
The model achieved a validation accuracy of 99.69% with a sensitivity and specificity of 1.0000, demonstrating its reliability in distinguishing between different stages of Alzheimer's disease. The adaptability of the Spatial Attention layer allows the model to assign higher weights to crucial brain regions, improving its discriminative power.
Conclusion
The integration of the Spatial Attention Mechanism into the CNN architecture significantly contributes to the early detection of Alzheimer's disease, enabling timely interventions. This innovative approach has the potential to revolutionize Alzheimer's diagnosis by enhancing accuracy and offering a robust solution for classification.
1. INTRODUCTION
Alzheimer's Disease (AD) is a devastating global health crisis that affects millions of people, with an expected increase in the coming decades [1]. Thus, there is a pressing need to develop more efficient and accurate diagnostic techniques and methods. This complex progressive neurodegenerative disorder is characterized by gradual cognitive decline. It is primarily caused by the accumulation of abnormal protein aggregates in the brain, which leads to damage to nerve cells and cognitive decline [2]. This can cause memory loss, visual-spatial difficulties, and behavioral abnormalities, ultimately resulting in severe debilitation. Not only does Alzheimer’s Disease have a profound impact on human lives, but it also poses a significant financial burden - estimated to cost trillions of dollars by 2030 [3]. Therefore, it is crucial to prioritize research and measures aimed at managing and treating this disease.
Medical imaging, especially Magnetic Resonance Imaging (MRI), is now showcasing its potential in the early detection of Alzheimer’s. With its non-invasive, high-resolution capabilities, MRI provides crucial new insights into the changes that occur in the human body caused by AD [4, 5]. It is a cornerstone of clinical practice and an essential biomarker for monitoring the development of AD. This allows for the extraction of valuable data from brain MRIs, which can then be used to train AI models [6].
Furthermore, the role of technology in improving healthcare delivery and diagnosis is increasingly evident as the world continues to struggle with healthcare issues, as demonstrated by the significant impact of medical epidemics and events such as the COVID-19 pandemic [7]. This enhances the usability of machine learning and AI oriented models by leveraging sufficient training data relevant to the healthcare industry [8, 9]. This can be used in conjunction with advanced machine learning models built on image classification, like convolutional neural networks (CNNs) [10]. In the long term, using these models to diagnose Alzheimer’s Disease could relieve the burden on medical personnel and improve diagnostic accuracy.
Our research also explores the potential use cases of Attention Mechanisms (more notably, spatial attention) which are motivated by the human visual attention system and have been successfully used in a range of applications [11]. In medical imaging, an attention mechanism system enables models to concentrate and give more emphasis or priority to particular areas of interest, which may possibly improve accuracy in processes like object detection and segmentation [12]. In order to help with the crucial work of defining Alzheimer's disease, we are employing this spatial attention mechanism in our study, which, in simpler terms, means the model prioritizes certain parts of the MRI images containing vital characteristics about a patient's stage of Alzheimer’s. The main contributions of the proposed work are:
1. The proposed research introduces an innovative spatial attention mechanism that performs accurate classification of Alzheimer's disease stages.
2. The proposed model demonstrates a remarkable testing accuracy of 99.7%, highlighting its reliability and efficacy in distinguishing between different stages of Alzheimer’s disease
3. The proposed model is evaluated against existing studies and industry-level models, demonstrating superior performance. This novel classification approach shows considerable potential for enhancing the early detection of Alzheimer's disease, enabling timely interventions.
2. LITERATURE REVIEW
In the past few years, there has been a remarkable change in the way we diagnose and predict Alzheimer's disease (AD), largely due to the use of cutting-edge machine learning and deep learning methods [13]. As a result, there is now a groundbreaking approach to detecting early signs of AD, surpassing previous conventional methods.
In the past, traditional methods were the go-to choice for AD diagnosis among researchers, often relying on CSV files for clinical data [14]. However, newer studies have explored the potential of utilizing other machine learning techniques. For example, Modupe et al. [15] demonstrated the effectiveness of the ResNet18 model in accurately diagnosing AD, achieving impressive results such as high precision, recall, and F1-scores when incorporating a dropout rate of 0.2. Similarly, Yingying et al. [16] utilized an SVM to predict the transition from Mild Cognitive Impairment (MCI) to AD. These studies highlight the dynamic nature of AD diagnosis.
The progress in utilizing MRI images for AD diagnosis has been remarkable, with researchers employing diverse deep learning structures, particularly Convolutional Neural Networks (CNNs), to categorize Alzheimer's disease [17]. Achieving an accuracy of 90.6% in distinguishing AD from healthy controls, this method highlights the effectiveness of attention mechanisms in extracting crucial features, overcoming the limitations of CSV-based approaches. These innovative methods underscore the importance of extracting vital insights from MRI scans for Alzheimer's diagnosis, proving to be highly effective and reliable [5].
For example, Liu et al. [18] introduced a multi-modal deep Convolutional Neural Network (CNN) framework for accurate hippocampus segmentation and AD classification, delivering impressive results with high accuracy and Area Under the Curve (AUC) scores. In another study, Sarraf et al. [19] utilized the technique of transfer learning in conjunction with the LeNet architecture, achieving a remarkable accuracy of 96.86% in distinguishing AD cases from healthy controls. Similarly, Cui et al. [20] employed the Inception V3 model to effectively classify AD, Mild Cognitive Impairment (MCI), and normal control cases solely based on MRI images. Ensemble methods have exhibited great potential in classifying AD. For example, E. Jabason [21] introduced a diverse ensemble of CNNs, such as DenseNet architectures, for accurately identifying AD using structural MRI data with a remarkable accuracy of 95.23%. Additionally, Shahbaz et al. [22] employed a classical machine learning approach, implementing the generalized linear model (GLM) to diagnose AD with a commendable accuracy of 88.24%. These impressive results highlight the effectiveness of ensemble techniques in AD classification.
Our proposed model for classifying Alzheimer's disease places great importance on integrating the attention mechanism. This key component allows for detecting and amplifying relevant features while disregarding less crucial ones. The use of attention mechanisms has proven to greatly enhance model performance. Extensive research has led to the development of innovative attention mechanisms. These advancements serve as a testament to the crucial role that attention mechanisms play in improving model representation and overall performance [11, 12, 23].
To conclude, the process of diagnosing Alzheimer's disease has evolved to utilize MRI scans and deep learning. This shift marks a crucial breakthrough in the field, as the ability to detect AD early on has greatly advanced in terms of precision, effectiveness, and dependability. These ongoing advancements bring hope for early detection and improved care for patients.
Table 1 provides a thorough examination of multiple research endeavors centered on utilizing neuroimaging data to diagnose Alzheimer's disease (AD). Recently, there has been special attention given to using diverse deep learning architectures and machine learning methods [24]. The initial study used a refined ResNet18 model to test seven distinct AD and cognitive state classification tasks. Despite efforts to mitigate overfitting, the model still struggled with this issue.
The TS-SVM approach of the second study, while promising for identifying AD conversion, suffered from bias in longitudinal data. The third study found LeNet CNN to be highly accurate but recommended exploring more advanced architectures. The fourth study achieved superior performance on the OASIS dataset using a combination of advanced deep-learning techniques. Conversely, the final study compared six algorithms, finding that the generalized linear model is best suited for classifying Alzheimer's stages. This analysis underlines the value of augmented data for specific classes to enhance overall accuracy.
This extensive literature review has revealed several gaps in current research, which encompass the issue of overfitting, the requirement for advanced network designs, mitigating bias in longitudinal data, and enhancing classification accuracy via dataset augmenta tion.
| Refs. | Dataset | Algorithm Used | Contribution | Research Gaps |
|---|---|---|---|---|
| [15] 2022 |
ADNI fMRI (138 subjects) | Fine Tuned ResNet18 | This study addressed overfitting by fine tuning all convolutional layers and regularizing with a dropout of 0.2. It compared the performance of two deep learning models (ResNet18 model without dropout and with dropout) on seven binary classification tasks. | Only performed binary classification tasks: CN vs. AD, CN vs. EMCI, CN vs. LMCI, EMCI vs. LMCI, EMCI vs. AD, LMCI vs. AD, and EMCI vs. MCI. The results of the model showed overfitting despite using dropout. |
| [16] 2021 |
ADNI | Temporally Structured Support Vector Machine (TS-SVM) Model | Their novel analytical method robustly detects AD at time points 6 or 12 months prior to conversion from MCI. By contrast, performance for predicting conversion drops markedly at 18 months. | This drop in performance is attributed to inherent bias in the longitudinal data. Subjects converting to AD after 6-12 months have sufficient follow-up points, unlike those converting after 18 months. Their current work only uses single-modality data to classify MCI converters from MCI non-converters. |
| [19] 2016 |
ADNI - 28 AD patients and 15 NC subjects | LeNet CNN framework | This study achieved 96.86% accuracy in classifying AD using LeNet CNN architecture. Trained on a large dataset, the model adapts to predict AD stages across ages. Its unique architecture facilitates feature selection and classification, validating the chosen network design. | CNNs pose high algorithm complexity and expensive architecture. The authors recommend using a more complicated network architecture with more CNN layers for further solutions. |
| [21] 2019 |
OASIS - 3 | Ensemble of hybrid deep learning architectures |
This paper tested three feature-extraction pipelines using different MRI views to improve spatial data. Combining these pipelines with voting on a large dataset (OASIS) yielded high accuracy, suggesting deeper CNN architectures improve performance in AD diagnosis. | Plan to test this method on more datasets. |
| [22] 2019 |
ADNI | 6 ML and data mining algorithms - including KNNs, decision tree, rule induction, Naive Bayes, generalized linear model (GLM) and deep learning algorithm |
The analysis reveals that the generalized linear model excels among classifiers, achieving an 88.24% accuracy during testing. Deep learning and Naive Bayes algorithms also perform well, with accuracies of 78.32% and 74.65%, respectively. Notably, test results closely align with cross-validation results, indicating that the models are not overfitting during training. | Enhancing the accuracy of AD stage classification can be achieved by augmenting the instances for EMCI and SMC classes. This approach ensures that the model is trained with an ample and balanced dataset across all classes. |
2.1. Datasets
There was a successful attempt in the utilization of a comprehensive dataset, representing and encompassing images representative of Alzheimer's disease at varying stages. As mentioned in the introduction, the Magnetic Resonance Imaging (MRI) scans were indicative of the general stages associated with Alzheimer’s dementia. These stages can collectively be classified into a general or wide scope under either Cognitively Normal (CN or Normal or Non-Demented) or Alzheimer’s Dementia (AD or Demented or Cognitively Abnormal).
Most research in the field of Alzheimer's disease has heavily relied on two prominent datasets: the OASIS dataset and the ADNI dataset, both of which have significantly contributed to our understanding of the disease.
The OASIS (Open Access Series of Imaging Studies) dataset comprises multiple sub-datasets, with OASIS-1, OASIS-2, and OASIS-3 being pivotal components. OASIS-1 primarily includes structural brain MRI data, serving as a valuable resource for anatomical analyses [25] and volumetric measurements. OASIS-2 extends this legacy by adding in-depth clinical and demographic information to the imaging data, facilitating comprehensive investi- gations into the progression of Alzheimer's disease. This component essentially provides longitudinal data of subjects over time, documenting the disease’s progression for future studies and early prediction of the disease. OASIS-3 is one of the more recent projects that further bolsters the collection with a broader and more diverse dataset. Besides documenting symptoms over time, it also deals with multi-modal imaging, containing a variety of imaging sessions, namely Magnetic Resonance (MR) sessions, Positron Emission Tomography (PET) sessions, and Computed Tomography (CT) sessions for patients.
In our work, we acquired the “Alzheimer's Dataset (4 classes of Images)” from Kaggle, which comprises a total of 6,400 images. These images are meticulously categorized into four distinct classes, each corresponding to different stages of Alzheimer's disease, namely: Very Mild Demented, Mild Demented, Moderate Demented, and Non-Demented. Upon further inspection, it can be noted that the dataset contains samples of data from OASIS 1 and OASIS 2, owing to it being T1-weighted MRI data of the Axial plane, a characteristic most prominently showcased by OASIS data, and containing the relevant slice of the 3D image that is also included in OASIS’s repositories as well.
A view of a sample of data from each class has been highlighted in Fig. (1).
2.2. Ethical Considerations of Proposed Research
There are certain considerations that need to be kept in mind while engaging in analysis and research involving usage of medical data repositories. These are paramount when using human subject data in research, even if the data is publicly available and de-identified. Despite efforts to anonymize data, there's still a risk of re-identification or revealing sensitive information through data aggregation. It's crucial to ensure that the data was collected ethically, with informed consent and adherence to privacy regulations.
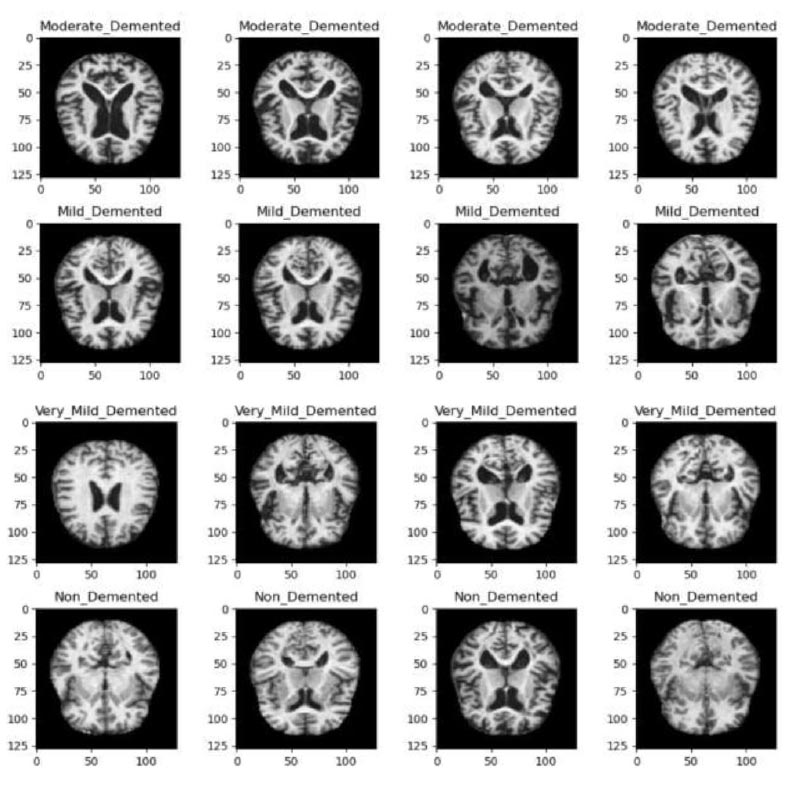
Samples of data from each class in the dataset.
In our research, we ensured that the dataset, although publicly available, was obtained through ethically sound practices, including proper informed consent procedures and adherence to privacy regulations. We also conducted a thorough examination of the anonymization protocols in place to safeguard the identities of the individuals whose data form the basis of our study.
Moreover, throughout our research, we've prioritized transparency and accountability. We've openly acknow- ledged the origin of our dataset, recognizing the individuals who contributed to it, and expressing gratitude for their invaluable contribution to scientific advancement. Additionally, we've implemented robust privacy measures to prevent any potential misuse or unauthorized access to the data.
Furthermore, our study design incorporates ethical considerations by focusing on the potential societal benefits of our research outcomes. We've strived to ensure that our findings serve the greater good, contributing to the understanding and diagnosis of Alzheimer's disease, while simultaneously minimizing any potential risks or harms to the individuals involved.
Continuously mindful of the ethical implications of our work, we've engaged in ongoing ethical oversight, seeking guidance from institutional review boards and ethics committees to ensure that our research aligns with the principles of beneficence, non-maleficence, and respect for persons. By upholding these ethical standards, we aim to conduct responsible research that not only advances scientific knowledge but also respects the dignity and rights of the individuals whose data we utilize.
3. METHODS
3.1. Experimental Setup
The study used 6,400 preprocessed T1-weighted MRI pictures classified into Very Mild Demented, Mild Demented, Moderate Demented, and Non-Demented classes. The dataset was obtained from Kaggle, where the dataset incorporated samples from OASIS 1 and OASIS 2, presenting axial slices of 3D images prominent in OASIS data. No means of preprocessing or data augmentation techniques were employed besides model specific rescaling, this is due to the dataset already being preprocessed to an extent.
The Convolutional Neural Network (CNN) employed in this study featured rescaling, Conv2D layers with increasing filters up to 64, and Spatial Attention layers for relevant region focus. While Dropout layers reduced overfitting by randomly deactivating 20% of neurons, Max-pooling layers shrunk feature maps. Dense layers made it easier to capture complex patterns for image categorization, while a flattened layer came before dense layers for compatibility. The model exhibited robust feature extraction and decision-making capabilities through its usage of intricate and personalized feature mapping and specialized activation functions.
3.2. Dataset Splitting
The dataset is further partitioned into training, testing and validation subsets to facilitate the training and evaluation of any proposed model but further test our model, with this segregation being done in a specified seed.
| Class | Image Count |
|---|---|
| Moderate Demented | 64 |
| Mild Demented | 896 |
| Very Mild Demented | 2240 |
| Non Demented | 3200 |
| - | Class | Image Count |
|---|---|---|
| Training | Moderate Demented | 51 |
| Mild Demented | 716 | |
| Very Mild Demented | 1792 | |
| Non Demented | 2560 | |
| Validation | Moderate Demented | 6 |
| Mild Demented | 89 | |
| Very Mild Demented | 224 | |
| Non Demented | 320 | |
| Test | Moderate Demented | 7 |
| Mild Demented | 91 | |
| Very Mild Demented | 224 | |
| Non Demented | 320 |
The image ratio in accordance with the classes could be specified with 3200 Cognitively Normal scans and the other half of 6400 having very mild to moderate dementia symptoms. This brought the distribution of the images per class, as mentioned in Table 2.
3.2.1. Train Test Validation Split
The obtained Dataset was split into training, validation and testing subsets, with their respective ratio of splits being 0.8, 0.1 and 0.1, and described in Table 3. Fig. (2) illustrates the difference and effect of their splitting ratios.
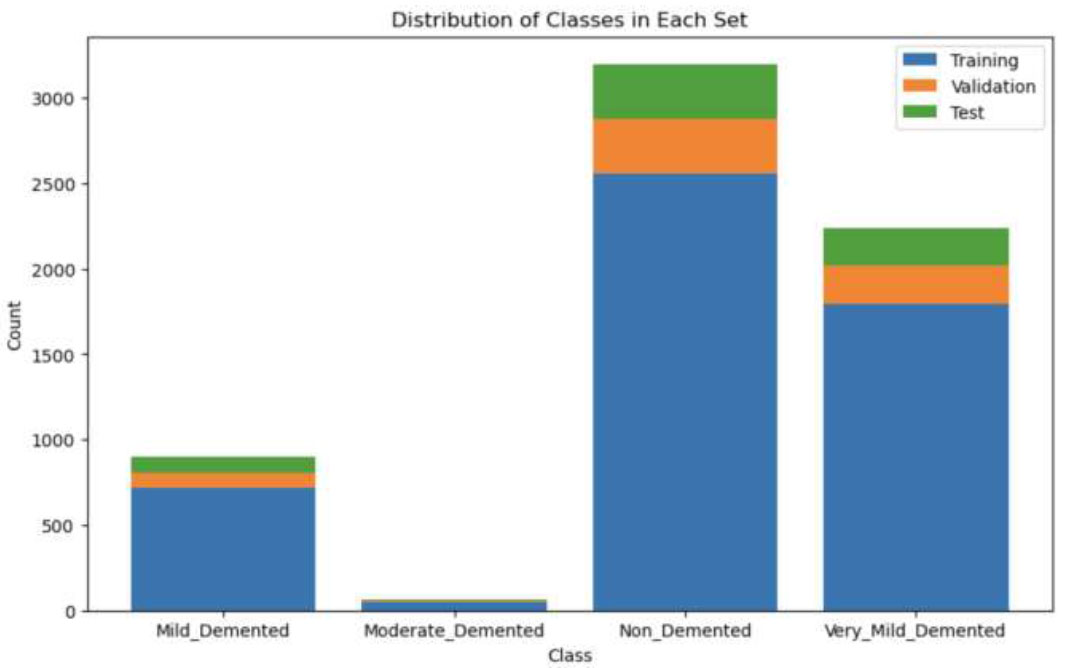
Distribution of all classes in training, validation and test set.
Table 3 presents a breakdown of image counts across different classes in a dataset used for the classification of Alzheimer's disease. The dataset is divided into three subsets: training, validation, and test. Each subset is further categorized into four classes representing different stages of dementia: Moderate Demented, Mild Demented, Very Mild Demented, and Non-Demented. The training set comprises 51 images of Moderate Demented, 716 images of Mild Demented, 1792 images of Very Mild Demented, and 2560 images of Non-Demented cases. The validation set includes 6, 89, 224, and 320 images for each respective class, while the test set consists of 7, 91, 224, and 320 images.
3.3. Data Preprocessing
Before undergoing model development, the dataset undergoes several preprocessing steps to ensure its viability for training. Some of the images associated with the datasets are already preprocessed (i.e. the Kaggle dataset comprising 6400 images is all 128 x 128 in dimensions with justifiable 3 channel dimensions for grayscale images). Image normalization is applied to adjust the values of image pixel intensity. It scales each pixel's intensity by a factor of 1/255, ensuring that the pixel values are within the range [0, 1].
In order to improve the quality of the images, we implemented certain image processing techniques, such as thresholding but they led to a decrease in our model’s performance. Other techniques like filters and noise reduction are not suitable for medical imaging because of their predilection towards reducing essential details provided in the MRI scans that get removed and otherwise would have contributed to the performance of the CNN models.
Since the amount of data for medical imaging, especially for AD classification, is limited, various research projects have experimented with incorporating additional data augmentation techniques, which can especially benefit the distribution of images in the moderate demented class containing a lesser amount of samples as opposed to the other classes. Augmentation techniques included manipulating brightness, zoom, and rotation range, alongside flipping the image to create newer copies. But, we ultimately found that they did not enhance our proposed model and, in fact, caused a decline in our results [26].
3.4. Model Training
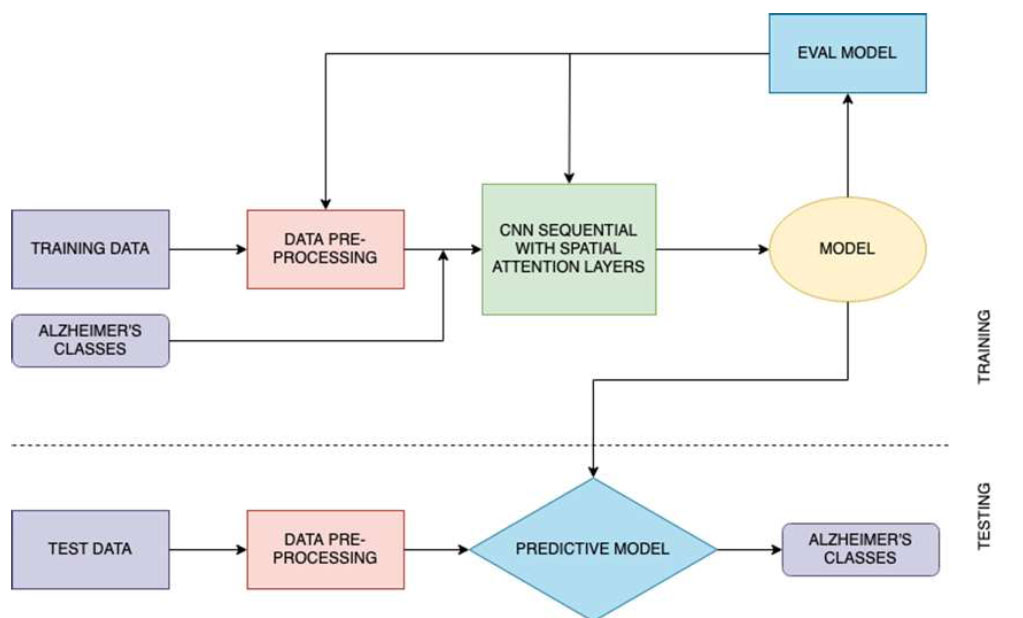
After performing these crucial preprocessing steps, the training set is used to train the model, the validation set for hyperparameter tuning, and the test set for model evaluation. The steps of proposed model training and classification are illustrated in Fig. (3).
Proposed architecture.
3.4.1. Spatial Attention Layer
The Spatial Attention layer operates by computing the average of each channel within the input feature map. This average is then run through a sigmoid function, resulting in a spatial attention map. This spatial attention map is a matrix of weights that are used to regulate the values of the input feature map. The resulting attended feature map is then used by the subsequent layers of the CNN.
The use of the Spatial Attention layer allows the CNN to focus on the most relevant regions of the brain associated with Alzheimer’s.
Alzheimer's disease primarily manifests through the accumulation of abnormal protein aggregates, such as amyloid-beta plaques and tau tangles, leading to widespread neuronal damage and loss. Key regions of interest implicated in the data include the hippocampus, entorhinal cortex, and neocortex, particularly the temporal and parietal lobes. These areas play crucial roles in memory formation, learning, and higher-order cognitive functions, all of which are significantly affected as the disease progresses.
The spatial attention layers identify these ridges and structural features within the T1 weighted images and attenuate the model in order to assign more priority to certain regions, which ultimately helps with Alzheimer’s Disease classification. This is a result of the Spatial Attention layer having the capability to learn to assign higher weights to the regions of the brain that are more indicative of the disease or can have greater significance towards the disease characteristics as opposed to the other regions. As a result, CNN is able to extract more discriminative features from the input brain images.
This layer is incorporated after every Convolution2D and MaxPooling layer, with the initial layers being a rescaling layer, coming around to a total of three spatial attention layer calls sequentially. The layer details are given in Tables 4 and 5.
3.4.2. Convolutional Neural Network
The CNN model comprises multiple layers, including convolutional 2D, MaxPooling, Dropout, and dense layers, with the SpatialAttention layer integrated at key points to focus on relevant image regions. The illustration of the layers of the CNN Sequential Model is given in Fig. (4).
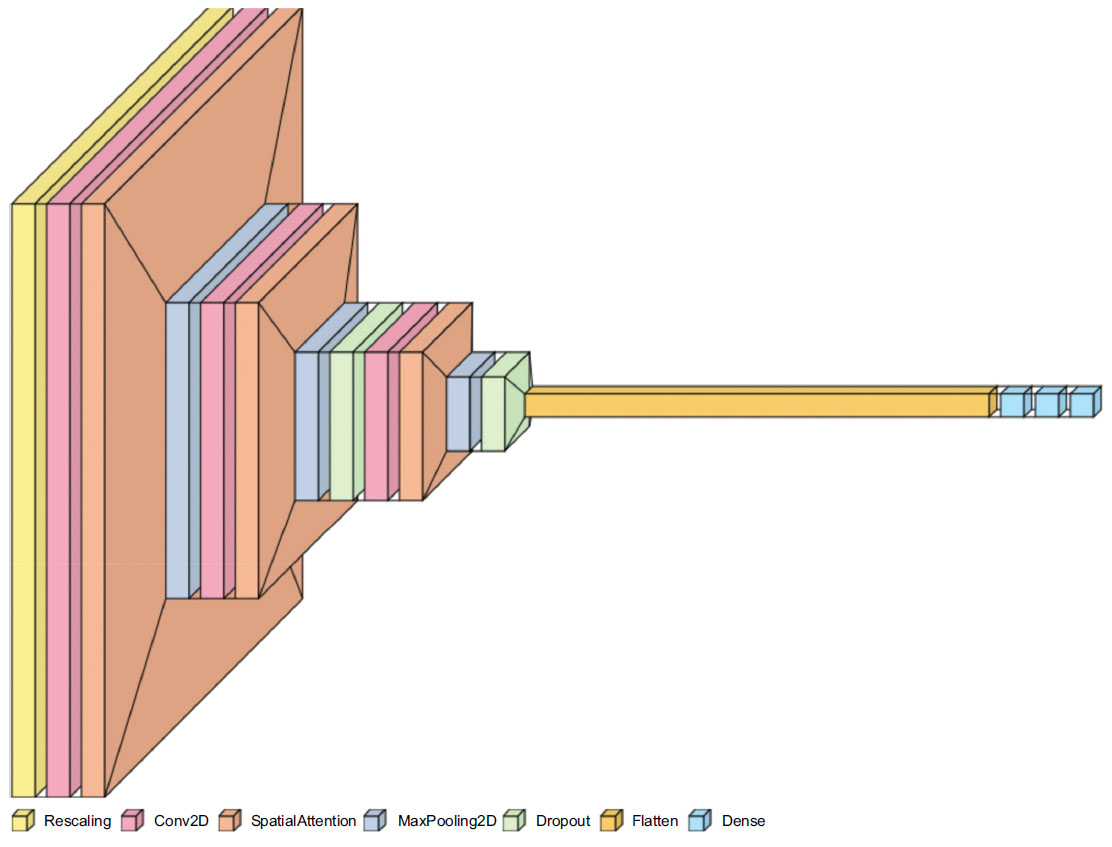
Visualization of layers in the CNN sequential model.
| Layer | Type | Output Shape | Parameters | Explanation |
|---|---|---|---|---|
| Rescaling | Rescaling | (None, 128, 128, 3) | 0 | This layer scales input images by a factor of 1/255 to normalize pixel values between 0 and 1. |
| conv2d | 2D Convolution Layer | (None, 128, 128, 16) | 448 | Convolutional layer with 16 filters and a 3x3 kernel. Applies spatial filters to extract features from the input images. |
| spatial_attention | Spatial Attention | (None, 128, 128, 16) | 0 | Spatial attention mechanism to weight different regions of the feature map adaptively. |
| max_pooling2d | Max Pooling 2D | (None, 64, 64, 16) | 0 | Max-pooling layer with a 2x2 pool size, reducing the spatial dimensions by half, and retaining the most important features. |
| conv2d_1 | 2D Convolution Layer | (None, 64, 64, 32) | 4,640 | Convolutional layer with 32 filters and a 3x3 kernel. Further feature extraction and transformation. |
| spatial_attention_1 | Spatial Attention | (None, 64, 64, 32) | 0 | Spatial attention applied to the features extracted by the previous convolutional layer. |
| max_pooling2d_1 | Max Pooling 2D | (None, 32, 32, 32) | 0 | Max-pooling to downsample the feature map again. |
| dropout | Dropout | (None, 32, 32, 32) | 0 | Dropout layer for regularization, randomly setting a fraction of input units to zero during training. |
| conv2d_2 | 2D Convolution Layer | (None, 32, 32, 64) | 18,496 | Another convolutional layer with 64 filters and a 3x3 kernel, increasing the depth of feature representation. |
| spatial_attention_2 | Spatial Attention | (None, 32, 32, 64) | 0 | Spatial attention applied to the features from the previous convolutional layer. |
| max_pooling2d_2 | Max Pooling 2D | (None, 16, 16, 64) | 0 | Max-pooling again to further reduce spatial dimensions and capture high-level features. |
| dropout_1 | Dropout | (None, 16, 16, 64) | 0 | Dropout layer for regularization to prevent overfitting. |
| flatten | Flatten | (None, 16,384) | 0 | Flattens the feature map into a 1D vector for input to the fully connected layers. |
| dense | Dense | (None, 128) | 2,097,280 | Fully connected layer with 128 neurons, introducing non-linearity and learning high-level representations. |
| dense_1 | Dense | (None, 64) | 8,256 | Another fully connected layer with 64 neurons, further reducing the dimensionality of features. |
| dense_2 | Dense | (None, 4) | 260 | Final fully connected layer with 4 neurons, representing the output classes for Alzheimer's classification. |
| Sr. No | Name | Type | Shape |
|---|---|---|---|
| 0 | rescaling | Rescaling | (None, 128, 128, 3) |
| 1 | conv2d | Conv2D | (None, 128, 128, 16) |
| 2 | spatial_attention | SpatialAttention | (None, 128, 128, 16) |
| 3 | max_pooling2d | MaxPooling2D | (None, 64, 64, 16) |
| 4 | conv2d_1 | Conv2D | (None, 64, 64, 32) |
| 5 | spatial_attention_1 | SpatialAttention | (None, 64, 64, 32) |
| 6 | max_pooling2d_1 | MaxPooling2D | (None, 32, 32, 32) |
| 7 | dropout | Dropout | (None, 32, 32, 32) |
| 8 | conv2d_2 | Conv2D | (None, 32, 32, 64) |
| 9 | spatial_attention_2 | SpatialAttention | (None, 32, 32, 64) |
| 10 | max_pooling2d_2 | MaxPooling2D | (None, 16, 16, 64) |
| 11 | dropout_1 | Dropout | (None, 16, 16, 64) |
| 12 | flatten | Flatten | (None, 16384) |
| 13 | dense | Dense | (None, 128) |
| 14 | dense_1 | Dense | (None, 64) |
| 15 | dense_2 | Dense | (None, 4) |
The initial layer involves rescaling the inputs, converting and normalizing the pixel values to a range of [0,1]. The Conv2D Layers involve a sequence of convolutional layers, extracting features from the input images. Initial layers have 16 filters, slowly doubling in every layer to a maximum of 64, which corresponds to the grid size for every layer. After each convolutional layer, the Spatial Attention layer is applied to highlight significant regions of the feature maps (Eq 1).
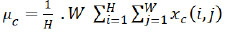 |
(1) |
µc is the mean of channel c.
H is the height of the feature map.
W is the width of the feature map.
xc(i, j) is the value of channel c at position (i, j).
Sigmoid function calculates (Eq 2).
 |
(2) |
Mathematically, this line performs element-wise multiplication between the input tensor and the attention tensor for each channel c (Eq 3):
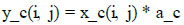 |
(3) |
This is returned back to the model.
Where:
y_c(i, j) is the output value for channel c at position (i, j).
x_c(i, j) is the input value for channel c at position (i, j).
a_c is the attention score for channel c, which scales the input value.
Max-pooling layers reduce the spatial dimensions of the feature maps while preserving important features. In a max pooling (2,2) layer, the feature map is divided into individual regions or windows of size (2,2) pixels. These windows slide over the feature map, moving by 2 pixels horizontally and 2 pixels vertically at a time (in this case). Within each window, the operation selects the maximum value. This maximum value represents the most important feature in that specific window. The selected maximum values from each window are then used to create a new feature map with reduced spatial dimensions. These maximum values are then compiled to construct a new feature map that is half the size of the original one, both horizontally and vertically.
Dropout layers are employed after every MaxPooling layer to prevent overfitting by randomly deactivating a fraction of neurons during training, which can be specified in the model. The optimal value selected for our model was 0.2, which is also a common value taken in other image classification projects. A dropout signifies that for each training example and at each training step, dropout randomly “drops out” (or deactivates) 20% of the neurons in the specified layer. In other words, 20% of the neurons in that layer are set to zero during that training step. This has an effect similar to ensemble learning.
One of the penultimate layers involves a flattened layer, which is applied after the last dropout layer and before the Dense Layers. Flattening in deep learning converts multidimensional data, like the vectors of images or feature maps, into a one-dimensional vector. It's crucial for making this data compatible with fully connected layers and creating a feature vector for tasks like classification. It also decreases the dimensionality and size of the original input vector it processes.
In the context of classifying images, dense layers are used to capture intricate patterns and features extracted from previous layers, enabling the neural network to understand and make decisions about the content of the images. They connect every neuron in a layer to every neuron in the subsequent layer, creating a complex web of connections. This connectivity between the neurons allows them to learn and model intricate relationships within the image data due to the extensive connections. Each neuron in a dense layer computes a weighted sum of inputs and applies an activation function (commonly ReLU), making them capable of capturing various features and patterns in the data.
While the first Dense layer contains 128 neurons in its layers, the number progressively decreases to 64 in the second layer and a final 4 neurons in the final layer. These 4 neurons mimic the number of classes for classification for which a softmax activation function is used.
These layers, as illustrated in Fig. (5), serve as the final step in the network, using the features to classify the images into different categories, making them crucial for image classification tasks .
3.4.3. Activation Functions
The Rectified Linear Unit (ReLU) activation function is used in two dense layers. ReLU is used in CNN dense layers because it introduces non-linearity, aiding in learning complex patterns, particularly for image classification, and is computationally efficient. It also helps mitigate the vanishing gradient problem, making it a popular choice in deep learning. Subsequently, the final classification is 4-class, i.e. between moderate, mild, very-mild and non-demented. The final layer in the CNN network is also a Dense layer that employs the softmax function, which takes a set of numerical scores (logits) produced by the previous layers and transforms them into a probability distribution over multiple classes. Each score is exponentiated and divided by the sum of all exponentiated scores, ensuring that the output values sum to 1, which makes them interpretable as class probabilities. These are mapped to 4 output classes.
4. RESULTS
4.1. Performance Evaluation of Proposed Architec ture
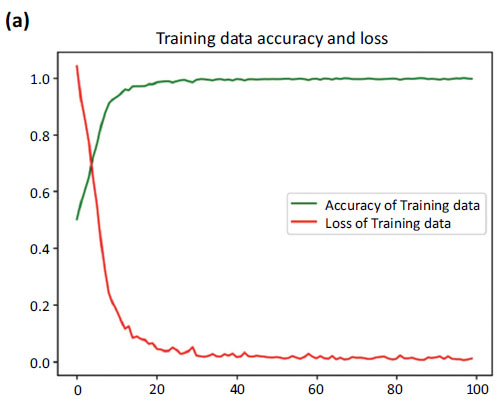
During training, the model achieved a remarkable accuracy of 0.9965 ± 0.003. By the end of training, the model's loss had reached an impressive minimum of 0.0098, reflecting its successful optimization. Notably, it seemed to flatline around the 60th epoch, indicating that the model had achieved stable convergence.
Moving on to the validation set, the model maintained an impressive accuracy of 0.9953 ± 0.0016. The validation data loss, reflecting the generalization capability of the model, remained low at 0.0095 ± 0.004.
Our proposed model has proven to be remarkably accurate, demonstrating its performance in capturing patterns within the training data and its impressive ability to generalize to new data. These results serve as a further testament to the robustness of our model, showcasing its reliability and impressive performance on the validation set. Fig. (6a-c) represents the accuracy and loss dynamics of both the training and validation datasets, which can help enhance our understanding of the proposed model's performance.
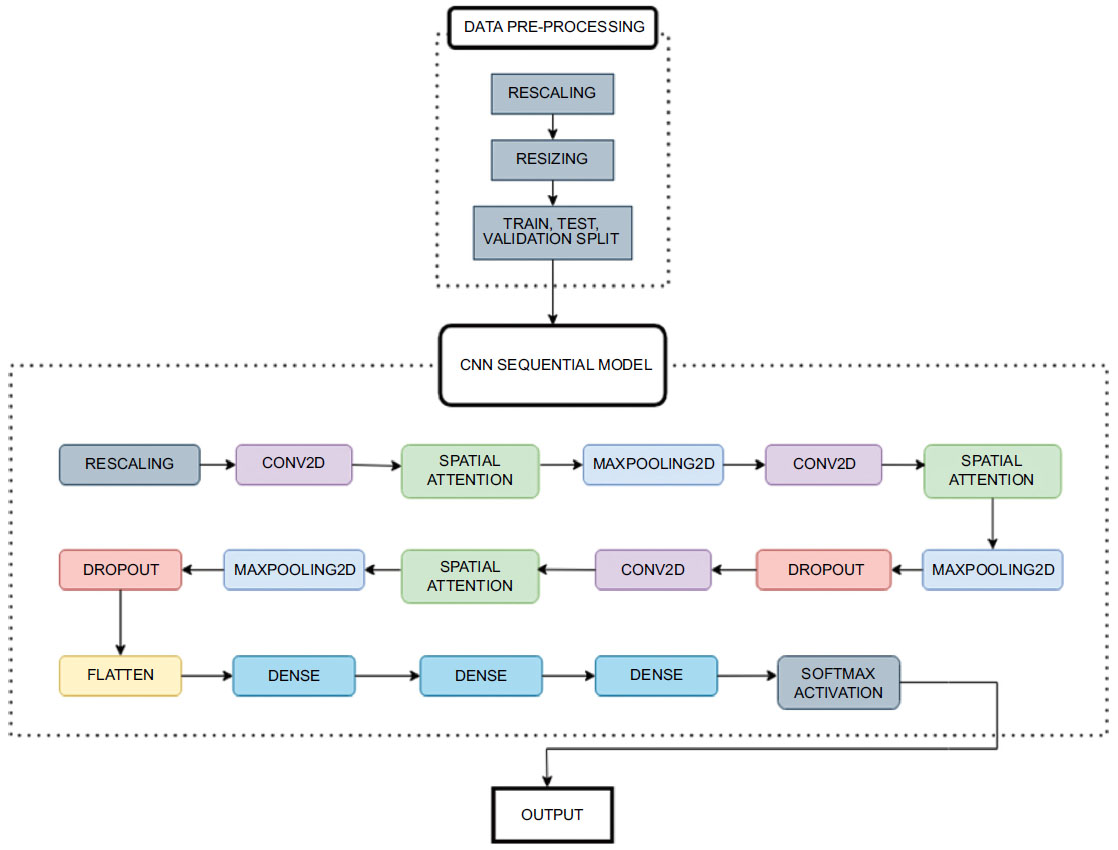
Workflow diagram.
Accuracy and loss curve of training data.
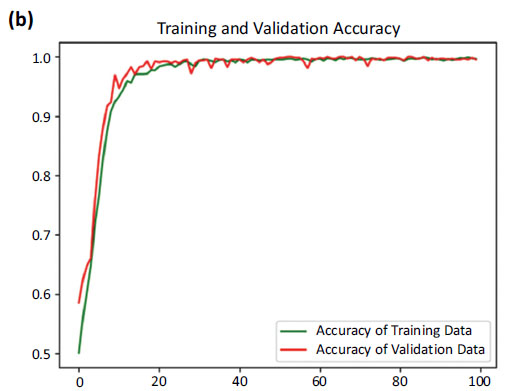
Accuracy curves of training and validation data.
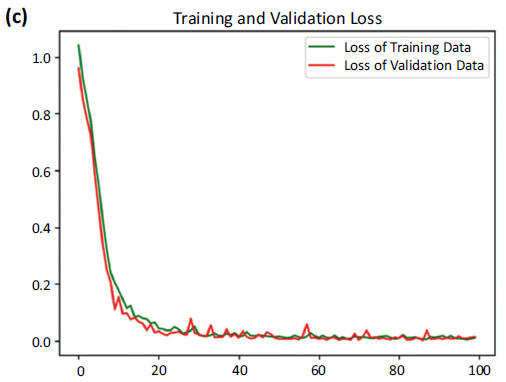
Loss curves of training and validation data.
Fig. (6) provides the accuracy and loss. Fig. (6a) showcases the comparison between the increasing accuracy and decreasing loss of the training dataset over successive epochs on the x-axis. Notably, the loss curve steadily diminishes, approaching nearly zero (0.0098), while the accuracy curve ascends to a near-perfect value, stabilizing at around 0.9965.
Fig. (6b) shows a comparison between the accuracy curves of training and validation data, offering insights into how well the model generalizes to unseen instances. Fig. (6c) focuses on the comparison between the loss curves of training and validation data.
But when it came to the testing dataset, an accuracy of 1.0 i.e. 100% was obtained, with a loss on the test dataset equal to 0.0051. The confusion matrices are shown in Fig. (7a and b) on testing data and validation data. The number of misclassifications is closer to zero in all the classes in the case of testing data. However, in the case of validation data, there is one misclassification in the case of non-demented and very_mild_demented classes.
4.1.1. ROC AUC Scores
The Receiver Operating Characteristic (ROC) curves for each class shown in Fig. (8a) reflect a highly effective classifier on the validation test. With Area Under Curve (AUC) values close to 1.0, the model demonstrates robust discriminatory power in distinguishing between different levels of dementia and non-demented cases. This performance underscores the model's reliability and accuracy in the classification task for dementia severity. The ROC curve for the testing set shown in Fig. (8b) reveals a model that performs at the highest level of accuracy for each class, achieving perfect discrimination between different levels of dementia severity and non-demented cases. This outcome underscores the model's exceptional reliability and effectiveness in dementia classification on the testing data.
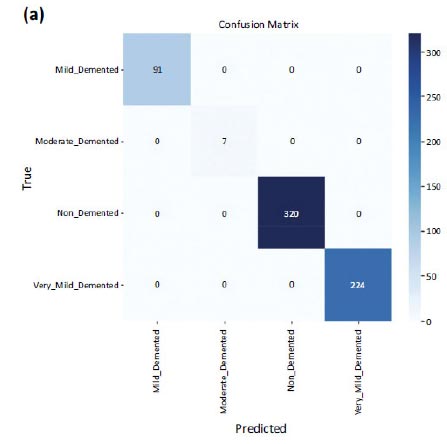
Confusion matrix of testing data.
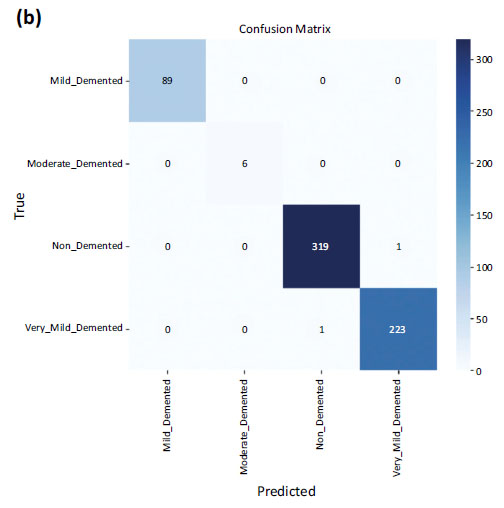
Confusion matrix of validation data.
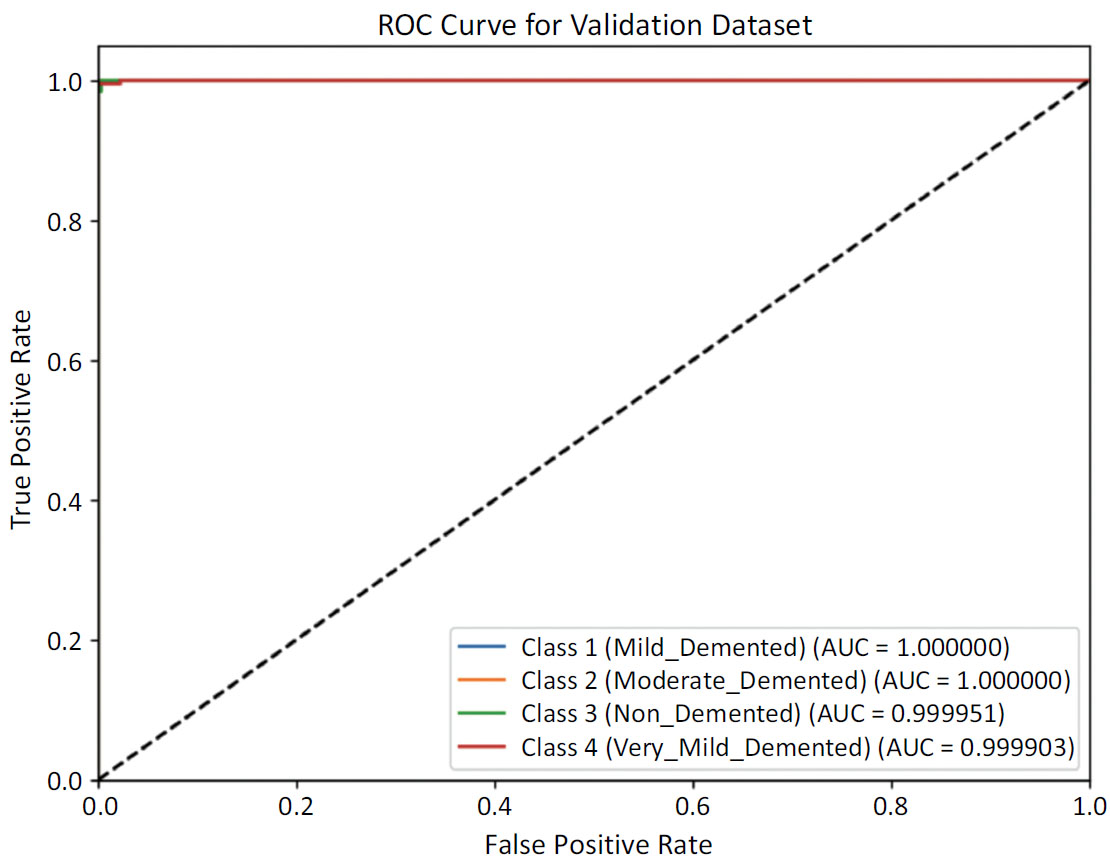
ROC curve for validation dataset.
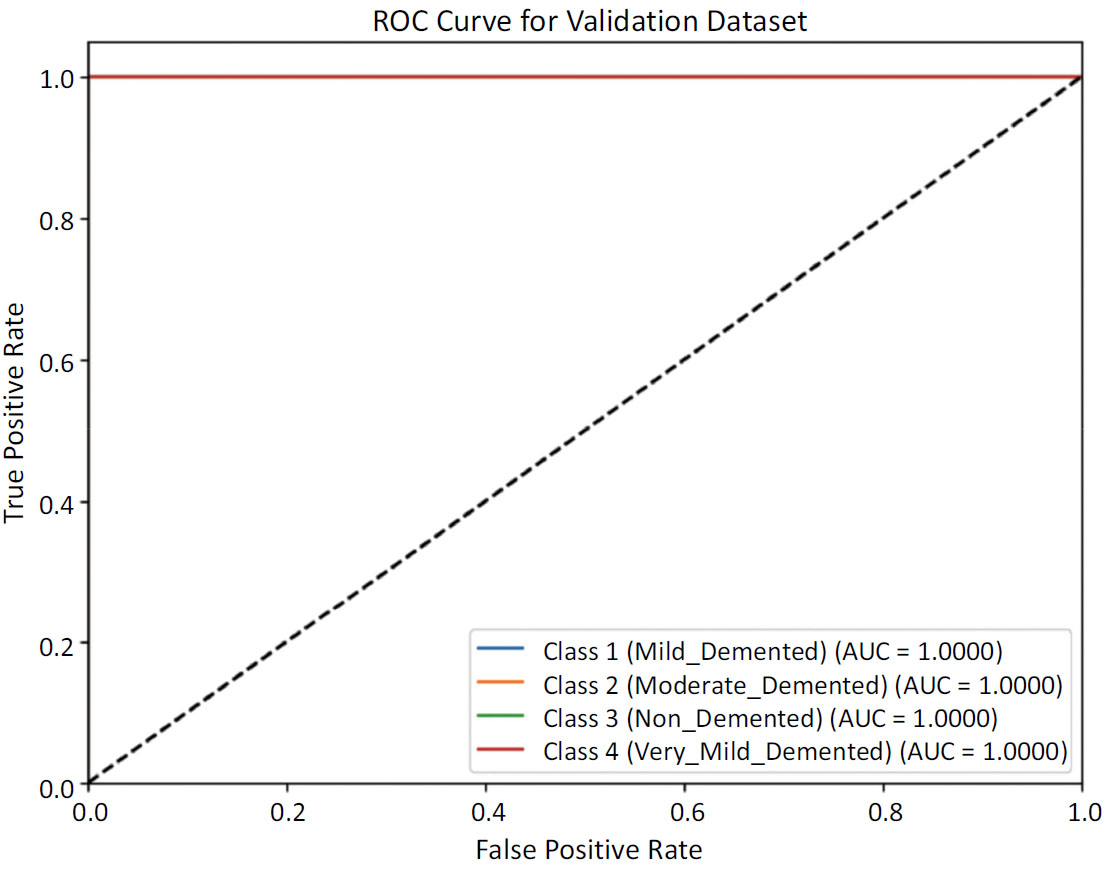
ROC curve for testing data.
4.2. Comparison with State-of-the-art Techniques
Our research paper provides a thorough evaluation of different convolutional neural network (CNN) structures for classifying Alzheimer's scans into four specific categories: Very Mild Demented, Mild Demented, Moderate Demented, and Non-Demented. The results of our experiment present essential performance metrics such as test accuracy, sensitivity, and specificity, which offer crucial insights into the effectiveness of each model.
4.3. Result Reproducibility and Transparency
The aforementioned results were obtained through the usage of specific dataset splits for training, testing and validation, which involved breaking down the dataset into a training set, a testing set as well as a validation set, in the ratio 0.8: 0.1: 0.1 as visualized in Fig. (2). The segmentation and distribution of images into a particular set was done so through python’s train test split module. One of the parameters in the function involves a ‘random_state’ variable which, when set to a specific number, ensures reproducibility of the ratio and distribution of these images. With means to the Convolutional Neural Network model, the hyperparameters were set based on the optimal performance of the model. These hyperparameters include filters, kernel_size, padding, and activation functions, all of which can be reproduced based on the specific model setup required.
5. DISCUSSION
Table 6 consists of a thorough comparison between our results and those of other widely used pre-trained models that apply the transfer learning strategy [26]. We specifically contrasted our approach with popular architectures such as VGG16, ResNet50, Inception V3, EfficientNetB7, and DenseNet121, which were all utilized after being pre-trained on the ImageNet dataset. With an impressive test accuracy of 96.39%, VGG16 firmly establishes its robustness in detecting complex patterns in scans. DenseNet121 follows closely with a commendable test accuracy of 96.29%. Despite having a lower test accuracy of 89.85% and 87.71%, respectively, ResNet50 and InceptionV3 excel with perfect sensitivity and specificity, making them highly effective models. Another work that utilizes shallow Convolutional Neural Network exhibits an impressive 99.68% accuracy, coupled with perfect sensitivity and specificity. These findings truly emphasize the effectiveness of this approach.
5.1. Unique Contributions and Practical Implications
Our study aims to improve the precision of identifying Alzheimer's disease by incorporating a spatial attention mechanism into a sequential CNN model. This stands apart from conventional models that lack this critical element. Our innovative methodology has shown significant success, surpassing the effectiveness of traditional models in key metrics such as test accuracy, sensitivity, and specificity – achieving a perfect test accuracy, as well as sensitivity and specificity of 100%. Our proposed algorithm boasts an impressive novel feature: the inclusion of a spatial attention mechanism. This proved to be a highly effective and promising strategy for enhancing the classification of Alzheimer's disease. Our study not only evaluates well-established CNN architectures but also represents a testament to an innovative and intuitive approach. By incorporating spatial attention mechanisms, we have made significant progress in the realm of Alzheimer's diagnosis through image classification. The impressive results of our algorithm serve as a reminder of the crucial role spatial relationships play in medical image analysis [25], especially in the context of neurodegenerative diseases.
The practical implications of our research are significant. Our algorithm has demonstrated remarkable accuracy, sensitivity, and specificity, indicating its potential for practical use in clinical settings. By utilizing this enhanced performance, medical professionals can greatly benefit in accurately and efficiently diagnosing Alzheimer's disease through neuroimaging data [27]. Furthermore, the incorporation of spatial attention mechanisms presents exciting opportunities for future advancements and exploration in the field of medical image analysis.
| Ref. | Title | Test Accuracy | Sensitivity | Specificity |
|---|---|---|---|---|
| [26] 2023 |
VGG16 | 96.39 | 99.29 | 100 |
| DenseNet121 | 96.29 | 100 | 100 | |
| ResNet50 | 89.85 | 100 | 100 | |
| InceptionV3 | 87.71 | 99.12 | 100 | |
| An MRI-based deep learning approach for accurate detection of Alzheimer’s disease | 99.68 | 100 | 100 | |
| - | Proposed Model | 100 | 100 | 100 |
In conclusion, our study not only evaluates established CNN architectures, but also introduces an intuitive approach that surpasses the performance of traditional models. The addition of spatial attention mechanisms in our algorithm makes a notable contribution to the field of Alzheimer's diagnosis through image classification.
5.2. Limitations
The spatial attention layer operates by computing a set of operations on the average pixel values of each channel, following which it undergoes several other transfor- mations through functionsun through a sigmoid function, resulting in a spatial attention map. This spatial attention map is a matrix of weights that are used to regulate the values of the input feature map. The resulting attended feature map is then used by the subsequent layers of the CNN.
This set of operations remains uniform for every passed input. So far, the utilized data comprises 6400 test subjects to which our model has generalized adequately, taking into account specific regions which may hold higher propensity towards Alzheimer’s stage detection.
This can help only when being used on the same form of imaging as utilized in our model training, i.e. T1 weighted Brain MRI of the axial plane. However, in order to achieve our future scope of being able to map out progressive classification over time for Alzheimer’s patients, the model would be required to be trained using MRI training images for patients over time, for which the current model is not able to generalize available data.
6. FUTURE SCOPE
Future efforts on this subject have a plethora of potential, especially in terms of advancing the detection and classification of Alzheimer's disease. A particularly interesting direction for future research is to add T2-weighted MRI scans to the existing T1-weighted scans. This feature makes use of the additional data provided by T2-weighted imaging in an effort to reveal a more complex understanding of the structure of the brain. Using MRI in conjunction with other imaging modalities, such as PET and CT scans, increases the possibility of identifying Alzheimer's disease early on. Accurate and precise results are more likely when metabolic and structural data from different imaging modalities are integrated. Moreover, by switching from conventional 2D slices to sophisticated 3D MRI pictures, the model can now record a complete picture of the brain. This evolution may capture complex spatial correlations and enhance the model's capability to detect the smallest irregularities [28].
CONCLUSION
Deep learning algorithms play a pivotal role in today’s medical applications, ushering into an era marked by AI-assisted healthcare. With its unique propensity to understanding and being able to segment MRIs, PETs and other medical scans, their use in the classification of maladies and diseases offer enthusiastic and unpre- cedented accuracy and efficiency, thereby revolutionizing disease diagnosis and patient care.
Our study on Alzheimer's classification, employing a spatial attention-based convolutional neural network, obtained a testing accuracy of 99.68%. This indicates the model's robustness in accurately distinguishing between very mild, mild, moderate, and non-demented stages of the disease. The incorporation of spatial attention mechanisms enhances the model's sensitivity to subtle spatial patterns, emphasizing more prevalent and susceptible regions in the MRI, contributing to its high accuracy. The evaluation metrics, including precision, recall, and F1 score, further underscore the model's reliability. Beyond its exceptional performance, our proposed approach holds promise for early detection and intervention, offering a valuable tool for healthcare professionals. The reported testing accuracy reflects not only the model's predictive power but also its potential clinical applicability, marking a significant stride in Alzheimer's disease classification.
AUTHORS' CONTRIBUTION
It is hereby acknowledged that all authors have accepted responsibility for the manuscript's content and consented to its submission. They have meticulously reviewed all results and unanimously approved the final version of the manuscript.
LIST OF ABBREVIATIONS
| AD | = Alzheimer's disease |
| CNN | = Convolutional Neural Network |
| MRI | = Magnetic Resonance Imaging |
| MCI | = Mild Cognitive Impairment |
| AUC | = Area Under the Curve |
| GLM | = Generalized Linear Model |

