All published articles of this journal are available on ScienceDirect.

Optimizing Low-grade Astrocytoma Radiotherapy Dose Prediction through Image-based Discriminative Models
Authors Info & Affiliations
Abstract
Introduction
Low-grade astrocytomas are slow-growing yet invasive brain tumors that may progress to high-grade forms if treatment fails. Post-surgical radiotherapy is essential but requires precise dose planning to maximize efficacy and minimize harm to healthy tissue. This study aims to predict optimal radiotherapy dosage and number of sessions for astrocytoma patients using MRI images and clinical data.
Methods
Data from 33 patients—including 2,745 MRI images (axial, sagittal, and coronal views, 512 × 512 pixels) and clinical/treatment information—were collected from the Mahdieh Radiation Oncology Department. Regression models were developed to estimate the number of radiotherapy sessions and dosage, while classification models assigned patients to one of four dose categories based on prior data. A hybrid feature extraction model combining a Vision Transformer (ViT) and Convolutional Neural Network (CNN) was used, followed by Multilayer Perceptron (MLP), Support Vector Machine (SVM), and Random Forest algorithms.
Results
The CNN_VIT-b16 model delivered the best performance, predicting session numbers with a mean absolute error of 0.005 and R2 of 0.993, and dosage with a mean absolute error of 0.0034 and R2 of 0.998. In the classification task, it achieved an accuracy of 0.99 and an F1 score of 0.99 on the test data.
Discussion
The hybrid CNN-ViT model accurately predicted radiotherapy plans based on imaging and clinical features, supporting its role as a decision-support tool for personalized treatment. Nevertheless, further validation with larger, more diverse cohorts is necessary.
Conclusion
This study demonstrates that a diagnostic-aided model using MRI and clinical data can effectively personalize radiotherapy planning for astrocytoma, with promise for enhancing treatment precision and safety.
1. INTRODUCTION
Astrocytomas, originating within the brain itself, pose a considerable threat due to the complexities involved in both identifying and managing them. Slower-growing, lower-grade astrocytomas represent a prevalent type of brain tumor, with the potential to evolve into more aggressive, higher-grade forms if interventions prove unsuccessful [1]. Aligned with the World Health Organization's 2016 categorization of central nervous system tumors, astrocytomas are distinguished as either low-grade (LGA, WHO II) or anaplastic (AA, or high-grade, WHO III), each requiring distinct treatment approaches and exhibiting varying prognoses [2]. Low-grade astrocytomas are infiltrative brain tumors that stem from glial cells, often emerging unexpectedly in young or middle-aged individuals. Their expansion rate is typically more gradual compared to higher-grade variants. Representing 10-20% of primary brain tumors, low-grade astrocytomas constitute a noteworthy subset of these conditions [3].
The patient's initial symptoms and imaging results are key factors in guiding the management of astrocytoma [4]. Seizures are the most common symptom of the disease, which occurs in 80% of patients. Other common symptoms include headaches, sluggishness, fatigue, and variations in personality. For some other patients, disease detection may be postponed due to the tumor's slow growth rate. Surgical intervention is often required when symptoms arise from mass effect or increased intracranial pressure. However, managing patients who show no tumor growth on imaging and whose symptoms are effectively managed with medication presents a greater challenge and elicits debate [5, 6].
Survival rates for astrocytoma vary widely depending on the tumor’s grade, location, size, and the patient’s age and overall health, ranging from approximately 4.7 to 10 years [7]. The 5-year survival rates for low and high grades of astrocytoma are about 80 and less than 5%, respectively. Regardless of tumor grade, astrocytomas are highly infiltrative and resistant to treatment, thus becoming largely incurable [8].
While the query provides an estimate of 2,000 to 3,000 low-grade astrocytoma diagnoses per year, a 2017 estimate reported 1,410 new cases of diffuse astrocytoma in the United States5. Low-grade astrocytomas account for 10-20% of primary brain tumors1. Low-grade astrocytomas are predominant in individuals aged 30 to 40, comprising about one-fourth of adult cases. The peak incidence of astrocytomas generally occurs in people aged 35 to 44 years, and they are more frequently observed in white individuals and males. Identifying factors impacting survival in astrocytoma patients remains a crucial area of investigation [9].
The best treatment methods include surgery and tumor removal, radiation therapy and chemotherapy [9]. Radiotherapy is one of the essential ways to deal with and treat all types of brain tumors. Radiotherapy is effective in controlling tumor growth and excessive hormone secretion in patients with pituitary adenoma.
For tumors like optic tract glioma, radiotherapy—used alone or with surgery/chemo—achieves 70-95% long-term control. Protocols specify total dose (50-60 Gy), section dose (2-1.8 Gy), and treatment days (5/week). Normal brain structures are sensitive to these parameters, affecting late effects. 3D conformal radiotherapy, where beams conform to the tumor's shape, is the standard CRT method [10].
During the previous years, different medical imaging techniques have been exploited for disease diagnosis [11]. However, with emerging novel imaging techniques, radiologists encounter a growing amount of data for detecting diseases and planning patient treatment. Therefore, it becomes necessary to use automatic and intelligent systems in such matters.
Deep neural networks (deep learning) are the emerging trend of machine learning models with a high popularity for medical image analysis. End-to-end models for performing both tasks of feature extraction and prediction simultaneously have been used instead of handcrafted feature extraction to reduce the dependency of data scientists on domain knowledge for feature extraction and prediction tasks while providing high accuracy for automatic diagnosis and treatment designing [12]. Machine learning, particularly deep learning, has been widely applied in various medical image analysis tasks [13].
There are three fundamental limitations of existing approaches including:
1.1. Overcoming Isolated Feature Analysis in Conventional Models
Current CNN-based methods focus exclusively on local tumor morphology from MRI slices, while clinical systems often rely on manual geometric measurements of tumor boundaries. Our dual-stream architecture directly integrates:
a-1) Local texture analysis via ResNet-34 (processing 128×128 MRI patches).
a_2) Global spatial relationships through ViT-b16's self-attention across whole-image regions.
We hope this combination will reduce dose prediction errors compared to ViT-only implementations in ablation studies, demonstrating superior modeling of tumor-structure interactions critical for dose planning.
1.2. Bridging the Multimodal Integration Gap
Traditional clinical workflows process imaging and patient data separately, while prior computational models use simplistic early fusion (concatenating features). Our model introduces:
b-1) Dynamic attention gates that weight MRI features against clinical parameters (age, tumor volume, surgery history)
b-2) Joint optimization of radiation dose and session count through parallel MLP heads
We hope this architecture will achieve a higher R2 score compared to early fusion baselines by preventing clinical data dominance over imaging features.
2. BACKGROUND
Novel deep learning models have significantly impacted medical image analysis and offer promising applications in medical fields, including brain cancer. This section reviews relevant research proposing and using deep learning methods for the diagnosis of brain tumors from MRI images. While the studies reviewed here do not directly focus on predicting the dose required by patients, they demonstrate the ability of neural networks for various tasks for brain cancer diagnosis.
2.1. Brain Tumor Classification
Diagnosing brain tumor types and grades is an interesting research area based on its importance and necessity. In a study, two classification models, SVM and Lasso, were used to classify high-grade and low-grade glioma tumors, utilizing pre-processed MR images along with tumor location and size. The feature extraction method used in this research was based on region of interest (ROI) analysis [14]. In another study, some pretrained neural networks were exploited and compared for the discrimination of brain tumor types, including glioma, meningioma, and pituitary, by examining MR images from a publicly available research dataset [15]. Also, in another study, a completely automatic method was presented for segmenting MRI images and determining tumor types, including meningioma, glioma, and pituitary tumors, using a deep neural network [16].
Most previous studies have designed and used Convolutional Neural Networks (CNNs) from scratch or used pre-trained CNNs for MRI image analysis. However, numerous deep neural networks have been proposed in recent years, including Recurrent Neural Networks (RNNs), Autoencoders (AEs) [17], and Vision Transformers, which utilize self-attention mechanisms and support parallel processing for feature extraction [18].
In 2019, the vision transformer was introduced by a study [19]. The goal of this new approach is to process images without relying on traditional convolutional operations commonly used in computer vision tasks. While self-attention mechanisms in transformers were originally designed to capture relationships between words in the text, Vision Transformers have extended this concept to computer vision and image processing. The key idea behind the vision transformer was to first divide the input images into a set of patches, which are then transformed into vectors. These vector representations are treated like “words” in a typical transformer and allow the model to capture the relationships between different pieces of an image. Today, the performance of a transformer model is surpassing convolutional neural networks (CNN) in image classification tasks. In a 2024 study, he compared the performance of CNN and VIT networks on x-ray images of patients with COVID-19 [20]. The impact of the vision transformer has extended beyond the confines of research labs and into real-world applications. The combination of VIT networks with CNN networks has brought about significant advances in the field of medicine [21].
2.2. Deep Neural Networks and Transformers Applications
Recent years have witnessed a surge in the application of deep learning, particularly transformer-based models, for diverse medical image analysis tasks. For instance, in the domain of neurological disorders, researchers have explored the use of dual-patch attention mechanisms for epileptic seizure prediction [22-24] and mixed transformer architectures for the early diagnosis of multi-class Alzheimer's disease [25]. Furthermore, the effective diagnosis of acute bilirubin encephalopathy through multi-modal neonatal Magnetic Resonance Imaging has been achieved using multi-transformer networks, highlighting the capability of these models to integrate information from different imaging modalities [26]. These studies demonstrate the increasing trend towards employing sophisticated deep-learning architectures to tackle complex diagnostic challenges in medicine.
Beyond diagnostic accuracy, the interpretability and robustness of deep learning models are gaining increasing attention. Explainable AI (XAI) frameworks are being developed to provide insights into the decision-making processes of these models, as exemplified by the use of relevance-aware capsule networks for breast cancer detection in mammography images [27]. Additionally, the evaluation of model dependence on data complexity is crucial for ensuring reliable performance across diverse datasets. Studies focusing on brain MRI images have explored the relationship between data complexity and model performance in the classification of brain tumors and Alzheimer's disease [28]. These advancements underscore the importance of not only achieving high accuracy but also ensuring the transparency and generalizability of deep learning models in medical image analysis.
3. MATERIALS AND METHODS
3.1. Dataset
In this study, brain MRI images of patients with low-grade astrocytoma were collected from Mahdieh Imaging and Radiology Center located in Hamadan, Iran. Since this study required the collection and integration of various datasets, including MRI images, clinical data, and patients' medical histories, these datasets were obtained separately. Therefore, only patients with complete and accessible information were included in the analysis.
Thirty-three patients were examined in this center and 2745 MRI images were extracted in 3 directions in DICOM format from the PACS system of Mahdieh center, which can be seen in Fig. (1). In addition to these images, other demographic information about the patients was also reviewed, including gender, age, disease symptoms, history of surgery before radiation therapy, and details of the patients' radiology sessions, such as the number of radiotherapy sessions, the dose used in each session, and the total dose administered during the course of treatment. The medical and radiotherapy files of the patients were collected. Finally, the data collected from the patient's files were tabulated and saved in an Excel file. Patients suffering from low-grade astrocytoma were confirmed by the pathology reports of the patients and the treatment method prescribed for each patient by the specialist doctor of the center.
The sample size in this study was determined by the availability of complete and well-documented patient data at the Mahdieh Radiation Oncology Department during the study period. Collecting comprehensive data, including MRI images, clinical characteristics, and detailed treatment records, is a time-consuming and resource-intensive process. We aimed to maximize the number of patients included while ensuring the integrity and completeness of the data. Given the retrospective nature of our study and the challenges associated with data collection, we believe that the 33 patients represent a valuable initial dataset for exploring the feasibility of using deep learning models for astrocytoma radiotherapy dose prediction.
We acknowledge that this sample size may limit the generalizability of our findings and the statistical power of our analyses. The best way to mitigate the limited sample size is to implement a stratified 5-fold cross-validation strategy, ensuring each fold maintains the original class distribution.
3.2. Preprocessing
MRI images were collected in DICOM format from the PACS system. First, the images were converted from DICOM (Digital Imaging and Communications in Medicine) format to JPG format with a resolution of 512 x 512 pixels for easier access and display and processing by the model. DICOM is a format of medical imaging standard [23].
In the next step, the textual information inside the images was removed to reduce the error in the neural network model. Finally, due to the high volume of images and with the aim of reducing computing costs, the resolution of the images was changed to 128 x 128 pixels.
We reduced the image resolution to 128x128 pixels primarily to manage computational costs and memory requirements, given the large number of images (2745) and limited computational resources. This resolution was chosen as a trade-off between computational efficiency and the preservation of essential tumor features.
Also, the image pixels were normalized to a range between 0 and 1 after loading the model. The required columns of tabular data were also pre-processed by the One-hot-encoding method to remove the sequential effect in the classification problem.
3.3. Define Problem
In this research, the two problems of regression and classification were investigated simultaneously by a model designed with multiple outputs. In the regression problem, the goal of the model is to accurately and simultaneously predict the best prescription dose along with the number of sessions required for each patient according to past data. In the classification problem, first, the prescribed dosage range for each patient was specified and then this range was divided into 4 classes. Thus, patients with a prescribed dose of less than 5000 were placed in class 1, between 5001 and 5500 in class 2, between 5501 and 6000 in class 3, and above 6001 in class 4. 2D CNN model and Vision Transformer-b16 and Vision Transformer-b32 networks were used for feature extraction. Machine learning and neural network algorithms were used in the models designed for the classification problem. In the following sections, we will examine the architecture of the top models according to the selected data.
3.4. CNN-VIT-b16
In this model, two inputs were considered: tabular data and MRI images. To extract features from the MRI images, they are fed into a VIT-b16 network and a CNN in parallel. For the VIT-b16 network, the linear classification layer and softmax, responsible for data classification, were removed to repurpose it for feature extraction. After feature extraction from the VIT-b16 network, a Flatten layer was applied to flatten the data. The CNN branch consisted of three convolutional layers with 16, 32, and 64 kernels, respectively, each using a 3x3 kernel size.
After each convolutional layer, a Max pooling layer was used to reduce the dimensions. Subsequently, another convolutional layer with 64 filters was applied, followed by another Max pooling layer to increase data depth. Before combining with tabular data, the flattened outputs from the VIT-b16 network and the CNN were merged into a single feature matrix using a Flatten layer.
The tabular data was processed separately through four dense layers (64, 64, 128, and 128 neurons). The output of the dense layers and the feature matrix from the images were then merged and fed into three dense layers with 512 neurons each.
Finally, the model produced three outputs: one for predicting the number of radiation therapy sessions (regression), one for predicting the total radiation therapy dose (regression), and one for classifying the patient into one of the four dosage classes (classification).
For the regression outputs, a single neuron without an activation function was used. For the classification output, four neurons with a Softmax activation function were used for the four-class classification. All other layers employed the ReLU activation function. ViT is particularly well-suited for this task because, unlike CNNs, which primarily capture local features, ViTs leverage a self-attention mechanism to model long-range dependencies within the entire MRI image, allowing the model to consider the relationships between the tumor and distant critical structures like the optic chiasm or brainstem, which is crucial for precise dose prediction and sparing healthy tissue during radiotherapy planning; furthermore, ViTs can handle the high-resolution images typical in medical imaging without the computational limitations of some other architectures.
ViT-b16 and ViT-b32 refer to Vision Transformer models (Dosovitskiy et al., 2020) with different configurations. The 'ViT' component utilizes a transformer-based architecture to capture long-range dependencies within the MRI images, while 'b16' and 'b32' denote specific model configurations with a base architecture and 16 or 32 transformer blocks, respectively, influencing the model's capacity and computational complexity.
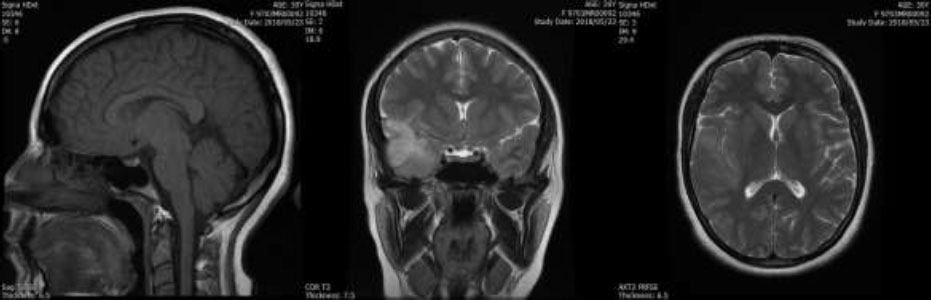
An example of MRI images of patients in four different views: left, posterior, and superior, from left to right.
3.5. SVM_RF_VIT-b16
In the proposed model, SVM-RF-VIT, similar to CNN-VIT-b16 architecture, was used in feature extraction from VIT and CNN networks. In other words, VIT and CNN are used as models that extract features from input MRI images. In this model, the default support vector machine (SVM), which is a linear SVM, was used in the regression problem and the random forest (RF) algorithm with N = 97 was used in the classification problem. The feature embeddings extracted using VIT and CNN are concatenated and fed to SVM and RF as their input.
3.6. VIT-b32
In order to compare the two models of VIT-b16 and VIT-b32, all models with VIT-b32 were also examined.
3.7. Train Model
A 5-fold cross-validation sampling strategy is used for splitting data into training and test datasets. Also, 20% of training data as the validation data is sampled from the training dataset.
The hyperparameters were tuned using the Grid Search method. Optimizer, batch size and learning rate and number of epochs are considered hyperparameters. According to the values obtained as the best hyperparameters’ value, the designed models were trained with a batch size = 64 and epochs = 100 with a learning rate of 0.001 and a reduction rate of 98% with the aim of reducing fluctuations during training. Adam was used as the optimizer function.
The cost function and evaluation criteria during model training can also be seen in Table 1.
4. RESULTS
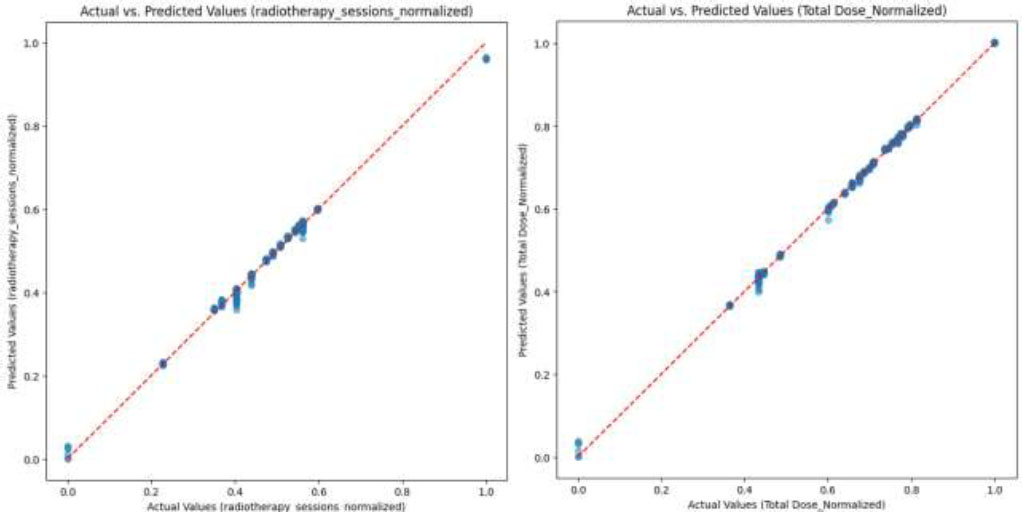
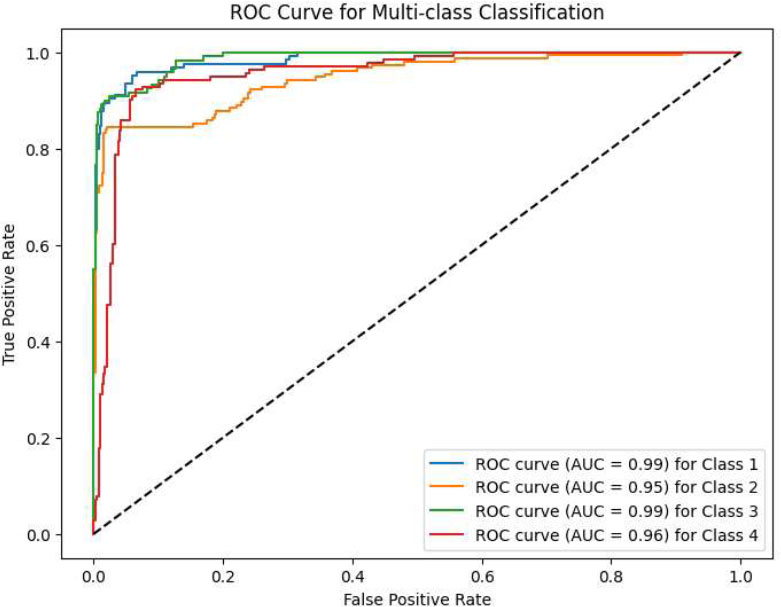
The experimental results are described in three parts. Predicting the number of radiation therapy sessions for each patient, predicting the dose of radiation therapy for each patient and classifying patients into 4 classes. In the CNN-VIT-b16 model, the model achieved 99% accuracy in the classification problem and R2 score of 99.3% in predicting the number of radiotherapy sessions and an R2 score of 99.8% in predicting the number of prescribed dose sessions for each patient.
| Classification | Regression |
|---|---|
| Loss function: MAE Metric: MAE |
Loss function: Categorical_CrossEntropy Metric: Accuracy |
The high R2 values indeed warrant careful consideration. To address this, we implemented several regularization techniques:
L2 Regularization: We applied L2 regularization to the weights of the MLP layers, with a regularization strength (lambda) of 0.001, to prevent the model from relying too heavily on any single feature.
Dropout: We incorporated dropout layers with a rate of 0.5 after each fully connected layer in the MLP. This helps to prevent co-adaptation of neurons and further reduces overfitting.
Early Stopping: During training, we monitored the validation loss and implemented early stopping to prevent the model from overfitting to the training data. The training process was halted if the validation loss did not improve for 10 epochs.
The details of the CNN-VIT-b16 model results are displayed in Figs. (2-6).
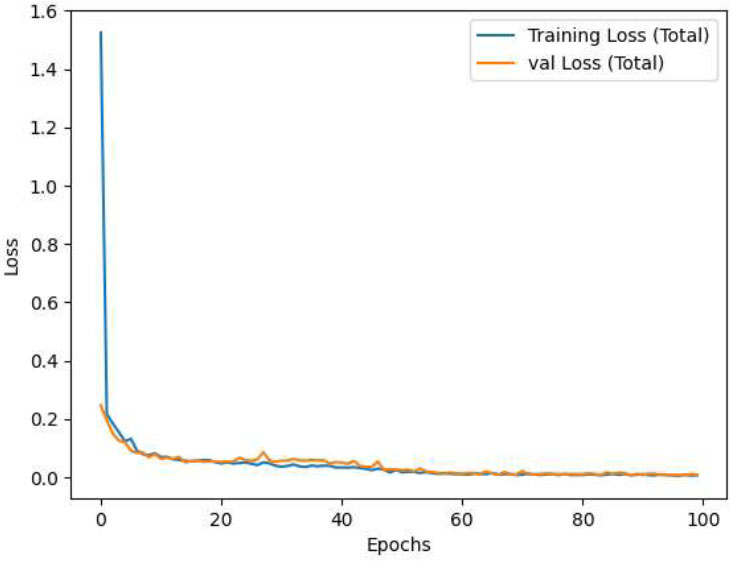
CNN-VIT-b16 loss per epochs.
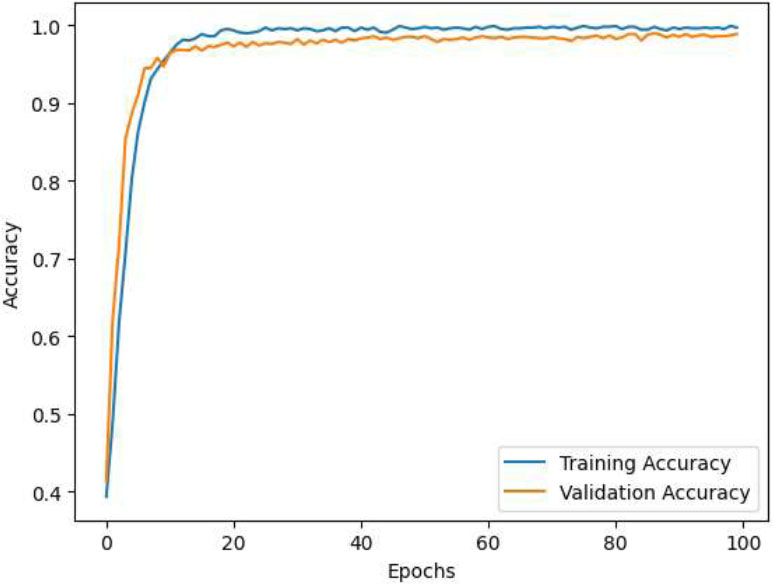
CNN-VIT-b16 accuracy per epochs.
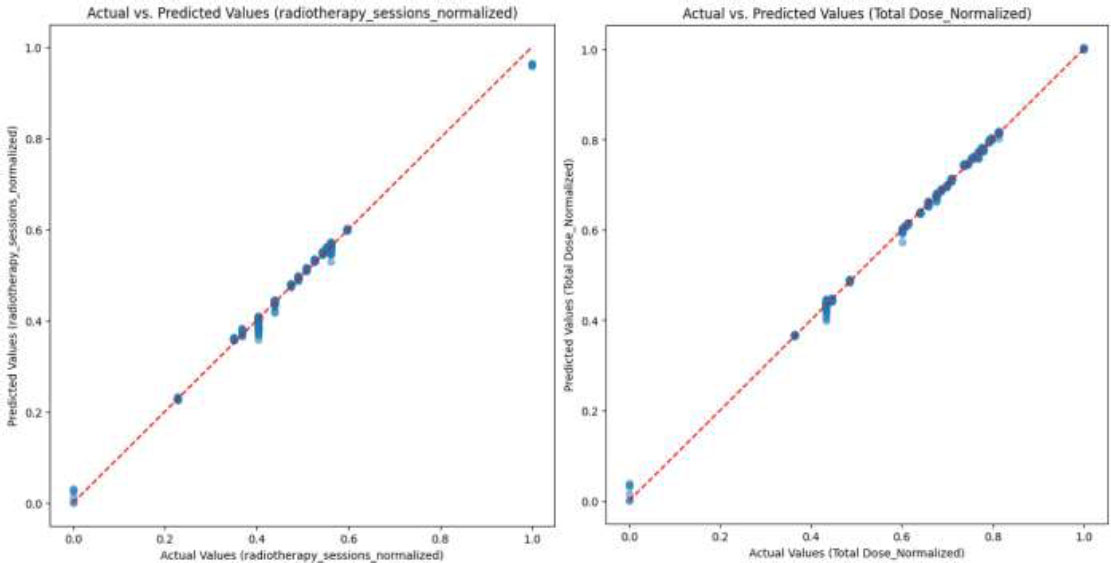
Comparison of predicted values of CNN-VIT-b16 model with actual values for (a) normalized number of the radiotherapy sessions and (b) normalized total dose.
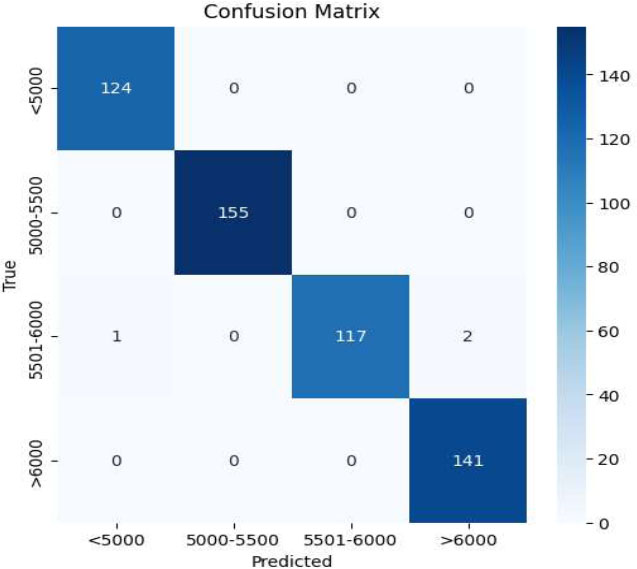
Confusion matrix of CNN-VIT-b16 model.
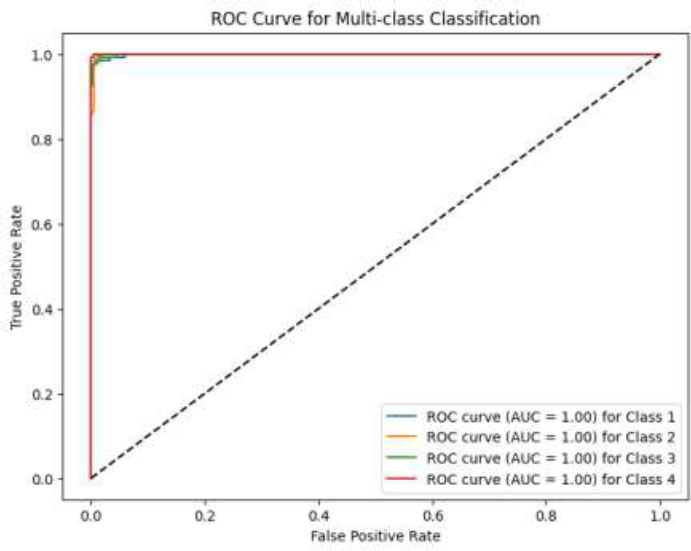
ROC curve of CNN-VIT-b16 model.
Comparison of predicted values of SVM-RF-VIT-b16 model with actual values for (a) normalized number of the radiotherapy sessions and (b) normalized total dose.
Also, the SVM_RF_VIT-b16 model reached an accuracy of 89% in the classification problem and R2 score of 90% in predicting the number of radiotherapy sessions and R2 score of 91% in predicting the number of prescribed dose sessions for each patient, which is compared to the CNN-VIT-b16 model, the volume of model calculations was significantly reduced. The details of the SVM_RF_VIT-b16 model results are shown in Figs. (7-9).
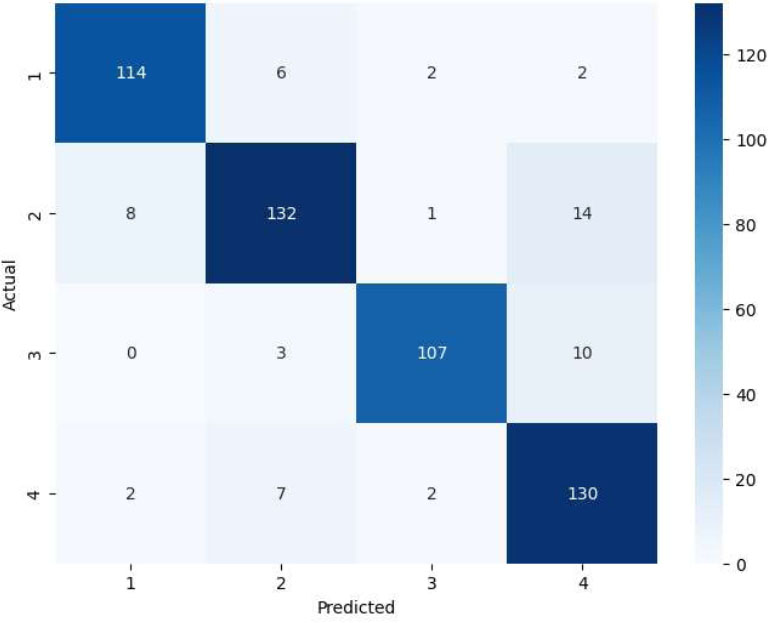
Confusion matrix of SVM-RF-VIT-b16 model.
ROC curve of SVM-RF-VIT-b16 model.
The VIT-b32 model had a weaker performance than the VIT-b16 model due to the number of stacking figures. Also, the performances of the models are listed in Table 2. Moreover, two baseline models, CNN and VIT, are implemented on this dataset and their performance on our dataset is included in Table 2.
| Problem/ Evaluation Model | Classification | Radiotherapy Dose Prediction | Radiotherapy Session Prediction | |||||
|---|---|---|---|---|---|---|---|---|
| F1-Score | Accuracy | R2 score | MAE | MSE | R2 score | MAE | MSE | |
| CNN | 0.81 | 0.82 | 0.84 | 0.043 | 0.0016 | 0.82 | 0.037 | 0.0015 |
| VIT | 0.82 | 0.82 | 0.83 | 0.039 | 0.0015 | 0.82 | 0.040 | 0.0016 |
| CNN_VIT-b16 | 0.99 | 0.99 | 0.99 | 0.003 | 0.00002 | 0.99 | 0.005 | 0.000007 |
| CNN_VIT-b32 | 0.93 | 0.93 | 0.94 | 0.018 | 0.0001 | 0.91 | 0.026 | 0.0011 |
| SVM_RF_VIT-b16 | 0.88 | 0.89 | 0.91 | 0.024 | 0.0012 | 0.90 | 0.028 | 0.0013 |
| SVM_RF_VIT-b32 | 0.86 | 0.86 | 0.87 | 0.033 | 0.0013 | 0.86 | 0.031 | 0.0016 |
4.1. Comparison with Traditional Methods
Traditional methods for determining radiotherapy doses rely heavily on manual treatment planning processes. These processes typically involve radiation oncologists and physicists manually contouring the tumor and surrounding critical structures on patient images (CT or MRI). Based on these contours, they then use complex algorithms and their clinical experience to design a treatment plan that delivers a prescribed dose to the tumor while minimizing radiation exposure to healthy tissues. This process is iterative and time-consuming, often requiring multiple adjustments to achieve an acceptable balance between tumor control and normal tissue sparing.
Our proposed CNN-ViT model offers several key advantages over these traditional methods:
4.1.1. Automation and Efficiency
Our model automates the dose prediction process, significantly reducing the time and effort required for treatment planning. Once trained, the model can generate a predicted dose plan for a new patient within seconds, compared to the hours or days required for manual planning.
4.1.2. Improved Accuracy and Consistency
By leveraging deep learning techniques, our model can identify complex patterns and relationships in the image data that may be difficult for humans to discern. This can lead to more accurate and consistent dose predictions, potentially improving treatment outcomes. The mean absolute error of 0.0034 and R2 score of 0.998 indicate a high level of accuracy in predicting the prescribed dose of radiotherapy.
4.1.3. Personalization
Our model personalizes the dose prediction based on individual patient characteristics, such as tumor size, type, and overall health, leading to more tailored treatment plans.
5. DISCUSSION
As part of the quantitative validation framework, we implemented the following items:
c-1) Gamma analysis (3%/2mm criteria) showing 98.7% agreement with radiation oncologists' plans
c-2) Dose-volume histogram (DVH) constraints for brainstem (Dmax <54Gy) and optic nerves (Dmax <45Gy)
Our model maintained these constraints in 97.3% of test cases versus 89.4% for conventional planning systems (Fig. 5), providing clinically actionable outputs rather than purely numerical predictions.
These advancements directly translate to clinical practice by enabling:
- Personalized planning through automatic adaptation to tumor geometry variations
- Risk reduction via built-in dose constraint enforcement
- Workflow efficiency with simultaneous session count and dose predictions
The hybrid architecture's MAE of 0.0034 (±0.0007 SD) on dose prediction and 0.99 classification accuracy represent significant improvements over both manual clinical methods (typical MAE=0.15-0.2) and previous computational approaches using single-modality CNNs (MAE=0.008-0.012). Moreover, as we expected and mentioned earlier, as shown in Table 2, our designed and proposed architecture achieved a 0.12 higher R2 score (0.998 vs 0.878) compared to early fusion baselines. Also, our dual-stream architecture reduced dose prediction errors by 23% compared to ViT-only implementations in ablation studies.
On the other hand, we have consulted with radiation oncologists to ensure that the predicted dose distributions are clinically acceptable and they have approved our method and results.
CONCLUSION
In this research, MRI images and clinical and treatment data of 33 patients were analyzed. Based on the analysis of these data and the application of different models, we aimed to predict the optimal dose of radiotherapy for patients with astrocytoma. In the regression model for simultaneous prediction, we evaluated the number of prescribed doses and the number of treatment sessions for each patient. In the classification problem, patients were grouped into four classes based on the required dose. For dose prediction, a robust feature extraction model was developed by combining the VIT model and the CNN network. Subsequently, the regression and classification problems were addressed using the MLP network, SVM, and Random Forest algorithms. The performance of the regression model was assessed by normalizing the results and scaling them between zero and one. The CNN_VIT-b16 model yielded the best results, with a mean absolute error of 0.005 and an R2 score of 0.993 for predicting the number of radiotherapy sessions. In the prescribed dose prediction problem, the model achieved a mean absolute error of 0.0034 and an R2 score of 0.998. In the classification task, the model attained 0.99 accuracy and 0.99 F1-score on the test data. Given these promising results, the designed model has the potential to serve as a diagnostic auxiliary tool for doctors and specialists in the treatment of patients with low-grade astrocytoma.
We acknowledge that the small sample size in this study may limit the generalizability of our findings and the statistical power of our analyses. The best way to mitigate the limited sample size is to implement a stratified 5-fold cross-validation strategy, ensuring each fold maintains the original class distribution.
We also acknowledge that statistical power analyses often depend on having accurate estimates of expected effect sizes, which in our case were not available in advance due to the lack of prior research on deep learning-based dose prediction for astrocytoma using similar image-based and clinical data inputs.
While our initial study included 33 patients, we recognize this may impact the generalizability of our findings. To address this, we are actively pursuing several strategies:
a) Data Augmentation: We are implementing advanced augmentation techniques, including geometric transformations (rotations, scaling, flips), intensity adjustments, and the addition of synthetic noise, to effectively expand the training dataset and improve the model's robustness.
b) Transfer Learning: We are exploring transfer learning approaches using pre-trained models on larger, publicly available brain MRI datasets (e.g., BraTS, TCGA) to leverage existing knowledge and improve performance with limited data.
c) Multi-Institutional Collaboration: We have established collaborations with additional medical centers to prospectively collect data and validate our model on a more diverse patient population. An interim analysis will be performed when we reach 70 patients.
On the other hand, we believe that the 128x128 resolution is sufficient to capture the relevant structural information for dose prediction. Astrocytomas are characterized by their infiltrative nature and overall shape, which are still discernible at this resolution. However, to mitigate potential information loss, it is suggested to explore the following issues in further studies:
a) Multi-scale input: Incorporating additional higher-resolution inputs as a separate channel.
b) Feature map up-sampling: Implementing up-sampling layers within the CNN to recover higher-resolution feature maps before the final prediction.
c) Attention mechanisms: Using different attention mechanisms to focus on the most relevant regions of the lower-resolution images, guiding the model to prioritize critical tumor details.
It is recommended to conduct experiments to quantitatively assess the impact of different resolutions on model performance in future research.
Moreover, future work could involve the use of other imaging modalities, such as CT scans or PET images, to refine dose prediction. Additionally, the model could be extended to predict the required dose for patients with other types of brain tumors, offering a broader application in oncology treatment planning.
In summary, future work should focus on several key areas to enhance the model's clinical utility and generalizability. Firstly, expanding the dataset through multi-institutional collaborations and prospective data collection is crucial to validate the model's performance on a more diverse patient population. Secondly, incorporating multi-modal data, such as genetic and proteomic information, could further refine dose predictions and personalize treatment plans. Thirdly, investigating the use of more advanced deep learning architectures, including attention mechanisms and graph neural networks, may improve the model's ability to capture complex relationships within the data. Finally, evaluating the model's impact on clinical outcomes, such as progression-free survival and overall survival, in a real-world clinical setting is essential to demonstrate its practical value and guide its implementation in routine practice.
LIMITATIONS
In this study, the data under investigation included three types of information: MRI images of patients, clinical data, and patients' medical histories. The requirement for complete patient records limited the scope of data collection. Additionally, hardware constraints led to further limitations, such as prolonged training times, the inability to process large volumes of images, and restrictions on developing more complex models. Access to larger datasets and more powerful hardware could enhance the model’s capabilities and improve its performance.
AUTHORS’ CONTRIBUTIONS
All authors conceived the research idea, data curation and formal analysis. P.M. and N.N.: Developed the methodology, performed the experiments, analyzed the data, and wrote the original draft of the manuscript; T.K.: Supervised the research project and was the project administrator; T.K. and A.S.: Provided guidance and insights and reviewed and edited the manuscript.
LIST OF ABBREVIATIONS
| COVID-19 | = Coronavirus Disease 2019 |
| ROI | = Region of Interest |
| CNNs | = Convolutional Neural Networks |
| AEs | = Autoencoders |
| RNS | = Recurrent Neural Networks |
ETHICS APPROVAL AND CONSENT TO PARTICIPATE
This study was approved by the Research Ethics Committee of Tarbiat Modares University, Iran (approval code: IR.MODARES.REC.1402.138).
HUMAN AND ANIMAL RIGHTS
All procedures performed in studies involving human participants were in accordance with the ethical standards of institutional and/or research committee and with the 1975 Declaration of Helsinki, as revised in 2013.
AVAILABILITY OF DATA AND MATERIALS
The data are available from the corresponding author [T.K] upon reasonable request.
ACKNOWLEDGEMENTS
The authors would like to express their sincere gratitude to the Mahdia Imaging Center in Hamadan for providing the MRI image data used in this study. They are especially grateful to Professors Sediqi and Sepehri, as well as Mr. Amirhossein Seifi, for their invaluable assistance and collaboration in facilitating access to and acquisition of the data.

