All published articles of this journal are available on ScienceDirect.

Comparative Analysis of Computational Models for CBV-based Detection of Ischemic Stroke in DSC-MRI: Influence of Signal-to-Noise Ratio and Tissue Type
Abstract
Introduction
Ischemic stroke remains a leading cause of disability and mortality, making a rapid and reliable diagnosis essential. Dynamic Susceptibility Contrast Magnetic Resonance Imaging (DSC-MRI) is widely used to assess cerebral perfusion, yet its diagnostic accuracy strongly depends on the computational model applied. This study investigates how model selection influences the reliability of CBV-based ischemic stroke detection under varying noise conditions and tissue types.
Methods
Simulated tissue signal curves were generated from clinical reference data and modified to reflect ischemic alterations across multiple noise levels. Cerebral Blood Volume (CBV) was estimated using two established approaches: the modified gamma variate function and a compartmental (triple-exponential) model. Diagnostic performance was evaluated by comparing the accuracy and robustness of CBV estimation.
Results
The compartmental model consistently outperformed the gamma variate function, providing more accurate and stable CBV estimates, particularly under high-noise conditions. In contrast, the gamma variate function demonstrated reduced robustness and greater sensitivity to noise.
Discussion
These findings underscore the importance of computational model selection in DSC-MRI analysis. The performance of the compartmental model suggests its potential for integration into clinical workflows, particularly in acute stroke care, where reliability under challenging conditions is crucial. However, this study has several limitations. Most importantly, the analysis was based on simulated tissue signal curves derived from clinical reference data rather than on in vivo measurements, which may not fully capture the complexity of real patient physiology.
Conclusion
Computational modeling influences the diagnostic value of DSC-MRI in ischemic stroke assessment. The compartmental model offers greater robustness and accuracy, supporting its use in diagnostic systems.
1. INTRODUCTION
Dynamic Susceptibility Contrast Magnetic Resonance Imaging (DSC-MRI) is among the most advanced techniques currently used in brain diagnostics [1, 2]. It enables visualization of cerebral perfusion, i.e., the blood supply and flow through brain tissue. Since perfusion is typically disrupted in pathological areas, DSC-MRI supports early detection and localization of regions at risk for various neurological conditions, including tumours, ischemic stroke, epilepsy, migraines, dementia, and Moyamoya disease [3-7].
Among these conditions, ischemic stroke stands out as one of the most common and well-documented cerebro-vascular events, with major public health implications. Stroke is the fifth leading cause of death and a major cause of long-term disability in the United States, affecting nearly 800,000 people annually [8-10]. DSC-MRI has proven to be a powerful tool for identifying ischemic tissue, predicting outcomes, and differentiating between reversible and irreversible damage [11-13]. These capabilities make ischemic stroke an ideal focus for perfusion-based diagnostic research.
During a DSC-MRI scan, a time series of MR images is acquired following the intravenous injection of a para-magnetic contrast agent [1, 14]. As the tracer circulates through the cerebral vasculature, it induces detectable signal intensity changes, which are recorded over time to produce concentration-time curves for each pixel in the brain slice (Fig. 1 illustrates the tracer’s pathway during a DSC-MRI brain scan). These curves form the basis for calculating quantitative perfusion metrics such as Cerebral Blood Volume (CBV), Cerebral Blood Flow (CBF), and Mean Transit Time (MTT) [14-16].
The most widely used perfusion parameters include Cerebral Blood Volume (CBV), Cerebral Blood Flow (CBF), and Mean Transit Time (MTT). These parameters are typically visualized as parametric maps, displaying their spatial distribution across the brain, thereby supporting clinical interpretation [17, 18].
Several computational approaches exist for estimating these parameters. Non-parametric methods, such as regression-based curve fitting, make minimal assumptions, whereas parametric models incorporate physiological constraints, offering interpretable and biologically grounded estimates [19-22]. However, comparing their diagnostic performance remains challenging due to the limited availability of standardized clinical datasets [23, 24]. Consequently, many studies rely on simulated tracer concentration curves, which may introduce bias in favor of methods that employ similar functions during estimation [25, 26].
Recent work, including reviews, has highlighted several unresolved challenges in perfusion imaging: the absence of standardized validation datasets, limited robustness of models under varying noise conditions, and a lack of systematic comparisons between parametric and non-parametric approaches [27-31]. These knowledge gaps highlight the need for clinically grounded, noise-aware evaluation frameworks, particularly in stroke diagnostics, where reliability is crucial.
Recent advances in Artificial Intelligence (AI), particularly deep learning, have significantly enhanced the capabilities of medical image analysis. In the context of brain diagnostics and broader radiological applications, AI-driven methods have shown promise in tasks such as segmentation, classification, and outcome prediction. Recent studies have demonstrated the effectiveness of deep learning-integrated MRI brain tumor analysis for feature extraction, segmentation, and survival prediction using replicator and volumetric networks [32], as well as the detection of Omicron-induced pneumonia from radiology images using convolutional neural networks [33]. Similarly, hybrid approaches, such as FrCN-(U-Net), combined with machine learning, have been successfully applied to skin cancer segmentation and classification [34]. Further developments include the use of deep learning and MRI biomarkers for precise detection and diagnosis of lung cancer cells [35], as well as the automated identification of acute cerebral ischemic stroke lesions from diffusion-weighted MRI scans using capsule graph neural networks [36].
Schematic representation of the tracer's pathway during a DSC-MRI brain scan, from the injection site to the region of interest.
These contributions highlight the increasing importance of AI in medical imaging and encourage further investigation of computational approaches in perfusion analysis.
However, while AI-based methods have demonstrated impressive capabilities across various domains of medical imaging, their application in perfusion analysis, particularly in the context of ischemic stroke, remains limited by several practical constraints. One of the most critical challenges is the availability of large, high-quality annotated datasets, which are essential for training robust deep learning models [37, 38]. This problem is also indicated, for instance, in studies concerning the use of AI in prediction for acute ischemic stroke [30]. In clinical practice, such datasets are often scarce due to privacy concerns, variability in imaging protocols, and the complexity of manual annotation [39-41]. Moreover, AI models can struggle with generalizability across different patient populations and imaging conditions, which is particularly problematic in high-stakes diagnostic scenarios. These limitations highlight the continued relevance of physiologically grounded and interpretable computational approaches that do not rely on extensive training data.
This study addresses these gaps by comparing two representative methods for CBV estimation: the Gamma Variate Function (GVF), a widely used regression-based model, and a compartmental model representing a physiologically motivated approach [3, 21, 22, 42]. Unlike previous work relying on synthetic or literature-calibrated curves, our analysis uses real clinical DSC-MRI data and systematically evaluates the impact of noise and tissue variability on model performance. The findings aim to guide the selection of robust computational strategies for improving the reliability of DSC-MRI in ischemic stroke diagnostics.
The novelty of this work lies not in proposing entirely new mathematical models, but in systematically assessing how methodological choice and tissue specificity affect diagnostic reliability in CBV estimation. By analyzing the behaviour of GVF and compartmental modelling under controlled noise conditions and across distinct tissue types, this study addresses a previously unexplored dimension of perfusion analysis. Such insights are essential for guiding the selection of computational strategies that can enhance the clinical utility of DSC-MRI in ischemic stroke.
2. MATERIALS AND METHODS
2.1. DSC-MRI Data
The primary research material consisted of model tracer concentration curves characteristic of grey and white matter, as shown in Fig. (2). These curves were generated using a proprietary methodology developed by the author [43], directly grounded in real clinical DSC-MRI scans. Although the curves are simulated, their derivation from actual patient data ensures that they realistically reflect physiological and pathological perfusion dynamics, including signal variations across tissue types. This guarantees that the model was tested on data reflecting real-world imaging conditions and tissue characteristics.
Tracer concentration curves representative of white and grey brain matter.
The methodology, described in detail in a previous study [43], involves extracting signal intensity curves from DSC-MRI scans of different brain regions, specifically grey matter, white matter, and cerebral vasculature, and converting them into tracer concentration curves using standard DSC-MRI signal conversion formulas [1, 2, 14, 15, 19, 21, 22]. These curves were then described using perfusion-related feature vectors. Based on the relationships between these descriptors, characteristic for each tissue type [20], the signals were classified into three categories using unsupervised clustering. Within each category, the signals were averaged to generate representative concentration-time curves for grey matter, white matter, and vascular regions.
To prepare the dataset for analysis, the curves corresponding to grey and white matter were each divided into three equal subsets of 1,000 curves, resulting in a total of 6,000 curves. Each subset was then augmented by adding white Gaussian noise at three different signal-to-noise ratios (SNR): 15 dB, 20 dB, and 25 dB. Among these, the 20 dB SNR level is commonly used in DSC-MRI simulation studies [20, 44, 45], as it approximates the noise level observed in clinical data [46-48].
An identical procedure was followed to generate a second dataset of equal size, this time reflecting signal alterations associated with ischemic stroke. These modifications were based on pathological perfusion changes reported by Grandin et al. [11]. In total, the dataset comprised 12,000 curves: 6,000 for normal tissue and 6,000 for ischemic tissue.
As previously noted, ischemic stroke was selected for this study due to its significant public health impact and the extensive literature documenting its imaging characteristics. This ensures the relevance and robustness of the generated dataset for evaluating the diagnostic performance of different perfusion analysis methods.
2.2. Calculation of Cerebral Blood Volume
Cerebral Blood Volume (CBV) is defined by the following Eq. (1) [1, 4, 19]:
where cROI(t) denotes the tracer concentration curve within the region of interest (ROI), and cAIF represents the Arterial Input Function (AIF), which is common to all curves analysed.
The analysis of tracer concentration curves is based on fitting the measurement data to a regression function whose shape reflects the expected concentration profile of the tracer in tissue. A commonly used model for this purpose is the modified gamma variate function, defined as follows (2) [3, 42, 49]:
where α, β, χ i are regression parameters, and c0 denotes the baseline signal level.
In contrast, the compartmental modelling approach to tracer distribution in DSC-MRI employs a regression function with a triple exponential form (3) [6, 21, 22]:

where p1 through p6 are macroparameters defining the shape of the regression function.
For each concentration curve generated using these two modelling strategies, namely, the modified gamma variate function (Eq. 2) and the triple exponential function (Eq. 3), the CBV was calculated according to Eq. (1).
The CBV values obtained from the first dataset, which consisted of curves representing healthy brain tissue, were compared against reference values derived from undisturbed (noise-free) curves to evaluate the consistency and accuracy of each method under ideal conditions.
Both functions being compared were fitted using nonlinear least squares optimization. Specifically, the Levenberg–Marquardt algorithm was employed for parameter estimation in both cases due to its efficiency in handling ill-conditioned problems and its widespread use in biomedical curve fitting [50, 51]. Initial parameter values were selected based on physiological plausibility and prior empirical observations from clinical DSC-MRI data.
2.3. Detection of Ischemic Stroke
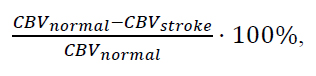
The observed changes in Cerebral Blood Volume (CBV) were evaluated against threshold values for percentage CBV reduction commonly used in the diagnosis of ischemic stroke in both white and grey matter. This comparison enabled the assessment of each method’s susceptibility to False Positives (FP) - the incorrect identification of ischemia in healthy tissue, and False Negatives (FN) - the failure to detect ischemia in affected regions.
The threshold values, calculated using Eq. (4) and applied in this analysis, are presented in Table 1.
| Tissue Type | CBV Decrease Threshold |
|---|---|
| Grey matter | 23.3% |
| White matter | 41.2% |
These threshold values were adopted from the study by Arakawa et al. [52], which analysed 21 patients diagnosed with ischemic stroke. Importantly, this study distinguishes between white and grey matter perfusion thresholds, an uncommon yet critical detail that enhances the reliability of its use as a reference in this work. Thresholds from Table 1 were applied to CBV estimates obtained from both models to classify tissue as normal or ischemic.
2.4. Assessment Criteria for CBV Estimation Methods
The values obtained from the second dataset, which contained pathological (stroke-affected) curves, were compared against reference values derived from healthy tissue (i.e., calculated from the unaltered and noise-free curves).
For each dataset, the number of FP and FN cases was determined across all three noise levels (SNR = 15, 20, and 25 dB), for both tissue types (grey and white matter), and for both estimation methods (i.e., gamma variate function and compartmental model).
The obtained results were then used to compute five key biostatistical performance metrics, including:
• sensitivity,
• specificity,
• accuracy,
• false negative rate,
• false positive rate.
Sensitivity measures the test’s ability to correctly identify true positive cases, indicating how effectively the method detects actual abnormalities; high sensitivity minimizes the risk of missing true cases. Specificity, on the other hand, reflects the ability to correctly identify true negatives, ensuring that healthy or unaffected cases are not mistakenly classified as positive, thus reducing unnecessary interventions. Accuracy represents the overall proportion of correctly classified cases, combining both true positives and true negatives, and provides a general measure of the method’s reliability.
False negative rate quantifies the proportion of actual positive cases that are incorrectly classified as negative, and a low FNR is particularly important in clinical contexts where missing a diagnosis could have serious consequences. Conversely, the false positive rate indicates the proportion of actual negative cases that are incorrectly identified as positive, which can lead to overdiagnosis and potentially unnecessary treatment.
Together, these metrics provide a comprehensive view of the diagnostic method’s strengths and limitations, particularly under varying levels of noise in the data. As standard tools for evaluating the reliability and quality of diagnostic procedures, they were employed to compare the effectiveness of the two cerebral blood volume estimation methods analysed in this study.
It should be noted that no cross-validation procedure was applied in this study. The dataset was entirely simulated based on clinically validated reference curves and designed to reflect specific ischemic alterations under controlled conditions. The aim was not to train or validate a predictive model, but rather to perform a comparative analysis of CBV estimation techniques. Since the signal curves were generated deterministically and structured to represent predefined physiological scenarios, traditional cross-validation would not yield meaningful insights into generalization performance. Instead, the evaluation focused on systematic variation across noise levels, tissue types, and model configurations, which better serves the purpose of methodological comparison.
3. RESULTS
The results obtained, expressed as values of standard biostatistical metrics, are presented in Tables 2-4, corresponding to signal-to-noise ratios (SNR) of 15 dB, 20 dB, and 25 dB, respectively. These tables summarize the diagnostic performance of the two computational approaches, namely the triple exponential regression function (fregr3exp) and the modified gamma variate function (fregrGV), in detecting ischemic stroke based on cerebral blood volume, under varying levels of noise.
To facilitate a more intuitive comparison of diagnostic performance across different noise levels and tissue types, heatmaps were generated based on the biostatistical metrics used. They are shown in Fig. (3a-c). These visualizations provide a color-coded representation of the results, enabling the quick identification of performance trends and discrepancies between the two approaches used.
4. DISCUSSION
As expected, at a low noise level (SNR = 25 dB), both computational methods demonstrate excellent diagnostic performance, with sensitivity and specificity values approaching or reaching 100% (Table 2). False Positive Rates (FPR) are nearly negligible, ranging from 0.00% to 0.16%, and False Negative Rates (FNR) remain below 0.17%. However, such high SNR levels are rarely achieved in clinical practice. In real-world DSC-MRI brain imaging, noise levels are generally higher due to various physiological and technical factors [53-55].
| Metric | Grey Matter (GM) | White Matter (WM) | GM + WM | |||
|---|---|---|---|---|---|---|
| fregr3exp | fregrGV | fregr3exp | fregrGV | fregr3exp | fregrGV | |
| Sensitivity | 99.83% | 100.00% | 100.00% | 99,80% | 99,92% | 99.90% |
| Specificity | 100.00% | 99.84% | 100.00% | 100.00% | 100.00% | 99.92% |
| Accuracy | 100.00% | 99.92% | 100.00% | 99,50% | 100.00% | 99.71% |
| False positive rate | 0.00% | 0.16% | 0.00% | 0.00% | 0.00% | 0.08% |
| False negative rate | 0.17% | 0.00% | 0.00% | 0.00% | 0.09% | 0.10% |
| Metric | Grey Matter (GM) | White Matter (WM) | GM + WM | |||
|---|---|---|---|---|---|---|
| fregr3exp | fregrGV | fregr3exp | fregrGV | fregr3exp | fregrGV | |
| Sensitivity | 98.84% | 99.40% | 99.46% | 98.64% | 99.15% | 99.02% |
| Specificity | 99.99% | 98.36% | 99.82% | 100.00% | 99.91% | 99.18% |
| Accuracy | 99.91% | 99.18% | 99.91% | 99.50% | 99.91% | 99.34% |
| False positive rate | 0.01% | 1.64% | 0.18% | 0.00% | 0.10% | 0.82% |
| False negative rate | 1.16% | 0.60% | 0.54% | 1.36% | 0.85% | 0.98% |
| Metric | Grey Matter (GM) | White Matter (WM) | GM + WM | |||
|---|---|---|---|---|---|---|
| fregr3exp | fregrGV | fregr3exp | fregrGV | fregr3exp | fregrGV | |
| Sensitivity | 92.02% | 92.09% | 97.40% | 94.70% | 94.71% | 93.40% |
| Specificity | 99.99% | 97.41% | 99.04% | 99.59% | 99.52% | 98.50% |
| Accuracy | 99.52% | 98.50% | 99.52% | 99.30% | 99.52% | 98.90% |
| False positive rate | 0.01% | 2.59% | 0.96% | 0.41% | 0.49% | 1.50% |
| False negative rate | 7.98% | 7.91% | 2.60% | 5.30% | 5.29% | 6.61% |
At a moderate noise level (SNR = 20 dB), diagnostic performance slightly decreases (Table 3). Sensitivity averages 99.15% for the triple exponential approach and 99.02% for the gamma variate method, with corresponding specificity values of 99.91% and 99.18%, respectively. The differences between the two models become more apparent, especially when considering the tissue type. For instance, the gamma variate model produces a false positive rate of 1.64% in grey matter, compared to 0.00% in white matter. Both methods exhibit non-zero false negative rates, which also vary by tissue type: the triple exponential model yields more false negatives in grey matter (1.16%), while the gamma variate model performs worse in white matter (1.36%). These differences highlight the interplay between the modelling approach, tissue characteristics, and image noise.
At the highest noise level tested (SNR = 15 dB), representative of more realistic clinical scenarios, the decline in diagnostic accuracy is more pronounced (Table 4). Sensitivity drops to 92.0% in grey matter and 94.7% in white matter, while specificity declines due to increased false positives, particularly for the gamma variate method in grey matter (2.59%). False negative rates rise to nearly 8% for both models, highlighting the challenge of stroke detection under noisy conditions. Nevertheless, the compartmental model (triple exponential regression) consistently outperforms the gamma variate approach across all metrics and tissue types.
The heatmaps presented in Fig. (3) complement these tabulated results by visually summarizing diagnostic performance across different SNRs, tissues, and modelling strategies. GM is more susceptible to noise-related performance degradation than WM, and the triple exponential model offers improved robustness, particularly when metrics are aggregated across both tissue types. These findings reinforce the advantage of compartmental modelling under realistic, noise-prone conditions typical of clinical DSC-MRI. They also highlight the importance of tissue-specific analysis when interpreting perfusion metrics, as grey and white matter exhibit different susceptibility to noise-induced performance degradation.
Overall, the obtained results suggest that compartmental modelling with tri-exponential regression provides superior robustness and stability under clinically realistic noise conditions, highlighting its potential utility for automated DSC-MRI pipelines and decision-support systems. At the same time, the gamma variate function remains computationally simpler and faster, making it potentially suitable for real-time or resource-limited applications. The findings emphasize the importance of tissue-specific modelling, robust computational strategies, and clinically realistic evaluation conditions in improving the reliability of perfusion-based stroke diagnostics.
In addition to diagnostic performance, it is worth noting the differences in computational complexity between the two approaches. The modified gamma variate function is relatively simple and computationally efficient, involving fewer parameters and faster curve fitting. In contrast, the compartmental (triple exponential) model requires the estimation of multiple exponential components, which increases the computational burden and sensitivity to initial conditions. While the compartmental model consistently demonstrated superior robustness and accuracy, its higher complexity may pose challenges in real-time or resource-constrained clinical environments. This trade-off between performance and computational cost should be considered when selecting a modelling strategy for practical implementation.
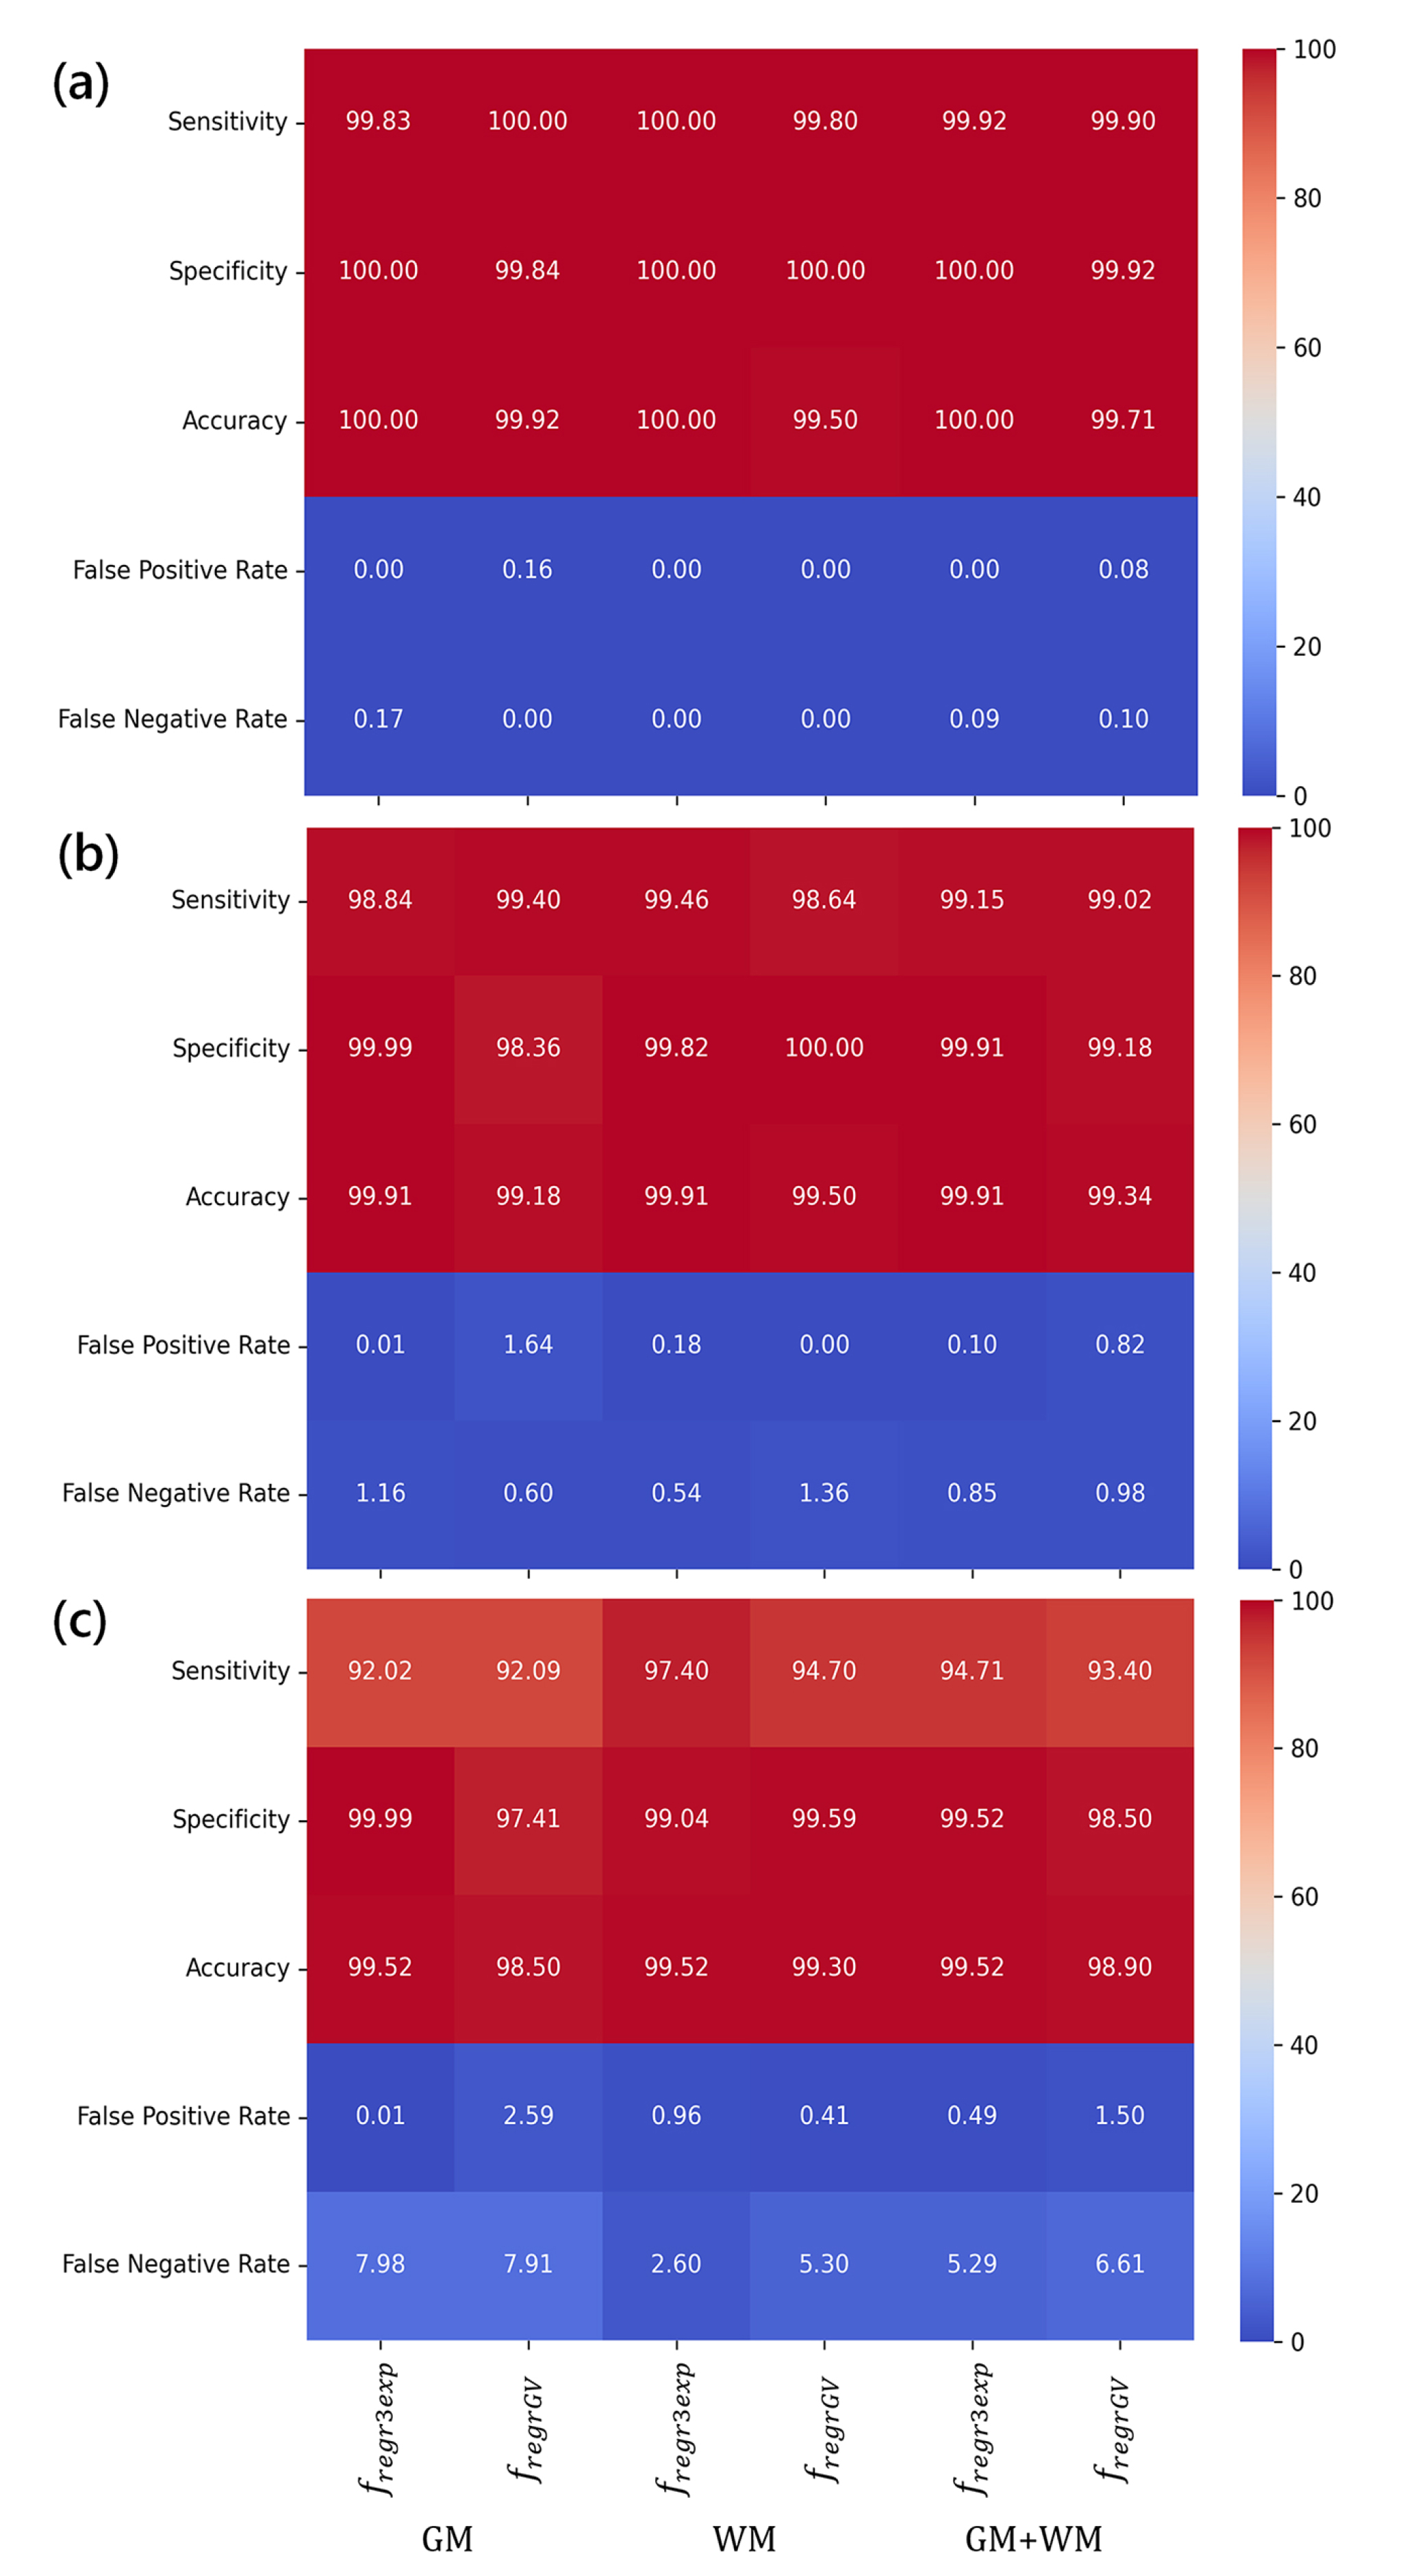
Heatmaps illustrating the diagnostic performance of the two approaches used across three SNR levels, i.e., 25 dB (a), 20 dB (b), and 15 dB (c).
Additionally, it is essential to address challenges related to data complexity and patient privacy, particularly when extending perfusion analysis to multi-institutional clinical datasets. Recent studies have emphasized the importance of privacy-preserving and decentralized frameworks in various domains of data processing, including medical image analysis [56-58]. Incorporating such strategies into future DSC-MRI research could facilitate robust, reproducible, and secure analyses across diverse clinical sites, while mitigating risks to patient confidentiality and accommo-dating variability in imaging protocols.
4.1. Study Limitations and Future Directions of Research
This study provides a focused methodological comparison of two widely used DSC-MRI computational models for CBV estimation. While the results are promising, several limitations must be acknowledged, each suggesting specific directions for future research, particularly in heterogeneous stroke presentations and multi-institutional settings.
4.1.1. Reliance on Simulated Datasets
The study is based on simulated tracer concentration curves derived from real clinical DSC-MRI signal patterns, ensuring that the generated curves realistically reflect physiological and pathological perfusion dynamics. Although this approach allows controlled benchmarking and precise manipulation of noise levels, it cannot fully capture the heterogeneity of stroke presentations, such as varying lesion severity, infarct location, or time-to-imaging delays. Scanner-specific differences and contrast agent protocols are also not represented. Furthermore, in the context of DSC-MRI, it is inherently difficult to define a definitive ground truth, as the measurements are image-based and reflect indirect perfusion effects rather than absolute physiological values.
Implication for future research: Validate the proposed models using large, multi-center clinical datasets that encompass diverse patient populations, variable stroke types and severities, differing acquisition parameters, and heterogeneous contrast administration protocols to ensure generalizability and robustness across clinical scenarios.
4.1.2. Limited Baseline Comparisons
The current analysis does not include systematic bench-marking against recent state-of-the-art DSC-MRI analysis methods, such as SVD-based deconvolution, Bayesian inference techniques, or Machine Learning (ML)–based approaches, which may behave differently under varying noise levels, tissue types, and acquisition settings.
Implication for future research: Comparative studies should evaluate the relative performance of compartmental versus non-parametric models under realistic clinical conditions, including advanced deconvolution and auto-mated machine learning ML) frameworks. Analyses should incorporate multiple datasets from different scanners and institutions to account for protocol variability and patient heterogeneity.
4.1.3. Tissue-specific Analysis Limited to GM and WM
Only grey and white matter were analyzed, without consideration of regional heterogeneity, small lesions, or pathology-specific variations that can arise from different stroke subtypes or multi-territorial infarcts.
Implication for future research: Include additional tissue types, vascular territories, and pathology-specific scenarios to improve diagnostic precision and robustness in complex stroke presentations.
4.1.4. CBV Threshold Selection
The thresholds used in this study were derived from prior literature without systematic validation or sensitivity analysis across different patient populations, tissue types, or acquisition protocols.
Implication for future research: Implement ROC curve–based optimization of CBV thresholds and conduct sensitivity analyses to evaluate the robustness of diagnostic performance under varying thresholds, tissue characteristics, and imaging parameters.
4.1.5. Noise Modeling and Artifacts
Simulations incorporated Gaussian noise, consistent with approaches widely used in the literature, with levels chosen to match clinically realistic SNR ranges. However, other noise types (e.g., Rician noise), motion artifacts, and partial volume effects were not systematically analyzed.
Implication for future research: Evaluate multiple noise models and artifact severities to test the sensitivity of both computational methods to realistic imaging conditions, improving the translational relevance of the findings.
4.1.6. Lack of Definitive Clinical Ground Truth
While the simulated datasets are grounded in real patient data, they do not provide absolute outcome verification. This limitation is intrinsic to DSC-MRI, which is an imaging-based, indirect measurement of cerebral perfusion rather than a direct physiological measurement. As a result, performance across heterogeneous stroke populations, variable severity levels, timing, and imaging protocols can only be inferred rather than directly validated.
Implication for future research: Incorporate validation against longitudinal clinical outcomes, follow-up imaging, and multi-institutional patient datasets to better approximate real-world reliability and applicability.
CONCLUSION
This study demonstrates that the diagnostic reliability of ischemic stroke assessment using DSC-MRI strongly depends on the computational model applied for CBV estimation. The compartmental model with tri-exponential regression consistently outperformed the modified gamma variate function, particularly under clinically realistic noise conditions. However, the gamma variate approach remains computationally simpler and may be suitable for time-critical or resource-limited settings.
A key finding is that diagnostic performance varies between grey and white matter, underscoring the need for tissue-specific analysis in perfusion-based stroke diagnostics. Neglecting this differentiation may lead to biased conclusions and suboptimal treatment planning, especially in acute interventions such as thrombolysis or thrombectomy [36, 59].
Main contributions and practical implications:
1. Systematic model comparison – evaluation of two widely used CBV estimation methods under varying noise levels and tissue types;
2. Tissue-specific insights – evidence that grey and white matter differ significantly in diagnostic reliability, highlighting the need for tissue-aware analysis;
3. Robustness under clinical conditions – confirmation that the compartmental model maintains higher accuracy and lower error rates in noisy scenarios;
4. Guidance for clinical workflows – recommendations on model selection to reduce false negatives and false positives in stroke detection;
5. Framework for future research – a benchmark for evaluating new computational or machine learning methods under realistic conditions.
Future work should validate these findings on large, multi-center clinical datasets, incorporate clinically realistic noise profiles, and explore hybrid approaches combining physiological modeling with AI-based noise correction. Such efforts will support the development of robust, automated DSC-MRI pipelines for real-time stroke assessment, ultimately improving patient outcomes and clinical decision-making.
AUTHOR’S CONTRIBUTIONS
The author confirms sole responsibility for the following: study conception and design, data collection, analysis and interpretation of results, and manuscript preparation.
LIST OF ABBREVIATIONS
| CBV | = Cerebral Blood Volume |
| DSC-MRI | = Dynamic Susceptibility Contrast -Magnetic Resonance Imaging |
| GM | = Grey Matter |
| SNR | = Signal-to-Noise Ratio |
| WM | = White Matter |
AVAILABILITY OF DATA AND MATERIALS
All the data and supporting information is provided within the article.
ACKNOWLEDGEMENTS
Declared none.

