All published articles of this journal are available on ScienceDirect.

The Impact of Socioeconomic Status on the Neural Substrates Associated with Pleasure
Authors Info & Affiliations
Abstract
Low socio-economic status (SES) is associated with increased morbidity and premature mortality. Because tonic adversity relates to a diminished ability to experience pleasure, we hypothesized that subjects living in poverty would show diminished neural responsivity to positive stimuli in regions associated with positive experience and reward. Visual images were presented to twenty-two subjects in the context of a EPI-BOLD fMRI paradigm. Significant differences in neural responses between SES groups to poverty vs. neutral images were assessed, examining group, condition, and interaction effects. The data suggest that persons living in low-SES have neural experiences consistent with diminished interest in things generally enjoyed and point toward a possible explanation for the relationship between socioeconomic inequalities and mood disorders, such as depression, by SES.
INTRODUCTION
The relationship between socio-economic status (SES) and health, the income gradient—the relative increase in mortality with lower income—accounts for a greater loss of health than any risk factor other than normal human aging [1]. While the 37 million Americans living below the poverty line are most affected, the income gradient extends throughout the entire population including those who have comfortable housing, access to health insurance, and who can readily afford a healthy diet [2]. Such findings have sparked a movement in health disparities research to look beyond material disadvantage and towards possible psychosocial factors.
While there is a considerable amount of descriptive evidence for how SES might “get under the skin,” [3] to date, no SES focused research has examined how SES-associated psychological stimuli or processes could be transduced into disrupted autonomic function. Theories regarding how SES might affect health through psychological pathways include stress-induced pathophysiology, negative emotional style, and mental illness [4]. One possibility is that diminished life satisfaction, such as that associated with living in poverty while repeatedly being exposed to more preferable conditions impacts psychosocial health [5,6]. In this scenario, individuals exposed to aversive environmental stimuli develop anxiety and apprehension thereby increasing the risk of mental illness such as depression [7]. Indeed, select data support this hypothesis. For example, in the child psychiatry literature a diverse range of adverse life circumstances, both acute and chronic, increase the risk for developing depression in adult life [8]. Similarly, neuroimaging research has revealed abnormalities in cortical regions and brain circuitry both implicated in stress and depression [4,8,9]. As a result one theoretical approach has been to explain the well-documented and frequent co-occurrence of chronic stress in the development and severity of a wide range of illness and disease [10,11].
The following study explores the impact of SES on brain function in relation to reward circuitry responses using blood oxygen dependent (BOLD) fMRI and examines the neural response to positive affective stimuli in persons living in a low SES position compared to those in higher SES. Our hypothesis came from human and animal research demonstrating a diminished ability to experience pleasure or positive motivation in response to repeated adversity [8]. Because the effect of stress on brain function can be demonstrated by means of appropriate stimuli designed to activate neural substrates [12], we theorized that those in low SES positions would demonstrate decreased activation in areas commonly associated with the processing of positive affective stimuli, including regions associated with pleasure and reward in comparison to higher SES subjects.
MATERIALS AND METHODOLOGY
Subjects
22 African American subjects were scanned over the course of a year. 7 were subsequently discarded due to head movement greater than 1 voxel (3-4mm), leaving 15 subjects (6 males, 9 females; mean age=24; range 19–29 years; 8 low SES and 7 high SES). Prior to participation, each subject provided written informed consent as commensurate with the Mount Sinai School of Medicine Institutional Review Board. All subjects were right-handed, native English speakers, without a history of self-reported psychiatric difficulty including depression, head trauma, neuropsychiatric complication, and illicit chemical or alcohol dependence.
Subjects were categorized into high and low SES categories based on both childhood and current SES. To qualify for inclusion, subjects had to have been SES-concordant in both childhood and adulthood. The SES classification algorithm is available by request.
Paradigm
The fMRI activation paradigm consisted of an emotional image probe, with semantic specificity, allowing for a complementary higher-level examination of the hypothesized circuitry. This paradigm employs stimuli whose emotional qualities are incidental relative to the explicit nature of a picture/scrambled-image determination behavioral task demand (2-alternative-forced-choice; 2AFC). Using this technique, the evocation of potentially confounding cognitive processes (e.g., semantic categorization) could be minimized.
While we only report data on the stimulus conditions of interest (e.g. positive v. neutral; data from the other conditions have been reported elsewhere [13,14]), the entire stimulus set consisted of positive, negative, neutral and poverty images counterbalanced across visual orientation presented against a black background. Positive, negative, and neutral images were selected from the International Affective Picture System [15], while poverty images were validated in a similar manner using 50 volunteer participants.
Behavioral responses were based on picture/scrambled-image judgment cues. Subjects were instructed to perform a 2AFC right index finger button-press immediately upon presentation of a picture and perform a right middle finger button press upon presentation of a scrambled image. Corresponding button presses were counterbalanced across subjects. Subjects were not pre-informed of the emotional nature of the stimulus images.
The task was presented in a block design. Presentation was counterbalanced to control for order and time effects. Each block was comprised of 10 novel stimuli of the same valence; there were 100 trials per condition, 400 total trials per study session. Blocks were counterbalanced to include 1, 2 or 3 scrambled stimulus images. Each stimulus appeared for 1.5 second, followed by a jittered inter-stimulus interval (ISI) averaging 1900 msec., for a total block duration of 34 seconds. Each block was followed by 12 seconds of rest. Each run was preceded and followed by an additional 36-second rest period. During rest periods, subjects were instructed to look at a centered fixation cross with their minds blank or floating freely. Stimulus presentation and response collection were performed within the E-Prime environment (http://www.pstnet.com).
Immediately after exiting the scanner subjects were presented with a series of images via computer consisting of those seen during scanning (targets) randomly interspersed with an equal number of new images (distractors). Subjects were asked to indicate which images they believed were presented during the scanning session using a 2AFC (yes/no) button press. Because subjects were not informed of this task prior to entering the MRI, the purpose of this assessment was to explore any differences in the incidental encoding of the presented images. Following the completion of this task, subjects were asked to rate a similarly counter-balanced subset of target images presented on a touch screen monitor along a Likert-like scale according to emotional valence [15] in order to confirm stimulus categorizations.
Image Acquisition
Image data were acquired with a research-dedicated Siemens Allegra Magnetron 3 Tesla head dedicated MRI scanner (maximum gradient strength ~60mT/m, max gradient slew ~600T/m/s). T1-weighted spoiled gradient (MP-RAGE) MRI whole brain anatomical scans (208 slices; .82 mm in-plane resolution, .80 mm slice thickness, contiguous slices) were acquired followed by T2-weighted Turbo Spin Echo axial whole brain images (3mm slice thickness) to explore potential pathology. Finally, gradient echo planar imaging - BOLD fMRI were acquired (TR=2000msec, TE=30, 32 slices; 3mm thickness; Imm gap) as an index of neuronal activity during the 2AFC activation paradigm.
Imaging Processing and Data Analysis
Prior to statistical analysis, the first two volumes of each run were discarded to allow the MR signal to reach steady state. The remaining images in each participant’s time series were motion corrected using the MCFLIRT module of FSL (FMRIB’s Software Library, v3.3) package (http://www.-fmrib.ox.ac.uk/fsl). Images in the data series were spatially smoothed with a 3-D Gaussian kernel (FWHM = 8mm), and temporally filtered using a high-pass filter (320 seconds). The FEAT (FMRIB’s Expert Analysis Tool) module of FSL package was used for these steps and later statistical analysis.
Customized square waveforms were generated for each individual with onset timing (on/off) generated according to the order of experimental conditions. These waveforms are convolved with a double gamma hemodynamic response function. For each participant, FILM (FMRIB’s Improved Linear Model) was used with local autocorrelation correction to estimate the hemodynamic parameters for four explanatory variables (EVs; neutral, positive, negative, and poverty) and to generate statistical contrast maps of interest. The six movement parameters (i.e., translation and rotation of x, y, and z axes) were then modeled as covariates.
The five experimental runs for each participant were analyzed separately and the average of these five runs for each individual obtained through a higher-level analysis using the FLAME (FMRIB’s Local Analysis of Mixed Effects) module (stage 1 only). Contrast maps were warped into common stereotaxic space before mixed-effects group analyses were performed. The normalization procedure involved registering the average EPI image to the MP-RAGE (T1) image from the same participant, and then to the ICBM152 T1 template, using the FLIRT (FMRIB’s Linear Image Registration Tool) module.
Statistical maps were thresholded at Z>2.81, p<0.005 two-tailed uncorrected with local peaks (maximal activation) located using the Mintun peak algorithm [16]. Small volume corrections (p≤0.05) were then applied to a priori anatomically based regions of interest including the anterior and posterior cingulate, insula and ventral striatum.
RESULTS
Demographic Data
The demographic characteristics of subjects are reported in Table 1. Of note, low SES subjects were more likely to have a lower educational attainment (p ≤ 0.006), lower household income (p ≤ 0.031), and lower scores on the COMQOL productivity measure (p ≤ 0.021) than high SES subjects.
Mean, Standard Deviation and Significance for Demographic Characteristics of the fMRI Included Sub-Sample by SES Group
| Demographic Measure | Low SES (N=8) | High SES (N=7) | Significance |
|---|---|---|---|
| Gender | 4 Male 4 Female |
2 Male 5 Female |
n/a |
| Age | 22.63 (2.77) | 25.57 (2.51) | t=2.15, p=.051 |
| Education† | 2.62 (1.06) | 4.14 (0.69) | Z=2.75,p=.006** |
| Current Household Income | $29,956 ($14,543) | $56,714 ($24,464) | t=2.53, p=.031* |
| Num. of People who Sleep in Home | 3.13 (1.55) | 2.14 (1.35) | t=1.30, p=.216 |
| Perceived Stress Scale | 17.38 (5.78) | 16.14 (5.27) | t=0.43, p=.675 |
| Perceived Neighborhood Stress | 30.50 (9.18) | 33.00 (6.14) | t=0.61, p=.553 |
| Rosenberg Self Esteem | 17.75 (8.48) | 16.00 (4.32) | t=0.49, p=.631 |
| Comprehensive Quality of Life Inventory | |||
| Material Well-Being | 8.63 (1.60) | 10.00 (0.82) | t=2.05, p=.061 |
| Health | 13.38 (1.51) | 14.29 (0.49) | t=1.53, p=.151 |
| Productivity | 13.00 (1.85) | 15.43 (1.72) | t=2.62, p=.021* |
| Intimacy | 12.38 (2.26) | 13.86 (0.90) | t=1.62, p=.130 |
| Safety | 11.50 (2.20) | 11.43 (1.27) | t=0.08, p=.941 |
| Emotional Well-Being | 9.00 (2.07) | 10.86 (1.35) | t=2.02, p=.064 |
| MacArthur Psychosocial Ladder | 4.88 (2.23) | 6.00 (2.04) | t=1.01, p=.330 |
| Social Support | 0.87 (0.64) | 1.00 (0.58) | t=0.39, p=.700 |
| Negative Life Events | 2.14 (0.38) | 1.79 (0.39) | t=1.73, p=.109 |
Note. Data are mean (SD) except where indicated.
* p<.05
** p <.01
† Education was measured on a 5-point scale with a higher value indicating a greater level of education (<H.S., H.S. Diploma, Some College, College Degree, Graduate/Professional Education). Analysis conducted using a Mann–Whitney U.
Behavioral Performance
Reaction times (RT) to the 2AFC task demonstrated a significant effect of stimulus condition (positive, neutral, negative and poverty trials: F(3,15) = 5.137, p ≤ 0.012). Further analyses of stimulus conditions relevant to the current hypothesis by group (low SES vs high SES) revealed a significant RT difference during positive image stimulus conditions (F(1,14) = 5.999, p ≤ 0.028) with faster responses being made by the high SES group (mean RT = 586.62ms) compared to the low SES group (mean RT = 730.08ms). No RT differences were observed between groups during neutral image stimulus conditions (F(1,14) = 3.602, n.s).
Post-Scan Behavioral Performance
Recognition Accuracy
Signal detection analysis (d’) for the incidental recognition of the two stimulus image conditions relevant to the hypothesis (positive and neutral) revealed no incidental recognition differences between high and low SES groups (positive stimuli, t(16)=1.49, n.s.; neutral stimuli, t(16)= 1.75, n.s.). However, analysis of the overall recognition accuracy differences between condition revealed a significant difference between neutral and positive image recognition (t(17)=2.156, p=0.046). Post-hoc within group analysis revealed that even though subjects were not informed of a post-scan recognition assessment prior to scanning, differences were observed in the recognition accuracy with neutral images being recalled better than positive images by the high SES group (high SES t(8)=2.718, p=.026; low SES t(8)=0.898, n.s).
Valence Rating
Analysis of the post-scan ratings of all stimulus images (positive, negative, poverty, and neutral) confirmed our assignment of stimuli to positive, negative, poverty and or neutral categories (F(3,60)=80.73, p≤.001) respectively. It is therefore fair to assume that the images employed in this study were reasonable probes of emotional processing within the participating subject population.
fMRI Results
Contrasts defined as low SES > high SES, positive vs. neutral revealed significantly less activation to positive stimuli in low SES subjects relative to higher SES subjects. Neuronal responses significant at p<.05, corrected for multiple comparisons were observed in the insula (right: [42,8,-10], Z=-3.66), fusiform (left:[-18,-2,-38], Z=-3.16), anterior cingulate (subgenual: [0,38,2], Z=-3.13;), posterior cingulate (left [-2,-34,14], Z=-3.76), caudate (left: [-2,16,10], Z=-3.13); right: [12,-2,28], Z=-3.07), pons (left: [-6,-14,-22], Z=-3.79), hippocampus (right: [34,-38,6], Z=-2.91). Posthoc analysis confirmed that there was no baseline shift that affected the group differences on the positive versus neutral contrast. In other words, the results observed between the two contrasts (neutral v positive) did not arise from low SES subjects having increased activations nor high SES subjects having attenuated activations to the ‘neutral’ stimuli.
DISCUSSION
Emerging evidence suggests that psychological stress may result in behavioral and autonomic changes placing one at greater risk of disease [4]. That a behavioral performance difference as measured by reaction time for positive images but not for neutral images in a scrambled/unscrambled judgment task lends further support to the assumption that even basic motor processes can become variable across simple choice tasks in the context of emotional tone in those living in lower SES. In such light, it is interesting that mood congruent biases in cognition and emotional responsitivity are among the most commonly reported research findings in the neuropsychiatric literature on depression – the disorder most commonly examined in association with low SES [17].
Notably, while the phenomenology of depression consists of an accentuation of negative affective processing it also consists of an inability to experience pleasure or positive motivation. That the subgenual anterior cingulate (sgACC) and posterior cingulate both demonstrated reduced responsivity to positive images in those in low-SES compared to those in higher SES (Fig. 1A) is consistent with recent literature demonstrating volumetric deficits in the sgACC [9] and abnormally decreased blood flow in other areas associated with reward and pleasure in depression [18].
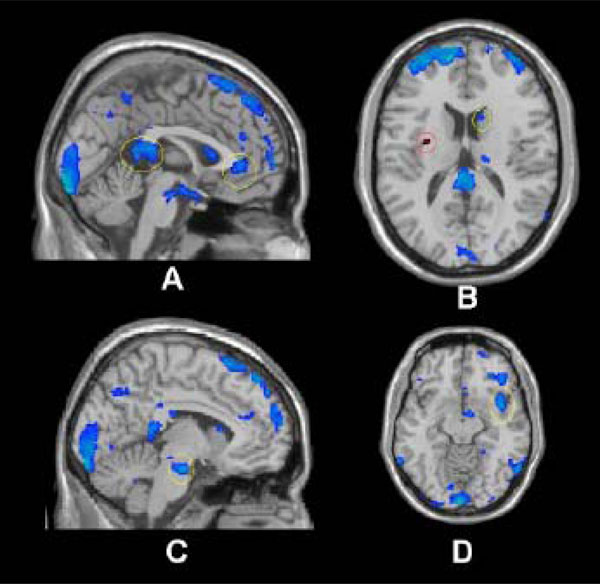
low SES > high SES, positive vs. neutral. Threshold at p=.05 for visualization. Regions marked in blue (superimposed on an anatomical image) had statistically significant BOLD decreases whereas regions in red indicate significant BOLD increases.
A) Cingulate (anterior and posterior); B) Caudate (yellow), Insula (red); C) Pons; D) Insula.
The relative down regulation of the caudate in those in low-SES compared to higher SES (Fig. 1B) is particularly interesting in light of this region's prominent role in the processing of pleasure, reward and anticipated satisfaction [19,20]. Indeed, cerebral blood flow and metabolism have been shown to be abnormally decreased in the caudate in subjects diagnosed with major depression and bipolar disorder [21]. Consistent with this, a recent fMRI study found that depressed patients demonstrated significantly less ventral striatum activation to positive linguistic stimuli [18]. That the neural activation in the caudate, an area implicated in motivation and action [22], differed strongly between SES groups offers additional evidence to implicate economic stress in the development of depression and possibly other mood disturbances via processes occurring in the autonomic nervous system (e.g. pons [23]; Fig. 1C) and cortical regions associated with mediating reciprocal modulation of cognitive, heteromodal sensory, limbic, and autonomic control [24]. Interestingly, the insula which is histologically, topographically, and connectively poised to mediate reciprocal modulation of polymodal sensory, cognitive, emotional, and cerebrogenic autonomic control demonstrated both increased and decreased regulation during the activation paradigm (Fig. 1B & D). Notably, increased regulation in the anterior insula (especially left, Figure 1;B) has been demonstrated during anticipation of a unpleasant stimuli [25], while lowered activity (at the functional level) has been associated with long term chronic stress (e.g. posttraumatic stress disorder; PTSD) [26]. In such light, the conceptualization of low-SES conditions acting as a chronic stressor similar to other extended stress related disorders such as PTSD requires further exploration.
Finally, considerable evidence points to maladaptive emotional, behavioral and cognitive responses to stressful life circumstance as a hallmark of mood disorders and while those living in lower-SES are reported to be at higher risk for mood disorders [27], questions remain concerning the causal direction. Two suspected routes are social selection, which posits that individuals with psychopathology have a reduced ability to hold jobs and therefore a lower SES (referred to as social drift), and social causation, which posits that people with low SES develop psychiatric disorders as a result of living with adversity. Evidence for psychiatric social selection has been demonstrated by a handful of studies in which early-onset psychiatric disorders were shown to lead to reduced educational attainment [28], that severe early-onset disorders like schizophrenia were shown to lead to reduced income in adulthood [29], and that attention-deficit/hyperactivity disorder lead to lower adult SES [30]. A concern with this literature base, however, is that many studies relating SES to psychopathology have involved child/adolescent samples, making the likelihood of social selection in these cases low as subjects tend to be too young to account for a significant portion of their families’ income (with the exception of an indirect effect, in which the child’s issues reduces the parents ability to maintain their income). Rather, an overwhelming majority of results from longitudinal studies provides more evidence in support of the social causation hypothesis [2,31]. Certainly, in most cases, a combined effect of both factors is likely responsible - as psychopathology can manifest in a multitude of ways and with a variety of time courses.
CONCLUSION
The intent of this study was to determine whether individuals living in low SES would respond differently than individuals living in higher SES to positively valenced stimuli in the context of a behavioral EPI-BOLD fMRI activation paradigm. We hypothesized that such differences would be tied to cortical regions associated with positive affect, reward and motivation. The importance of the current findings lie in the support they lend to understanding the specific nature of emotion processing and behavioral abnormalities among low-SES individuals and prove helpful in laying the groundwork for determining the mechanisms responsible for health disparities across the social gradient. While the data indicate that living in low-SES is associated with biases specific to positively valenced stimuli, we are now left with a number of questions. Namely, does the observed dysfunction arise from or give rise to depressive states? If the latter, than what accounts for the higher depression rates and health risks associated with lower SES and what role, if any, do they have in contributing to the maintenance of the social economic position?
ACKNOWLEDGMENTS
The authors would like to thank Pamela Burke, Frank Macaluso and Hanna Oltarzewska for their technical assistance and Dr. Yasmin Hurd for reviewing this manuscript prior to submission.

