All published articles of this journal are available on ScienceDirect.

Tracking Development of the Corpus Callosum in Fetal and Early Postnatal Baboons Using Magnetic Resonance Imaging
Abstract
Although the maturation of the corpus callosum (CC) can serve as a sensitive marker for normative antenatal and postnatal brain development, little is known about its development across this critical period. While high-resolution magnetic resonance imaging can provide an opportunity to examine normative brain development in humans, concerns remain over the exposure of developing fetuses to non-essential imaging. Nonhuman primates can provide a valuable model for normative brain maturation. Baboons share several important developmental characteristics with humans, including a highly orchestrated pattern of cerebral development. Developmental changes in total CC area and its subdivisions were examined across the antenatal (weeks 17 – 26 of 28 weeks total gestation) and early postnatal (to week 32) period in baboons (Papio hamadryas anubis). Thirteen fetal and sixteen infant baboons were studied using high-resolution MRI. During the period of primary gyrification, the total area of the CC increased by a magnitude of five. By postnatal week 32, the total CC area attained only 51% of the average adult area. CC subdivisions showed non-uniform increases in area, throughout development. The splenium showed the most maturation by postnatal week 32, attaining 55% of the average adult value. The subdivisions of the genu and anterior midbody showed the least maturation by postnatal week 32, attaining 50% and 49% of the average adult area. Thus, the CC of baboons shows continued growth past the postnatal period. These age-related changes in the developing baboon CC are consistent with the developmental course in humans.
1. INTRODUCTION
Cerebral development in primates during the fetal and early postnatal period involves coordinated biochemical and structural changes including histogenesis (including neurogenesis and gliogenesis), migration, and myelination. Understanding cerebral development in utero is especially important, as abnormal development during this period is believed to contribute to the etiology of many neurodevelopmental disorders, including autism spectrum disorder, attention deficit disorder and mood disorders [1-4].
The corpus callosum (CC) is the largest commissural white matter tract in placental mammalian brains, connecting both homotopic and heterotopic regions of the cerebral cortex [5]. The CC is part of the latest maturing networks of the brain, and is essential for the interhemispheric integration of sensory, motor and higher-order cognitive information. Thus, its development and maturation serves as a sensitive indicator of normal brain development. However, while prenatal abnormalities of the CC have been reported [6, 7], little is known about its normal development from in utero to maturation.
In the human embryo, callosal axons appear around 74 days [8, 9]. The subdivisions of the genu and splenium can be identified at 84 days and the adult morphology is recognized by 115 days [8]. Measurements of callosal width, length and thickness from magnetic resonance [10] imaging are possible from gestational week 16 [11]. Over the gestational course, the thickness and width of the CC increase by a magnitude of three [11]. During the first few postnatal months, a growth spurt is seen in the genu of the CC, followed by a period of rapid growth in the splenium [12]. By eight months, the CC has an adult appearance on a midsagittal MR image. The CC continues to mature throughout childhood and adolescence. Ongoing regressive and progressive maturational events result in a functional reorganization of the CC [13].
While investigation of fetal and early postnatal brain development can be accomplished using high-resolution magnetic resonance imaging (MRI), concerns remain over the exposure of developing fetuses to nonessential imaging [14]. Thus, nonhuman primates (NHP) can serve as a valuable model for human cerebral development. Of NHP, no species other than apes are closer to humans from an evolutionary perspective than are baboons (Papio spp.) [15]. Baboons share several important characteristics of development with humans, including a prolonged infancy and juvenile period, long lifespan, and complex social behavior; they are ideal models for investigating cerebral development and are likely to further our understanding of neurodevelopmental disorders, psychiatric conditions and disease [2].
Baboons share a highly orchestrated pattern of cerebral development with humans. Formation of the cerebral landscape, or primary gyrification (PG), begins in the early stages of telencephalic development. Its onset coincides with completion of neuronal proliferation and migration; its progression is accompanied by an explosive increase in cerebral growth [10, 16, 17]. The onset of PG is coupled with the beginning of neuronal differentiation that partitions the cortical lamina into an intricate mosaic of specialized functional areas [18]. Primary cortical sulci and gyri appear in a tightly controlled ontogenic sequence during PG; this pattern is highly conserved across primates, including humans [10, 17, 19]. The baboon CC can be visualized at 110 days gestation [20]; however, the relation of CC growth to PG is unclear.
Given the importance of the CC to fundamental human cognitive abilities and as a marker of normal brain development, it is important to understand the development of this structure in a primate that displays similarity to humans in other aspects of neuroanatomical maturation. In this report, we used high-resolution MRI to quantify the development of CC in fetal and early postnatal baboons. We relate the growth of the CC to PG in baboons to more fully understand the integrated development of these two key components of cerebral development.
The main challenge in imaging of NHP is that adult brain volumes are much smaller than the human brain volume by a factor of 2-200. This difference in size is further accentuated in NHP studies of antenatal brain development in which fetal brain volumes are 20-50% of their adult size. An important consideration in the design of an imaging protocol is spatial resolution with which brain morphology is sampled. While the brain volumes of NHP are much smaller than human brains, not all internal brain structures scale allometrically with brain volume. For example, the average thickness of cerebral cortex is very similar among all mammals (about 2 mm) and yet the characteristic sizes of the morphological features of cortical landscape structure, gyri and sulci, scale directly with brain volume [21]. We designed an imaging protocol for allometric spatial sampling in baboon brain [22]. Our protocol uses an isotropic spatial sampling volume of 150 microns3 (isotropic 500 micron resolution). This provides the spatial sampling of the gyral and sulcal structures comparable to high resolution high resolution human studies (~1.0mm3) in a primate whose brain volume is 1/8 the volume of a human brain. Likewise, imaging at this spatial resolution yields a much finer sampling of the cortical gray matter ribbon whose thickness is similar in baboons and humans, while providing sufficient signal-to-noise ratio for semi-automated and automated imaging process [22].
2. METHOD
Pregnant Animals
A breeding colony of olive baboons (Papio hamadryas anubis) has been maintained for more than 40 years by the Southwest National Primate Research Center (SNPRC) at the Southwest Foundation for Biomedical Research in San Antonio, Texas. In utero imaging of 13 normally developing fetuses was performed covering the period of gestational week 17 through birth (gestational week 28); imaging was performed on an additional 16 baboons up to postnatal week 32. Fetal gestation age was calculated from the date of birth [23].
Handling and Anesthesia
Animals were transported from the SNPRC to the Research Imaging Institute, University of Texas Health Sciences Center at San Antonio for imaging. Handling and anesthesia procedures followed previously described procedures [24]. In short, 15 minutes prior to scanning, animals were immobilized with ketamine (10 mg/kg) and intubated with a MR-compatible endotracheal tube. Anesthesia was maintained with 5% isoflurane with an MR-compatible gas anesthesia machine. Animals remained anaesthetized throughout the MRI procedure and respiration rate, heart rate, and oxygen consumption were continually monitored. This protocol and all animal procedures were reviewed and approved by the Institutional Animal Care and Use Committee of the Southwest Foundation for Biomedical Research.
Image Acquisition
The methodological details of the in utero and post natal imaging are discussed elsewhere [22]. High-resolution (isotropic 500μm) images of the fetal baboon brain were acquired with a 3D, balanced steady-state free precession pulse protocol with respiratory gating and retrospective motion correction (Kochunov and Davis 2009). The sequence control parameters TR/TE/flip angle/FOV/Spatial Resolution/Scan Time = 5ms/2.5ms/75degrees/180mm/500 microns isotropic/30 min, allow for rapid collection of 3D data phase partition of 360 lines within a single respiration cycle. Our objectives in development of this protocol were to achieve high-SNR and 3D and isotropic coverage of a fetal brain with good, regional gray matter – white matter tissue contrast (Fig. 1, top). The choice of sequences for in utero imaging is generally limited to sequences that emphasize tissue differences in T2 relaxation times (T2-weighted). In the unmyelinated fetal brain, there is little T1-weighted GM/WM contrast and additional complications arise due to amniotic fluid that surrounds the fetal head. Its T1-relaxation time is similar to that of brain tissue, thus complicating segmentation procedures. Fortunately, there is sufficient difference in the T2 relaxation times among cerebral WM, GM and amniotic fluid (~2000 ms), allowing for sufficient brain tissue contrast and excellent brain/amniotic fluid contrast [22]. We chose a 3D balanced gradient echo (TrueFisp) sequence as this sequence provides the highest level of signal per TR-interval among all MR sequences. While the image contrast in a TrueFisp pulse sequence depends on the T2/T1 ratio as opposed to T2, in fetal brain imaging, the tissue contrast is qualitatively similar to that of the T2-weithed sequences, providing an excellent regional contrast in fetal cerebrum (Fig. 2).
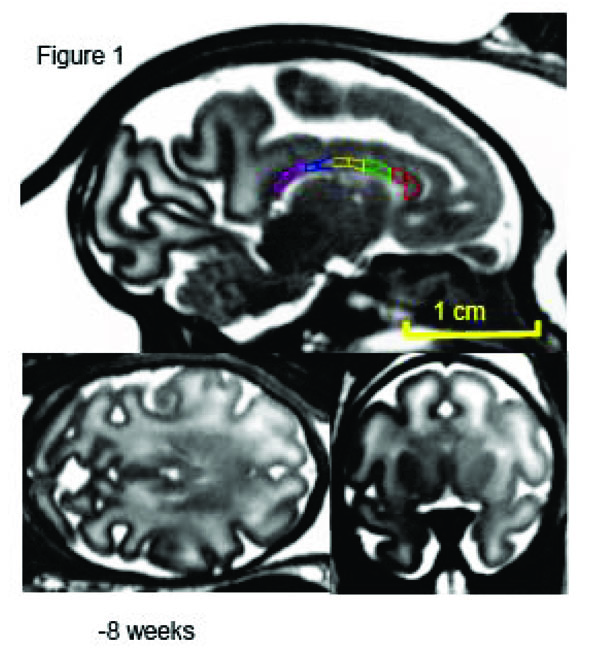
Mid-sagittal (top) axial (left) and coronal (right) slices of a fetus at week 20 (of 28-week long term) of in utero development. The high-resolution (isotropic 500µm) SSFP images show good (~20%) GM/WM contrast and signal to noise ration (~30) that allows for delineation of corpus callosum. The corpus callosum is traced, and subdivided into five regions, on the midsagittal section at each age. 1 = genu, 2 = anterior midbody, 3 = medial midbody, 4 = caudal midbody, and 5 = splenium.
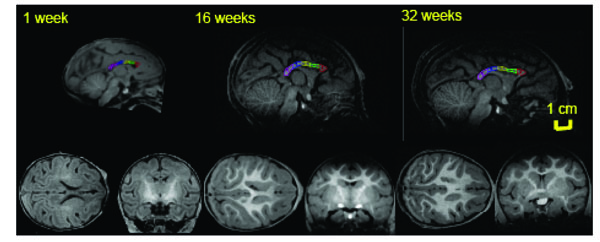
Mid-sagittal (top) axial (left) and coronal (right) slices of baboon brain at week 1 (left), 16 (middle) and 32 (right) of postnatal development. The high-resolution (isotropic 500µm) T1-w images show an excellent (~25%) GM/WM contrast as well as the contrast between myelinated and unmyelinated WM. The corpus callosum is traced, and subdivided into five regions, on the midsagittal section at each age. 1 = genu, 2 = anterior midbody, 3 = medial midbody, 4 = caudal midbody, and 5 = splenium.
Two additional factors that make fetal brain imaging technically challenging are the periodic, respiratory motion of the mother’s diaphragm and fetal head movement [22, 25]. To suppress artifacts association with respiratory motion we used respiratory gating in combination with mechanical ventilation. During respiratory gating, the animal breathing pattern is monitored using the tidal volume measurement provided by the mechanical ventilator. When the diaphragm is fully expanded, a trigger signal is sent to the host computer. Following a trigger delay time, set to be sufficiently long for an animal to exhale, data acquisition is performed in the 3-5 second intervals when the diaphragm is at rest. To correct for potential fetal head movement, we acquired structural images using a retrospective motion-corrected approach [26]. High-resolution spatial sampling and the need for sufficient SNR translate into a long scan time of 20-30 min and this inevitably leads to the increased likelihood of motion even in anesthetized animals. To prevent motion-related artifacts we partitioned motion into two categories: intra- and inter-scan. Intra-scan motion leads to blurring and phase-related artifacts. Such artifacts cannot be adequately corrected. In contrast, inter-scan movements can be modeled as a 3-D rigid-body motion and corrected using spatial realignment. To reduce the intra-scan fetal head motion, we segmented image acquisition into intervals of only 2-3 min long. The time-segmentation of data acquisitions helped us to cast the intra-scan motion into the inter-scan category which can be modeled and corrected [26].
A 3D, magnetization-prepared, transient steady state, rapid gradient echo (MPRAGE) sequence with isotropic 500 μm resolution was chosen to study post-natal development [22]. This sequence provides an excellent T1-weighted contrast that is uniform across the brain volume and can be used to differentiate between gray matter and myelinated and unmyelinated white matter [27]. The sequence control parameters (FOV=128mm, TI=795ms, TE=3.04, TR1=5 ms, TR2=2000ms and flip angle=10 degrees) were modeled to produce GM/WM contrast of 25% based on the analytical solutions to Bloch equations [28] and average measured values of T1, T2 and PD. Image acquisition was performed using a retrospective motion-corrected protocol [29]. Under this protocol, six full resolution segments, 9 min. long each, were acquired for a total sequence running time of ~54min.
Image Quantification
Measures of CC area were taken from T2-weighted TrueFisp images, which allow for better differentiation of cortex and white matter in fetal and postnatal brains. Prior to morphometric analysis, data were converted into the ANALYZE 3D volume file format to facilitate re-slicing into orthogonal planes. 3D volumes for individual subjects were numerically coded prior to measurement to prevent observer bias. Each individual brain was realigned along the AC-PC and interhemispheric fissure. CC area measurements were performed using manual tracings on the midsagittal slice according to the methodology that was originally described by Biegon and colleagues [30] and later adapted to NHP by Sanchez et al. [31]. In the original procedure, the anterior 20% of the CC was defined as the genu, the posterior 20% defined as splenium, and the middle 60% defined as body. To adapt this to NHP studies, Sanchez et al. [31], Phillips et al. [32], and Pierre et al. [33] further delineated the middle 60% into three equal regions: anterior midbody, medial midbody, and caudal midbody. These subdivisions of the CC are believed to be based on microstructure and functional connectivity with cortical areas [34-36]. The anterior region of the genu connects primarily higher-order cognitive regions; the anterior, medial and caudal midbody connect primarily sensorimotor regions; the posterior region of the splenium integrates visuospatial regions of the cortex. ANALYZE 10.0, an MRI analysis software program distributed by the Mayo Clinic, was used to divide and measure the CC (in mm2). To subdivide the CC, the entire length of the CC was first manually traced, and then divided into five equally spaced sections.
Statistical analysis. Changes in the total CC and CC subdivision areas were analyzed using ANCOVA to calculate the significance of sex and age effects. These analyses were conducted using a generalized linear model that included linear and quadratic effects of age and linear effects of sex and age. Both linear and quadratic terms were included, given previous reports of developmental patterns in the human CC [37, 38]. This approach was used to avoid the problem of multicollinearity on the total CC area (as total CC is a linear combination of the five CC subdivisions). Sex was used a fixed factor because testosterone modulates regional callosal architecture producing gender-specific differences in regional development [39]. F tests were used to determine whether linear or quadratic growth models best fit the developmental change in these regions [40-44].
3. RESULTS
At gestational week 17 the CC could be readily identified, the total area of the CC in this subject measured 7.68 mm2. By postnatal week 32, the total area of the CC has increased to 73.47 mm2. Total CC area did not differ significantly by sex (F (1, 26) = 2.88, p = .102). Total CC area was significantly affected by the covariate age (F (1, 26) = 145.23, p < .001). All subdivisions of CC were significantly affected by the covariate age [genu: F (1, 26) = 66.16, p < .001; anterior midbody: F (1, 26) = 73.76, p < .001; medial midbody: F (1, 26) = 86.70, p < .001; caudal midbody: F (1, 26) = 155.19, p < .001; splenium: F (1, 26) = 116.36, p < .001). The subdivision of the anterior midbody was significantly influenced by sex, with females having larger raw areas than males (anterior midbody: female M = 8.38, SD = 4.48; male M = 6.22, SD = 3.61; F (1, 26) = 13.05, p = .001). Sex differences were not detected for any other CC subdivision.
The total area of the CC displayed significant age-related change across the fetal and early postnatal period and was best explained by quadratic growth (F (2, 26) = 108.99, p < 0.001; R2 = .89; see Fig. 3). Changes in the genu and splenium were similarly explained by linear and quadratic growth [genu: linear: F (1, 27) = 65.23, p < 0.001; R2 = .70; quadratic: F (2, 26) = 37.84, p < 0.001; R2 = .73; splenium: linear: F (1, 27) = 117.39, p < 0.001; R2 = .81; quadratic: F (2, 26) = 76.02, p < 0.001; R2 = .84]. Growth in the anterior midbody, medial midbody and caudal midbody was best explained by quadratic growth [anterior midbody: F (2, 26) = 31.75, p < 0.001; R2 = .69; medial midbody: F (2, 26) = 68.93, p < 0.001; R2 = .83; caudal midbody: F (2, 26) = 163.35, p < 0.001; R2 = .92]. Growth curves for all subdivisions of the CC are displayed in Figs. (4a– e).
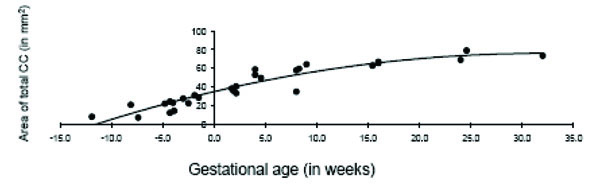
Age-related change in the total corpus callosum in fetal and early postnatal baboons is best described by a quadratic curve (area = -.041*age2 + 2.59*age + 34.72; R2 = .89).
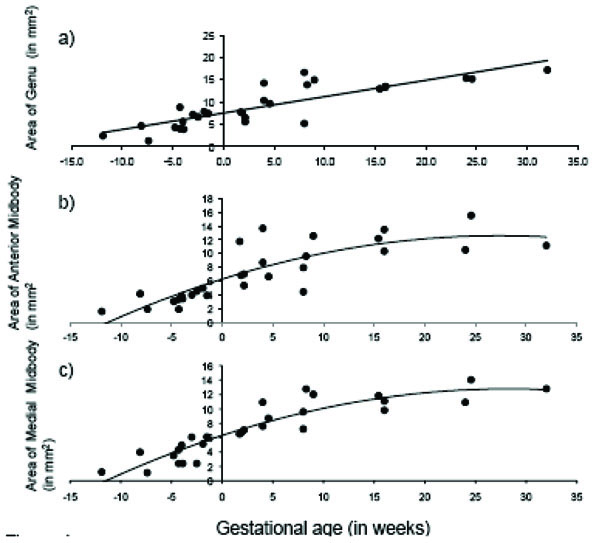
Age-related change in CC subdivisions in fetal and early postnatal baboons: A) genu (area = .368*age + 7.52; R2 = .71), B) anterior midbody (area = -.008*age2 + .462*age + 6.29; R2 = .69), C) medial midbody (area = -.008*age2 + .457*age + 6.31; R2 = .83), D) caudal midbody (area = -.008*age2 + .495*age + 5.91; R2 = .92), and E) splenium (area = -.009*age2 + .684*age + 8.36; R2 = .84).
4. DISCUSSION
To our knowledge, this is the first study to analyze changes in CC area during primary gyrification and early postnatal development. Primary gyrification (PG) in baboons occurs rapidly over a nine week period in the early stages of telencephalic development, from gestational week 17 to gestational week 26 [25]. During PG, the cross-sectional area of CC in fetal baboons increased by a magnitude of five. The rapid growth of CC continued past partition, doubling in size by week 32 of postnatal development. At that time, the size of CC was only 51% of the average adult CC area (142.98 ± 22.09 mm2) indicating that maturation of the baboon CC continues past the early postnatal period. The growth for different subdivisions of CC was not uniform. At week 32, the genu achieved 50% of the average adult value, the anterior midbody achieved 49%, the medial midbody 53%, and caudal midbody 48%, and the splenium achieved 55% of the average adult value. Growth in the subdivisions of the genu and splenium were similarly explained by linear and quadratic equations, increasing in area across the fetal and early postnatal period. For the anterior midbody, medial midbody and caudal midbody regions, the quadratic equation accounted for a significantly greater amount of variability compared to the linear equation, indicating that these subdivisions displayed non-linear growth.
Developmental changes in cross-sectional area of CC in humans correspond to increased axonal myelination rather than changes in axonal density [34, 45]. The same mechanisms are presumed to be responsible for our findings. Based on developmental data of the CC in chimpanzees and capuchin monkeys indicating continued maturation into adulthood [40, 46], we would expect the baboon CC to also display continued growth into adulthood.
While sex differences in the size of the baboon CC were not detected for total CC area, sex differences were found in anterior midbody. Several factors may explain why we did not detect sex differences in the development of the baboon CC. While the sample was balanced with respect to distribution of males and females in both the fetal and early postnatal period, the overall sample size was limited (13 fetal subjects, 16 postnatal subjects). Variability across samples may have masked potential sex differences in development. Additionally, it may be that during this early developmental stage there are no sex differences present in the baboon CC.
Whether or not sex differences are present in the development of the human CC across childhood and adolescence is controversial, as reports are inconsistent [37, 41, 47-50]. However, different methodologies, including varying sample sizes, ages, and means of quantifying the CC, may explain these discrepancies. In fact, when controlling for these variables, human males and females display significant differences in the maturation of the CC and CC subdivisions [51]. These sex differences vary as a function of callosal region and developmental stage. Postnatal structural changes in the human CC are likely due to myelination, pruning, and axonal redirection [52, 53].
In the present study, the CC was subdivided into five equal sections, following methodology of previous researchers [31-33]. These subdivisions are believed to be related to microstructure and functional connectivity based upon histological study [34]. It was not possible to collect histological data on this baboon sample to measure axon diameter distribution across the CC. Implementation of technologies such as diffusion tensor imaging (to track fiber projections) and AxCaliber (to measure axon diameter distribution in vivo) [54] would provide a refinement of callosal subdivisions and their growth trajectories.
Scientists are challenged to seek the most appropriate animal model of biological relevance to a given question and then to match that model with the measurement tool(s) best suited to test their hypothesis. Non-human primate (NHP) models for both normative and perturbed biology can yield invaluable findings, but NHP models are uniquely suitable for translational imaging research in genetics, morphology and maturation of cortical landscape [16, 55-57]. Genetically, Old World primates share up to 99% of the human genome [55]. The reduced complexity of the primate brain and compressed rate of cerebral development make NHPs a valuable research model to study brain maturation.
CONCLUDING REMARKS
Structural imaging research in NHPs is a rapidly growing field. MRI studies of NHPs can be used not only to validate basic neuroscience theories regarding development of cerebral cortex and CC, but also to accelerate the development of new drugs and medical devices. Several challenges must be overcome before achieving the same level of allometric sampling and tissue signals in NHPs as currently available in humans, due to their smaller brain volumes. Fortunately, emerging improvements in gradient and multi-channel RF electronics, acquisition software, along with higher magnetic field strengths allow for the acquisition of NHP imaging data that are compatible to the best structural data from humans (based on brain volumes). As presented here, careful optimization of MRI acquisition protocols and suppression of motion artifacts can produce highly reliable, quantitative data. Using these, or similar, strategies enables investigators to study NHP brain development using the wealth of computational tools already developed for humans.
ACKNOWLEDGEMENTS
We thank our collaborators for some of the material presented in this paper; Drs. Jeffery Rogers (Baylor Univ.), Steven Leigh (Univ. Illinois), Gerald Schatten and Carlos Castro (Univ. Pittsburgh). We also acknowledge technical assistance from the Dept. of Comparative Medicine at the Southwest National Primate Research Center (SNPRC). This work was supported, in part, by the National Institute of Neurological Disorders and Stroke (NIH R15 #NS070717) to KAP, the National Institute of Biomedical Imaging and Bioengineering (K01 #EB006395) grant to PK, the SNPRC (NIH #P51-RR013986), and NIH (#P01 HD047675 and R24 RR013632) grants to GS.

