All published articles of this journal are available on ScienceDirect.

Time-Dependent Cortical Activation in Voluntary Muscle Contraction
Authors Info & Affiliations
Abstract
This study was to characterize dynamic source strength changes estimated from high-density scalp electroencephalogram (EEG) at different phases of a submaximal voluntary muscle contraction. Eight healthy volunteers performed isometric handgrip contractions of the right arm at 20% maximal intensity. Signals of the handgrip force, electromyography (EMG) from the finger flexor and extensor muscles and 64-channel EEG were acquired simultaneously. Sources of the EEG were analyzed at 19 time points across preparation, execution and sustaining phases of the handgrip. A 3-layer boundary element model (BEM) based on the MNI (Montréal Neurological Institute) brain MRI was used to overlay the sources. A distributed current density model, LORETA L1 norm method was applied to the data that had been processed by independent component analysis (ICA). Statistical analysis based on a mixed-effects polynomial regression model showed a significant and consistent time-dependent non-linear source strength change pattern in different phases of the handgrip. The source strength increased at the preparation phase, peaked at the force onset time and decreased in the sustaining phase. There was no significant difference in the changing pattern of the source strength among Brodmann’s areas 1, 2, 3, 4, and 6. These results show, for the first time, a high time resolution increasing-and-decreasing pattern of activation among the sensorimotor regions with the highest activity occurs at the muscle activity onset. The similarity in the source strength time courses among the cortical centers examined suggests a synchronized parallel function in controlling the motor activity.
INTRODUCTION
The time course of brain activation during voluntary muscle contraction was first reported by the studies involving single-cell recordings in the brain of non-human primates [1-3]. These studies reported varying activation levels of motor cortical neurons among various phases (e.g., preparation vs. execution) during a motor control process. Although the observations provide valuable information describing single cell activities with time in animals in controlling a voluntary motor action, very little is known about activation time course of individual brain regions in humans in millisecond resolution.
Time courses of human cortical field activation are typically studied by neuroimaging involving relatively long-duration tasks. For example, alterations of activation of various brain areas were investigated during muscle fatigue lasting for many seconds using functional magnetic resonance imaging (fMRI) [4, 5] and positron emission tomography (PET) [6]. These studies demonstrate time- or fatigue-dependent alterations of cortical activities across a relatively long time but cannot identify potential shifts of the activity level from one stage (e.g., planning) to another (e.g., execution) in a motor control process given the relatively poor temporal resolution of current-available neural imaging techniques. Although scalp electroencephalography (EEG) [7] or magnetoencephalography (MEG) [8] signals have millisecond resolution and are frequently recorded to describe control strategies of the brain, the source(s) of the signals or the involving cortical fields are usually unknown because of relatively poor spatial resolution of these methods. To improve spatial resolution and maintain high temporal resolution of scalp EEG or MEG data, several inverse solution methods to estimate the signal sources have been developed [9]. These inverse methods aim to de-blur the head volume conductor effect on the signal recorded from the scalp to identify the true electrophysiological sources in the cortex. With detailed temporal and spatial information, the inverse method could serve as a promising technique to explore activation time course of a cortical region or regions in movement control.
Commonly used inverse models include equivalent-current-dipole, distributed current density, beamforming, etc. Equivalent-current-dipole model relies on an ad hoc assumption of a reasonable number of dipoles, their known locations and/or orientations. Distributed current density model does not need prior knowledge of specific source number and locations. Among the several available current-density estimation techniques, the low-resolution electromagnetic tomography (LORETA) has been shown to have better source localization ability than other methods [10, 11]. The LORETA technique has been used in investigating abnormalities of P300 in schizophrenia [12, 13], analyzing wide-spread epileptiform activities in epilepsy [14, 15], and exp-loring cognitive function of the brain in healthy individuals [16].
The purpose of this study was to use LORETA source-localization technique to estimate sources of scalp EEG signals (64 channels) recorded before and during a handgrip motor task and determine the time-dependent source strength (activity level) changes across preparation, execution and sustaining phases of the task in different cortical sensori-motor areas. It was hypothesized that neural activity in the cortical regions would vary depending on the control phases of the handgrip task and the changes could be detected by the current density reconstruction technique.
MATERIALS AND METHODOLOGY
Subjects and Motor Task
Eight right-handed subjects (4 men and 4 woman, age = 31 ± 2 yrs) participated in the study, none had neurological or other disorders at the time of study. The experimental procedures were approved by the Institutional Review Board at the Cleveland Clinic. All subjects gave informed consent prior to the participation.
Subjects were seated comfortably in an experimental chair in an electrically shielded data-recording room. During the experiment, subjects performed 20 isometric handgrip contractions of the right arm at 20% maximal voluntary contraction (MVC) level. An oscilloscope was placed in front of the subjects and the target was displayed on the screen. In each trial, they steadily increased the handgrip force to the target (20% MVC) level and matched the exerted force as closely as possible with the target for about 3 s.
Special precautions were taken to minimize noises in the data during the experiments. The subjects were required not to move the head and body, blink the eyes, bite the teeth, contract the facial/neck muscles, or tense the body while performing the low-intensity handgrips. Muscle fatigue was minimal by allowing sufficient rest between adjacent trials. The length of the inter-trial rest period was controlled by the subjects themselves, i.e., they started the next trial when they felt comfortable and completely rested. The inter-trial rest period was, on average about 20s.
Data Recording
Force
The handgrip force was recorded by a pressure transducer (EPX-N1 250 PSI, Entran Devices, Inc., Fairfield, NJ) interfaced with distill water in a bottle-like device through a nylon tube [17]. The output of the transducer was directed to the amplifier and then to an input channel of a Micro 1401 data acquisition system (version 3.05, Cambridge Electronic Design, Ltd., Cambridge, UK), which transferred the voltage data to a laptop computer. The sampling rate for digitizing the force data was 100 Hz.
EEG
A 64-channel NeuroScan EEG system (version 4.2, NeuroScan, El Paso, Texas, USA) was used to acquire EEG signals from the scalp. A Quik-Cap elastic nylon cap that held 64 electrodes was placed on the scalp for EEG data recording. Conducting gel was injected into each electrode to connect the recording surface of the electrode with the scalp. Impedance was controlled below 10,000 ohms. One electrode was used to record the force, which was used for the purpose of synchronizing the EEG with muscle activities. All the EEG electrodes were referenced to the common linked earlobes and the signals were amplified (X75,000), low-pass filtered (0.05-50 Hz), and digitized (2,000 sample/s).
Data Analysis
The force data were processed using house-coded programs within the Spike2 software package (Cambridge Electronic Design, Ltd., Cambridge, UK). The force onset time was set at the 10% handgrip MVC force rising from the baseline in each trial, which was used for the purpose of synchronizing the force, and EEG signals. The actual force was measured by averaging the data points in each trial when the force was steady (rising and falling portions were excluded) and then averaging across the trials before performing the group averaging.
The raw EEG data were visually inspected and trials with artifacts due to eye blinks or head movements were excluded (on average, 2±2 trials were removed in each subject). Both EEG data preprocessing and LORETA current density estimation were performed using Curry software package (version 4.5, Neuro Scan Labs, Virginia, USA).
Estimation of Current Densities Using LORETA
For each subject the EEG signals were aligned with the force onset and then averaged across trials. The averaged EEG data were baseline corrected using baseline data from -3000ms to -2500ms (time 0 indicates force onset). Subsequently, an independent component analysis (ICA) was applied to the data. Only the main components (signal-to-noise ratio > 1) were chosen for the source reconstruction. A 3-layer (conductivities of the scalp and brain: 0.033S/m, and the skull: 0.0042S/m) triangle-node boundary element model (BEM) [18, 19] based on the MNI (Montréal Neurological Institute) brain MRI was used to overlay the sources. Distributed current density model (LORETA) with L1 norm method was applied to the ICA-preprocessed data. In addition, the sources were constrained to the reconstructed layer of the folded cortex with 6926 nodes using a rotating model [Curry user guide, 1999, 11].
Current Density Data Analysis - Post Processing
Source localization was analyzed at 21 different time points (-2200ms, -2100ms, -2000ms,-1000ms, -900ms, -800ms, -700ms, -600ms, -500ms, -400ms, -300ms, -200ms, -100ms, 0ms, 100ms, 200ms, 500ms, 800ms, 1000ms, 2000ms, 2500ms and 3000ms) throughout the planning,
execution, and sustaining phases of the handgrip muscle contraction in each subject. The current density at each location was averaged across subjects. Since each source needed to be identified at its anatomical location under Talairach coordinate for further analysis, several steps were taken to transform CurryV4.5 coordinate to Talairach coordinate. First, transformation of the SPM99/ MNI (X,Y,Z) coordinates from the Curry coordinates (x,y,z) was obtained as follows (the MNI image dataset has a 1.8-mm voxel size in Curry V4.5, while the MNI brain originally had a voxel size of 2 mm):
X = (120 mm - x) * 2 / 1.8
Y = (102 mm - y) * 2 / 1.8
Z = (z – 100 mm) * 2 / 1.8
Second, transformation of the SPM99/ MNI coordinates (X, Y, Z) to the Talairach coordinates (X', Y', Z') was performed: (http://www.mrc-cbu.cam.ac.uk/Imaging/Common/mnispace.shtml)
Above the anterior commisure (AC) (Z >= 0):
X'= 0.9900X
Y'= 0.9688Y +0.0460Z
Z'= -0.0485Y +0.9189Z
Below the AC (Z < 0):
X'= 0.9900X
Y'= 0.9688Y +0.0420Z
Z'= -0.0485Y +0.8390Z
Third, after establishing the position of each source on the Talairach coordinate, the anatomical label was obtained through the Talairach Daemon search for each source location. Thus, all the current densities in the Brodmann’s area 6 (premotor [PM] and supplementary motor area [SMA]), area 4 (primary motor cortex [M1]) and areas 1, 2 and 3 (primary sensory cortex [S1]) were identified and vector-averaged. (We chose the three Brodmann’s areas based on their well known role in regulating muscle activities.) The overall averaged current densities of these three major sensorimotor areas at time = -2200ms, -2100ms and -2000 ms were used as the normalization factor for each subject. The purpose of this normalization was to reduce the confounding effects of possible wide variation of global neuronal activity among subjects. Finally, the current density at each time point was normalized by this normalization factor for further statistical analysis.
Statistical Analysis
This study represented a randomized nested design, in which each observed curve was classified according to the factor “subject” and factor “area” of the subject. The nature of the experimental data was such that the curves of current density (CD) by various Brodmann’s areas can be different, but the difference is not expected to be systematic in terms of area. Thus “subject” and “area” are considered to be nested classification factors. Since eight subjects were randomly chosen, random-effects terms needed to be associated with the “subject” factor and with the “area” factor nested within a subject.
To model the nonlinear pattern of the source strength variation, a mixed-effects polynomial regression model [20] for the CD data with respect to the “time” covariate and “area” factor was considered. We used random-effects for the intercept, linear term and quadratic term at the subject level and a single random effect for the intercept at the area within subject level. This setting allowed the overall pattern to vary between subjects not only in the CD peak location but also the curvature at the peak. The difference between areas for the same subject is a shift in the intercept. Akaike information criterion (AIC) [21] was used for modeling selection and to determine the order of the polynomial function in the regression model. It turned out that the fourth order polynomial function was adequate to model the nonlinear pattern of the source strength over time.
If CD of the jth area was written on the ith subject at the kth time point as yijk, i=1,…, 8; j=1,…, 5; k=1, …, K, the final model being fit can be expressed as
where bi,0, bi,1, bi,2 are random effects terms (following normal distributions with unknown variance parameters) associated with subject factor, bij is the random effects term associated with area factor nested within subject factor. εijk are random noise in the model. Maximum likelihood (ML) approach with a ridge-stabilized Newton-Raphson algorithm approach [22] was used to fit our specified model. ANOVA F tests [22] were constructed based on the mixed models to test “area” effect and time trends at the 0.05 significance level.
RESULTS
Fig. (1) shows the normalized and averaged (based on the 8 subjects) current density (CD) reconstruction maps in the primary motor cortex (M1), primary sensory cortex (S1), premotor cortex (PM), and supplementary motor area (SMA) at different time points before and after the force onset. It is clear that the EEG source strength (CD) in the cortical areas progressively increased from the early preparation phase to the movement execution phase, especially for the M1 and S1 regions. The CD in the SMA increased earlier during the preparation and localized predominantly in the left frontal lobe.
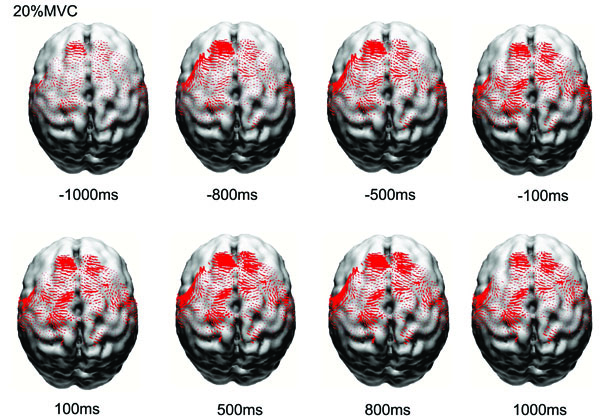
Reconstructed normalized and averaged cortical currents at 20% maximal voluntary contraction force of 8 subjects at eight time points from early preparation to holding phases of the handgrip task. The size of the red dots is proportional to the local current density. Only currents in motor related cortical area (left M1, left S1, PM&SMA, right M1, right S1) are shown here. The current density exhibited nonlinear alterations throughout the motor control process.
Fig. (2) shows the normalized source strength calculated at all time points in the left M1, left S1, the PM and SMA (calculated bilaterally), right M1, and right S1. The CD in all the areas began to rise early from ~1000ms before the force onset, peaked at the force onset, and then drifted downward afterwards. During the entire time course, the left M1 and S1 exhibited greater source strength compared with the other areas and source strength of the M1 and S1 showed a tendency to rise again 500ms after force onset.
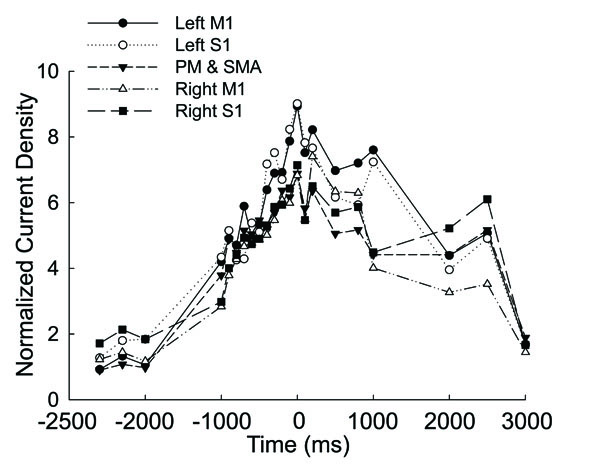
Averaged and normalized current density plotted as a function of time in the motor related cortical area (left M1, left S1, PM&SMA, right M1, right S1) in 8 the subjects at 20% maximal voluntary handgrip force. Time ‘0’ is the force onset. Negative time values indicate time points before force onset.
The mixed model provides us with the flexibility of modeling not only the mean structures of our data but their variances and covariances as well. Specified random effects at different levels allowed us to fit a specific curve for each subject at each area within a unified model. Here we used normalized time when the model was fitted (i.e. 0<t<1). Analysis of covariance had been applied to the mixed model for “source strength” as it relates to both a classification factor (area) and to a continuous covariate (time). To make it easier to assess the differences between areas, we used “left M1” representing an “overall mean” or reference level and other four areas representing changes to the reference level.
Table 1 displays the statistical results of analysis of covariance based on the mixed-effects polynomial regression model. The "Time" variable was normalized into the interval [0,1] in the model fitting. The p-values were presented for global fixed effects over all subjects. It is noted that all terms of polynomial coefficients were significant. Since the factor “area” was a categorical variable that had five categories, the “left motor” area was set as the baseline and its estimate and standard error were zeros. The ANOVA test for the factor of “area” was not significant with a p-value = 0.7255. These results indicated that there was no statistical difference in source strength among the areas but the strength changed significantly over time in a nonlinear function (Fig. 3). Fig. (3) shows the original data and fitted curves for each area within each subject from the mixed model. The model included random effects from both subject level and area level; hence, individual curves can be fit with common fixed effects. In the figure, each column represents the case of one subject and each row represents the case of one area. For example, column 1 from the left presents subject 1’s source strength-time curves in the 5 areas with the subject1/area1 being the curve for area 1 (left M1) and subject1/area5 for area 5 (PM&SMA). It was noted that, although the 8 subjects had different curve shapes, the general patterns of the curves were similar and the peaks of the curves located consistently near the force onset time (~time 0) for all the cases.
Analysis of Covariance Based on the Mixed-Effects Polynomial Regression Model. The "Time" Variable was Normalized into [0,1] in the Analysis. The p-Values Based on ANOVA F Tests are Presented for Global Fixed Effects Over all Subjects
| Estimate | Sth Error | p-value | ||
|---|---|---|---|---|
| Intercept | 1.10577 | 0.70643 | 0.0224 | |
| Time | -11.49543 | 6.81269 | <.0001 | |
| Time^2 | 120.15607 | 21.14488 | <.0001 | |
| Time^3 | -191.55915 | 31.6776 | <.0001 | |
| Time^4 | 84.28151 | 15.9606 | <.0001 | |
| Area | Area1: Left M1 | 0 | 0 | 0.7255 |
| Area2: Right M1 | -0.92206 | 0.85077 | ||
| Area3: Left S1 | 0.05944 | 0.85077 | ||
| Area4: Right S1 | -0.50936 | 0.85077 | ||
| Area5: PM&SMA | -0.70075 | 0.85077 | ||
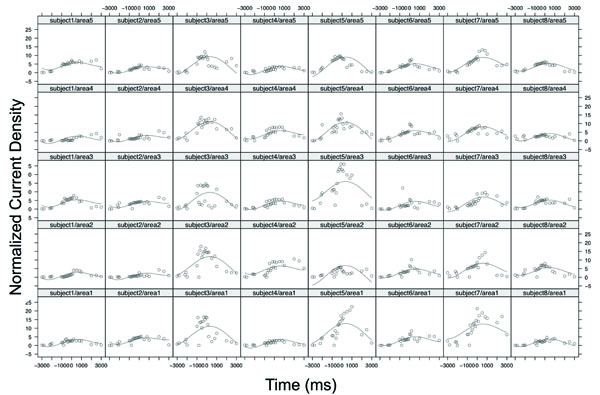
The original data and fitted curves for each area within each subject from the mixed-effects polynomial regression model. Each column represents the case of one subject and each row represents the case of one area. Area 1, area2, area3, area 4, and area5 denoted the left M1, right M1, left S1, right S1, and PM and SMA, respectively. For example, the sub-plot subject5/area3 denotes the case of subject 5 with area3: Left S1.
DISCUSSION
This study found that source strength (measured by current density [CD]) of scalp EEG signals during voluntary handgrip was time-dependent. The source increased almost linearly from about 1000ms before and peaked at the force onset in a number of motor function-related cortical areas; the patterns of the time-dependent variation of the CD were similar among the cortical regions.
Time-Dependent Source Strength Variation in Controlling a Voluntary Handgrip
Our results indicated that from as early as 1 s before the force onset the source strength had elevated in cortical regions examined (Fig. 1, 2 and 3) and peaked near the time of force onset. Cortical activation at early times may be more related to attention and general preparation of a voluntary motor action [23]. At early stages of motor preparation, perhaps only a limited number of neurons are involved in the task, and the activation level might not critically depend on the force exerted [24-29]. As the time approaches motor task initiation, more activities related to specific programming and execution of the task occur and this may require progressively more cortical neurons to participate and increase their activation levels. This postulation is supported by the almost linear increases of the source strength from -1000ms to the force onset (time 0, Fig. 2). The observation of the source strength at the highest level around the force onset could be contributed by participation of neurons that executed the handgrip and neurons whose role involved in modulating the grip force. Cheney [30] suggested that about 100ms before the EMG onset, force-magnitude modulation, known as increasing discharge rate and/or recruitment of more neurons, might have been established. About 100ms or more after the EMG onset, this modulation is further adjusted so that the cortical activity increases according to the level of force generated by the muscle. In summary, the high levels of cortical activation during the time window of ±100ms movement onset are highly likely to be related to specific motor task programming, execution, force modulation, and perhaps as well as multi-level sensory feedback reaching to the motor cortices [30].
During the later phase of the holding period (~200ms after the force onset), the source strength began to decline in all the analyzed areas (Fig. 2, Fig. 3). The reduction in the cortical activity during the holding phase could be a result of ceasing activation of the neurons involved in motor action programming and execution. Many cortical cells increase discharge rate before the force onset but most of these neurons were silent during the period of holding the force. For example, more than 60% of the recorded cells in monkey SMA and cingulated cortex were phasically active before onset of finger force but only about 10% of the neurons were tonically active during the holding phase of the force task [31]. In addition, motor neurons in the spinal cord adapt to lower firing rate after initial high-frequency activation [32] and this adaptation could also occur in cortical neurons [33], which may as well explain weakening of the source strength during later phase of the force holding.
Similar Source Strength Variation Time Courses among the Cortical Regions
All the examined regions showed time-dependent source strength changes during the control process of the muscle contraction. The left M1 and S1 exhibited stronger current density (CD) during almost the entire time course (Fig. 2), which was expected because the handgrip occurred on the right side. An interesting observation was that although the level of the CD seemed to differ among the cortical areas, the pattern of the source strength variation in the time course was very similar, that is all the areas exhibited a reversed “V-shape” CD time course (Fig. 2). This was confirmed by the statistical F-test that all terms of polynomial coefficients for the nonlinear current density time course were significant while the ANOVA test for the factor of “area” was not. Previous animal studies involving single-cell recording reported that the M1 is primarily for controlling movement execution variables, such as the amount of force to be exerted by the muscle [1, 30] and direction of the force production [34]. The M1 also encodes higher functions, such as movement programming and preparation [35]. The S1 is known to participate in handgrip force control [36] and provide sensory information to M1 during voluntary motor actions [37]. The SMA has been shown to be important in programming sequential finger movements [38], storing information necessary for the orderly performance of multiple movements of the arm [39], and bimanual coordination [40, 41]. The PM is considered to contribute to the selection of motor actions on the basis of visual cues [42, 43]. The monotonic relationship between cell activity and muscle output holds for different areas in the motor cortex in a series of single-cell animal studies with slightly different experiment paradigms [1, 44-46]. Specifically, the M1 and PM cortices share the same force-firing rate pattern [46]. Two populations of neurons (phasic-tonic firing and tonic decreasing firing) in the M1 and PM cortex have been found to be related, either positively or negatively, to force output in a more recent study [47]. The relationship between the pyramidal tract neurons and force output was monotonic over only a small portion of the force range [45]. In summary, all the examined areas play important motor function, which is underscored by their contributions to the cortricospinal tract (CST), a fundamental pathway for voluntary actions of extremity muscles (one third of the CST is contributed by the M1, one third by the PM and SMA, and the remaining one third by the S1 [48]).
One limitation of the single-cell recording in animal models, however, is the difficulty to investigate activities of multiple cells in multiple cortical regions concurrently. Thus, it is not well known, from the animal data, the integrated activation patterns of multiple brain areas. This limitation can be overcome by modern neuroimaging techniques and abundant observations have suggested high degrees similarities in activation patterns of many sensorimotor function-related cortical areas. For example, neuroimaging data have shown a proportional relationship between the levels of muscle and activation, and this relation is similar among many cortical regions [6, 36, 49, 50]. A number of studies have reported muscle fatigue-related brain activation alterations and a prominent finding by these studies was that the cortical signal changing pattern was very much alike among many sensorimotor regions [4, 5, 17]. The human neuroimaging data support the observation of similar source strength time courses among the cortical areas in the current study and suggest synchronized parallel functions among multiple sensorimotor centers.
Compared with previous findings of EEG source signals generated during higher levels of handgrip contractions, the relative source strength (CD) of the SMA and PM (relative to CD of M1 and S1) was greater for the 20% MVC of the current study than relative source strength of the SMA and PM at higher levels of handgrip [51]. It is not clear why this was so but it could be that fewer cells in the primary sensorimotor areas need to be activated to plan, execute and maintain a low level of muscle contraction but the level of activation in the SMA and PM may not change as much across degrees of muscle contraction.
In conclusion, the results show that the level of cortical activity in controlling a voluntary motor action is time-dependent with the highest activity occurs around the action onset. The low-to-high-to-low source strength pattern from the preparation to execution and to holding phases is similar among several major sensorimotor areas, suggesting synchronized parallel functions among them. The findings also indicate that the current density reconstruction technique based on surface EEG recorded during voluntary motor activities has adequate time and spatial resolution to detect the time-dependent source strength in various brain regions.
ACKNOWLEDGEMENTS
This work was supported by research funds of Department of Physical Medicine and Rehabilitation at the Cleveland Clinic

