All published articles of this journal are available on ScienceDirect.

Combining Graph and Machine Learning Methods to Analyze Differences in Functional Connectivity Across Sex
Abstract
In this work we combine machine learning methods and graph theoretical analysis to investigate gender associated differences in resting state brain network connectivity. The set of all correlations computed from the fMRI resting state data is used as input features for classification. Two ensemble learning methods are used to perform the detection of the set of discriminative edges between groups (males vs. females) of brain networks: 1) Random Forest and 2) an ensemble method based on least angle shrinkage and selection operator (lasso) regressors. Permutation testing is used not only to assess significance of classification accuracy but also to evaluate significance of feature selection. Finally, these methods are applied to data downloaded from the Connectome Project website. Our results suggest that gender differences in brain function may be related to sexually dimorphic regional connectivity between specific critical nodes via gender-discriminative edges.
INTRODUCTION
The analysis of fMRI resting state (R-fMRI) data has recently emerged as a powerful tool for neuroimaging research. The fact that brain R-fMRI reveals low-frequency fluctuations (<0.1 Hz) that are temporally correlated across functionally related areas [1-4] implies that it can be used to interrogate multiple brain networks with no prior hypothesis. Graph theory is one of the main approaches employed to evaluate R-fMRI brain network connectivity [5, 6]. Following seminal work describing small world [7] and scale-free networks [8] in the late 1990s, an increasing amount of efforts has been dedicated by the neuroimaging community to characterize the topology of functional [9-13] and anatomical [14-16] brain networks.
A common procedure to generate R-fMRI brain networks consists of the following steps: 1) normalization; 2) motion correction; 3) dimension reduction by parcellation of the brain using an atlas; 4) averaging the time signal across grey matter voxels contained in each region; 5) regressing out nuisance variables (motion correction parameters, white matter, CSF and global signal) and 6) low pass filtering of the resulting fMRI time series. The set of network nodes is defined by the number of regions contained in the specific parcellation of the brain. The edges are estimated using some measure of associations between each pair of regions such as the Pearson correlation coefficient.
After the correlation matrix containing all these pair-wise correlations has been estimated, building the network requires a threshold to define the set of connected edges of the network. The usual practice is to repeat the graph theory analyses for different choices of the threshold or other criteria that aim at keeping some feature of the network constant across subjects, such as network cost [10], average degree [13] or characteristic path length [17]. However, it is not clear that an optimum approach exists.
We use machine learning methods to perform group analyses of R-fMRI brain networks avoiding the threshold selection problem mentioned above. The central idea is to use the full set of correlations as input variables for a large scale classification algorithm. Our work is related to previous research developed by [18-20] who implemented different feature selection techniques to locate discriminative graph edges (correlations) when analyzing R-fMRI and block design fMRI data respectively. We used here two different ensemble methods: 1) Random Forests (RF) [21] and 2) a new ensemble method based on least angle shrinkage and selection operator (lasso) regression.
RF has several properties that explain its increasing popularity in bioinformatics [22-28]: 1) it can be used when there are more variables than observations; 2) RF can deal with two class and multi-class problems; 3) it does not overfit; 4) RF can handle mixtures of categorical and continuous variables; 5) RF contains a built-in cross-validation method using out of the bag (OOB) samples and 6) it provides continuous measures of importance rather than binary responses.
Additionally, we introduce here an ensemble method based on lasso regression that takes advantage of lasso’s sparsity property [29] for embedded feature selection. Previously, ensembles of ridge regression and least square classifiers based on subsampling have been proposed and applied to different problems [30, 31]. We also propose an index for scoring the importance of a variable, which is a natural consequence of lasso’s sparsity property. Since lasso regression forces many coefficients to be zero for each individual classifier, the frequency with which each variable is contained in the model across all members of the ensemble can be computed and taken as a measure of its relevance. This is a similar concept as the relevance counts proposed by [32]. The main differences are: 1) they computed the scores of relevance during the testing phase of a two-fold CV, a process that they repeated 100 times while we here computed the scores based on subsampled versions of the data set and the ensemble learning approach; 2) they were working on penalized logistic regression while we are using penalized linear regression and 3) we use a very efficient implementation of lasso regression based on the coordinate descent technique provided by the GLMNET library [33, 34] that allows the full data space computations to be performed in a time-efficient manner. This allows us to implement permutation testing to determine significance not only of classification accuracy but also of the selected features.
Differently from previous work we don’t use any feature reduction steps prior to classification, such as univariate filtering [18, 19], but we operate directly with the entire input space (the full set of correlations). We applied these two methods to resting state data from the Connectome Project [35] in order to study differences in functional connectivity across sex. Gender differences are thought to exist across a variety of cognitive domains, and have been demonstrated consistently in studies investigating sexual dimorphism of cognitive ability during performance of specific tasks [36-38]. For example, superior performance has been reported in women on tasks of verbal fluency and emotion-oriented memory [39-43], whereas superior performance has been reported in men on tasks of mental rotation and visuospatial ability [44-46]. Such task performance may reflect innate gender differences in the functional organization of the brain, and have been the focus of investigations evaluating asymmetries in functional cerebral organization between males and females using a variety of neuroimaging techniques, including PET, SPECT, and task-related blood-oxygen-level dependence (BOLD) fMRI [47]. In particular, gender-associated differences in brain activation have been reported in frontal, temporal, parietal, occipital, and thalamic regions, as well as in insular and cingulate cortex, using multiple different fMRI paradigms [48-54]. Unlike these prior studies investigating task-specific gender differences in functional brain activity, the present study is one of a few to date that aims to evaluate key differences between males and females in brain network connectivity, and is the first to identify specific gender-discriminative edges and their associated nodes.
MATERIALS AND METHODOLOGY
Resting State Data
Participants
R-fMRI BOLD data were acquired from the 1000 Functional Connectome Project (http://www.nitrc.org/projects/ fcon_1000) (FCP), which is a publicly accessible database [35]. Specifically, data from 148 subjects (74 female and 74 male; matched by age (21 years old) recruited as part of larger studies conducted in Beijing China were used. Subjects were reported to be healthy and without history of head injury, psychiatric or neurological disorder [55, 56]. All subjects provided written informed consent approved by the Institutional Review Board of the State Key Laboratory of Cognitive Neuroscience and Learning, Beijing Normal University [55, 56].
MRI Scanning
The 148 Beijing FCP subjects were scanned in a Siemens 3.0 Tesla Trio MR scanner for collection of T1-weighted structural anatomic (MP-RAGE) MRI and resting-state fMRI-BOLD data. Resting state fMRI was acquired using echo planar imaging (EPI) (TR = 2000 ms; TE = 30 ms; field of view = 200 x 200 mm2; matrix size = 64 x 64, 33 axial slices, 3 mm thickness, 0.6 mm gap; voxel resolution = 3.125 mm × 3.125 mm × 3.6 mm). The subjects performed no task, but were asked to keep their eyes closed for the 7.5 minute R-fMRI scan [55, 56].
Image Processing
All data were motion-corrected and normalized to a standard template using the version 8 of the statistical parametric mapping software(SPM8) [57]. The structural T1-weighted images were segmented into grey matter and cerebrospinal fluid (CSF) using the SPM8 new segment tool. Segmentation maps were resampled to the space of the normalized functional MRI data for use as masks in the post-processing. Preprocessing included regression of motion parameters, nuisance signals (white matter and ventricular mean signal from the segmentation maps) and global signal, followed by band-pass filtering at 0.01 - 0.1 Hz to isolate the low-frequency fluctuations characteristic of resting connectivity. Data was then parcellated into 116 regions using the Automatic Anatomical Labeling (AAL) atlas [58], as implemented by the wfu_pickatlas [59] and masked with the grey matter segmentation map to limit the nodes to grey matter structures. This resulted in an averaged fMRI time series of 116 regions (nodes) for each subject, which was used for subsequent connectivity analysis. To establish the presence of functional connectivity between the parcellated regions (nodes), the Pearson correlation was computed between all pairs of node time series to generate a 116 x 116 correlation matrix (Cij) for each subject.
Classification of Brain Networks
The classification of R-fMRI brain networks problem can be formulated as the detection of discriminative edges between two groups of weighted brain networks. For each subject the set of nodes is defined by the different brain regions of interest (ROIs) from the specific parcellation (AAL atlas in our case) and the edge weights are given by the pair-wise Pearson correlation coefficients between brain regions (average R-fMRI signal) contained in the correlation matrix. Because this matrix is symmetric the feature vector (or sample) corresponding to each subject will be composed of the correlations contained in the upper triangle of the subject’s correlation matrix that are extracted and vectorized. The matrix of predictors is formed by stacking the feature vectors corresponding to all individuals participating in the analysis. Each subject is also assigned a label identifying the participants’ sex. This information is then provided to the software implementing the two classifiers.
Random Forests
RF belongs to the category of the so called ensemble methods for classification because a committee of learners (trees in this case) is generated and each one casts a vote for the predicted label of a given instance. The trees are built using the classification and regression trees methodology (CART) [60]. In constructing the ensemble of trees, RF uses two types of randomness: first each tree is grown using a bootstrapped version of the training data. A second level of randomness is added when growing any given tree by selecting a random sample of predictors at each node to choose the best split. The number of predictors selected at each node and the number of trees in the ensemble are the two main parameters of the RF algorithm. The RF developers have reported that the method does not require much tuning of these parameters and that the default values often produce good results for many problems [21]. Once the forest is built, assigning a new instance to a class is accomplished by combining the trees using majority vote. As a result of using a bootstrap sampling of the training data, around one third of the samples are left out when building each tree. These are the so called out-of-bag (OOB) samples that can be used to assess the performance of the classifier and also to build measures of importance. In this work we will use the permutation importance score. The importance of a variable is evaluated by estimating the increase in prediction error occurring when the OOB data for that variable is permuted while others are left unchanged. The necessary calculations are carried out tree by tree as the random forest is constructed [61]. We used the R package randomForest [61] with the default parameters for the number of trees (ntree = 500) and the number of predictors analyzed at each node to find the best split ().
Lasso Regression
Lasso regression was introduced by replacing the L2 penalty typical of Tikhonov regularization and ridge regression [62, 63] by a L1 penalty [29]. Lasso regression in our case is described by
where N is the number of samples (148 subjects in our case), xi ∈ Rp is the ith sample or feature vector containing the correlations entering the analysis (all elements of the upper triangle of the correlation matrix), yi ∈ {-1,1} is the ith label (-1 female and 1 male), M = 116 is the number of nodes (from the AAL atlas parcellation), is the number of correlations (edges), β0, β are the parameters of the model, and λ is the regularization parameter. Lasso is characterized by its sparsity meaning that many of the coefficients will be forced to be zero performing this way a kind of embedded feature selection.
We solve the problem described in Eq. (1) using the GLMNET library [33, 64] which uses a very efficient optimization technique called coordinate descent [65]. This regularization scheme initially developed for regression can be adapted to binary classification problems by using the classification rule ŷ = sign(fitted value) where ŷ is the estimated label [66, 67].
Estimation of Regularization Parameter λ
To estimate the optimal values of the regularization parameter we combine a scheme of two nested cross-validations (CV) with grid search to avoid upward bias in the estimation of accuracy [68-71]. We implemented an external K1-fold CV where at each step we leave one fold for testing and the K1-1 remaining for training and validation. These last two procedures are implemented by using a nested K2-fold CV. We divide the K1-1 folds into K2 folds and we leave one fold for validation and K2-1 for training combined with a grid search to determine the optimal parameters. The grid we used in our analyses was λ = 1000, 500, 200, 150, 125, 100, 10, 1, 0.1. At each grid point the classifier is trained using the training data and its performance is assessed using the fold left for validation by estimating the classification accuracy. We select the regularization parameters that produce maximum average accuracy across the K2 folds of the internal CV procedure. The classifier is then retrained using the whole data in the K1-1 folds left for training and validation and the selected optimal regularization parameters. The classifier’s generalization capability is then evaluated by computing the classification accuracy using the fold originally left for testing in the external CV. This is repeated K1 times and the average classification accuracy is computed and reported in our figures. Finally, the classifier weights are computed using the whole data set and the average values of the selected regularization parameters across the K1 folds. In our analyses we used K1= 5 and K2= 5.
Ensemble of Lasso Regression Classifiers
We build our ensemble by training Nc lasso regression classifiers according to the methodology presented above (Eq. (1), CV procedure, etc) using for each member of the ensemble a subsampled version of the data. The subsampling is carried out by selecting at random from each class the same number of samples. This means that the number of classifiers included in the ensemble (Nc) and the fraction of subsampled samples (FS) are parameters of this algorithm. There are two sources of randomness associated with this ensemble: 1) Random subsampling and 2) Random partition of the subsampled data to carry out cross-validation. We use the average classification accuracy across the Nc classifiers as a measure of performance of the ensemble. Building ensembles with sparse classifiers allows us to introduce importance measures for each variable based on the sparsity property. Given a set of Nc sparse classifiers composing the ensemble we can compute the frequency that each variable enters the model across the Nc members of the ensemble. We used this frequency as an importance score for the variable. Additionally, we compute the mean values of the coefficients associated with each edge across the members of the ensemble. The sign of the coefficients mean value associated to each edge (correlation) allows us to determine the edges associated to classification as men or women.
Permutation Testing
Our implementation of the ensemble is based on a very time efficient methodology allowing us to implement permutation testing. In the neuroimaging literature, permutation testing is often used to assess significance of classification accuracy [72-74]. Here we also use it to evaluate significance of feature selection by combining it with the importance score of each variable. Briefly, we recompute the ensemble Np = 1000 times with permuted labels. In each case we keep track not only of the values of the classification accuracy but also of the maximum values of the importance scores. The latter permits us to evaluate the significance of the observed scores and of the selected features. We use similar permutation tests to perform feature selection and to evaluate the significance of the results produced by the RF analysis. Specifically, we use the permutation importance score [21] to evaluate significance of feature selection.
Software and Hardware Platforms
Our software implementation is based on MATLAB in which the GLMNET library is called using a freely available MATLAB wrapper developed by Hui Jiang (http://www-stat.stanford.edu/~tibs/glmnet-matlab/). The computations were performed on a DELL computer system with eight 2.66 GHz CPUs and 16 GB of RAM memory. Parallel programming based on the MATLAB parallel computing toolbox was used to speed up computations.
RESULTS
Since the number of classifiers in the ensemble and the fraction of the samples used during subsampling are additional parameters of the ensemble of lasso regression classifiers (ELRC), before carrying out the final analysis of our data we explored the performance of the algorithm for different values of these two parameters (Fig. 1). The best performances in terms of the average classification accuracy are achieved when all the samples (FS = 1) are used to estimate each member of the ensemble (Fig. 1, left panel). The number of classifiers in the ensemble seems to have little influence on the final result, which approximates 62%. Additionally, the sparser set of selected features also correspond to the choice of FS = 1. In this case for all values of Nc, the number of selected features (edges) was the same.
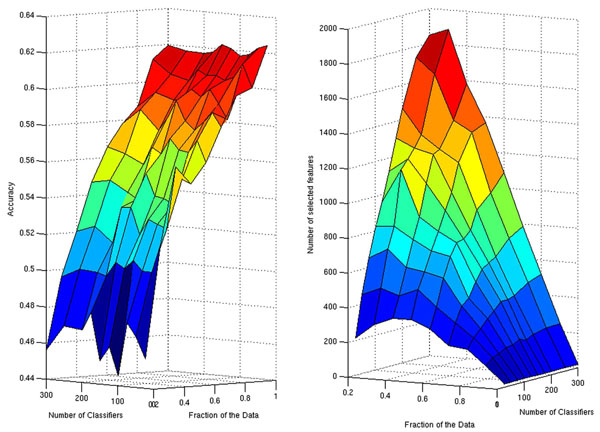
Surface plots displaying the resulting classification accuracy (left panel) and the number of selected features (right panel) for different choices of the number of classifiers and the fraction of the data to be subsampled.
For the final analysis of the R-fMRI data set we fixed Nc = 100 and FS = 1. The observed overall average accuracy was 62.3% computed as the average classification accuracy across the members of the ensemble. The permutation test of the overall classification accuracy and the importance scores for the variables were both significant at p<0.001 and p <0.05. The discriminative edges associated with classification as women and men are described in Tables 1 and 2, respectively. The brain regions (nodes) associated with the discriminative edges in women (upper row) and men (bottom row) are shown in Fig. (2). The RF analysis produced 65.4% classification accuracy which was significant (p<0.001) using a permutation test. A permutation test applied to permutation importance RF scores produced a total of four discriminative edges (p<0.05). The list of these edges is presented in Table 3 and the related anatomical areas are shown in Fig. (3). Because RF is a highly nonlinear classifier it is not possible to provide the information about the association of discriminative edges and sex.
Nodes Connecting Discriminative Edges Associated with Classification as Female According to the ELRC Analysis
| AAL Nodes Numbers | Brain Area 1 | Brain Area 2 | |
|---|---|---|---|
| 2 | 92 | Frontal_Superior Left | Cerebellum_Crus1_R |
| 28 | 53 | Rectus_R | Occipital_Inf_L |
| 31 | 38 | Cingulum_Ant_L | Hipoccampus_R |
| 33 | 78 | Cingulum_Mid_L | Thalamus_R |
| 33 | 112 | Cingulum_Mid_L | Vermis_6 |
| 70 | 75 | Paracentral_Lobule_R | Pallidum_L |
Nodes Connecting Discriminative Edges Associated with Classification as Males According to the ELRC Analysis
| AAL Nodes Numbers | Brain Area 1 | Brain Area 2 | |
|---|---|---|---|
| 3 | 52 | Frontal_Superior Left | Occipital Mid R |
| 12 | 74 | Frontal_Inf_Oper_R | Putamen_R |
| 14 | 31 | Frontal_Inf_Tri_R | Cingulum_Ant_L |
| 23 | 87 | Frontal_Sup_Medial_L | Temporal_Pole_Mid_L |
| 33 | 57 | Cingulum_Mid_L | Postcentral_L |
| 33 | 58 | Cingulum_Mid_L | Postcentral_R |
| 35 | 104 | Cingulum_Post_L | Cerebellum_8_R |
| 40 | 56 | Parahippocampal_R | Fusiform_R |
| 43 | 91 | Calcarine_L | Cerebellum_Crus1_L |
| 43 | 92 | Calcarine_L | Cerebellum_Crus1_R |
| 45 | 68 | Cuneus_L | Precuneus_R |
| 110 | 111 | Vermis_3 | Vermis_4_5 |
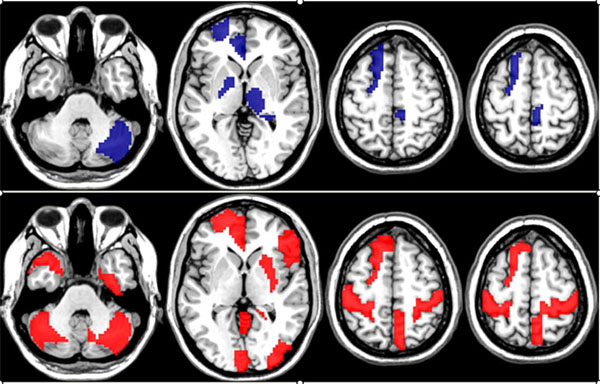
Network nodes (brain regions) associated with the more discriminative edges generated by the ensemble of lasso regressors method.
Top row: nodes related to the discriminative edges associated with classification as female (blue color). Bottom: nodes related to the discriminate edges associated with classification as males (red color).
Nodes Connecting Discriminative Edges Produced by RF Analysis
| AAL Nodes Numbers | Brain Area 1 | Brain Area 2 | |
|---|---|---|---|
| 33 | 58 | Cingulum_Mid_L | Postcentral_R |
| 40 | 56 | Parahippocampal_R | Fusiform_R |
| 43 | 94 | Calcarine_L | Cerebellum_Crus2_R |
| 48 | 91 | Lingual_R | Cerebellum_Crus1_L |
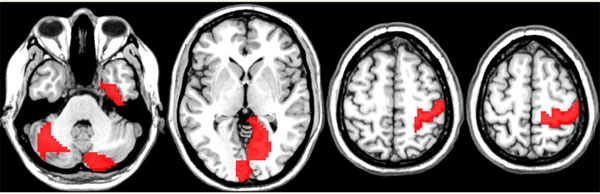
Network nodes associated with discriminative edges using Random Forest Analysis. No additional information regarding the nature of the associations is provided by the RF analysis. In red color are shown the nodes associated to discriminative edges that were significantly (p < 0.05 corrected) relevant for classification in general.
The nodes connecting discriminative edges in women localized to the cingulate gyrus, left frontal lobe, deep grey structures (basal ganglia, thalami), and right cerebellum. In men, these regions localized predominantly to the cingulate gyrus, as well as bilateral sensorimotor cortices, bilateral cerebellum, and left frontal lobe.
DISCUSSION
In this work we have applied two different ensemble classification methods to analyze differences in functional connectivity across gender. RF is a well know technique in bioinformatics while the ELRC has been introduced here. This last approach combines the sparsity property of lasso regression with the concept of ensemble learning. The former will perform feature selection by forcing many predictors’ coefficients to be zero while the latter will allow defining importance scores for each variable by estimating the frequency of its appearance across all the models defining the members of the ensemble. These machine learning methodologies allow performing group analyses of brain networks without previous selection of thresholds.
The final result in both cases is a set of edges that carry discriminative information between the two groups of networks. In the case of the ELRC we used a very fast implementation of lasso regression provided by the library GLMNET that allowed us to use permutation testing not only for assessing the significance of accuracy but also for the importance of selected features.
The results produced by both methodologies were consistent in terms of the levels of classification accuracy and statistical significance. While the levels of classification accuracy were very similar the statistical significance of the results in both cases was the same. Despite very different underlying mechanisms, both methods detected common edges and nodes as more discriminative which are the more robust findings in this study. Our results suggest that the ELRC detected more discriminative edges than RF. Simulations necessary to confirm this finding were out of the scope of this work, as they are very time consuming and our focus was mainly on finding sex differences in R-fMRI brain networks. In addition, ELRC provides useful information about the association of the detected edges to classification as male or female. But this is a general advantage of linear classifiers over non-linear ones. Very often non-linear classifiers in high dimensional problems do not produce improvements while being at the same time more difficult to interpret because the linear classifiers generate weights for each predictor that can be used as a measure of their importance within the estimated model [72, 75]. Because RF is a highly non-linear classifier it does not provide this type of information.
There are some limitations in the ELRC methodology. There is a lack of a method to select optimal values of the number of classifiers of the ensemble (Nc) and the fraction of samples used to generate each member of the ensemble. This is a common problem with previous approaches [30, 31]. Here via trial and error we have chosen the value of the fraction of samples that leads to higher values of average overall accuracy computed across all members of the ensembles. This amounts to performing lasso regression Nc times with different CV partitions.
Although RF is a highly nonlinear classifier and, therefore, unable to provide information about the association of discriminative edges and sex, many of the discriminative edges identified using this technique overlap with discriminative edges associated with classification as male according to the ELRC analysis. Specifically, both the RF and ELRC methods identify key discriminative edges between: 1. left middle cingulum and right postcentral gyrus, 2. right para-hippocampal gyrus and right fusiform gyrus, as well as, 3. left calcarine fissure and right crus of the cerebellum (Tables 2 and 3). These gender-discriminative differences are consistent with findings described in other studies investigating sexual dimorphism of network connectivity using graph theoretical methods [76, 77]. Wang and colleagues demonstrated lower nodal efficiency in females compared to males in the left middle cingulum and right parahippocampal gyrus. In addition, Tian and colleagues identified the left middle cingulate gyrus as an important hub node in males and females [77]. The ELRC method identified additional nodes connected by gender discriminative edges in the present investigation that correspond to nodes that Wang et al., demonstrated to have gender-associated differences in efficiency, including frontal (left middle frontal gyrus), temporal (right superior temporal gyrus), and limbic/paralimbic regions (left hippocampus, right hippocampus, and left amygdala) [76]. It is possible that gender-related differences in nodal efficiency [76] may reflect sexually dimorphic variability in the nodes with which they connect, as demonstrated in the present study (Tables 1 and 2). It is possible that differences in functional connectivity between males and females may also be related to gender-related differences in regional connectivity between hub nodes [77].
In the present study, males demonstrated a greater proportion of gender-discriminative edges associated with sensory, motor and association regions than females, which may be related to known male gender performance differences in visuospatial tasks [44-46]. As compared to males, females demonstrated a greater proportion of gender-discriminative edges associated with limbic regions, although both males and females had discriminative limbic-associated edges. In particular, there were distinct differences between males and females in specific limbic areas associated with gender-discriminative edges. For example, males but not females had a discriminative edge associated with the posterior cingulum and parahippocampal gyrus, which are known to be involved in visuospatial processing and formation of spatial memories, respectively [78, 79] (Tables 1 and 2). Interestingly, men have demonstrated greater BOLD activation than women in posterior cingulum and parahippo-campal gyrus during performance of visuospatial navigation fMRI tasks [80, 81] .
Other limbic areas, such as the anterior and middle cingulum, were identified in the present study as important nodes transmitting discriminative edges in both males and females (Tables 1 and 2). Edges associated with the anterior and middle cingulum may be gender-discriminative because of the nodes with which they connect, which differ between males and females. For example, the anterior cingulum, known to be involved in affect processing [78], is connected by a gender-discriminative edge to the right hippocampus in females, but to the triangular inferior frontal gyrus in males (Tables 1 and 2). Similarly, the middle cingulum, which is known to be involved in response selection [78], is connected by gender-discriminative edges to the vermis and right thalamus in females, but to the left and right posterior-central gyrus in males (Tables 1 and 2). It is possible that these gender-associated differences in anterior and middle cingulate connectivity may contribute to known differences in cingulate BOLD activation associated with emotion-processing tasks between men and women that are correlated with fMRI task performance [82-84].
Taken together, these data suggest that gender differences in brain function may be related to sexually dimorphic regional connectivity between specific critical nodes via gender-discriminative edges. Furthermore, such differences may be related to performance advantages of females on tasks such as verbal memory and selective attention [39-43], and males on tasks of mental rotation and visuospatial ability [44-46]. More work is necessary, however, to further investigate these possibilities.
CONCLUSION
We have applied machine learning methodologies to the analysis of functional connectivity based on resting state fMRI. These methods can analyze weighted brain networks and detect the specific set of edges that are informative for differences between groups of brain networks. When applied to R-fMRI data from a group of normal males and females, we were able to identify gender-discriminative edges that may be related to sexually dimorphic regional connectivity between specific critical nodes. Such methods may be more broadly applied in the future to identify discriminative edges in the brain for between-group differences that have important clinical implications.
CONFLICT OF INTEREST
None declared.
ACKNOWLEDGEMENTS
We thank Susan Shear for computer programming support. This work is funded in part by the NIH Supplement # HHSN268200464221C added to the N01-WH-4-4221 grant.

