All published articles of this journal are available on ScienceDirect.

Is 1 Hz rTMS Always Inhibitory in Healthy Individuals?
Authors Info & Affiliations
Abstract
1 Hz repetitive Transcranial Magnetic Stimulation (rTMS) is considered to have an inhibitory effect in healthy people because it suppresses the excitability of the motor or visual cortex that is expressed as an increase in the motor or the phosphene threshold (PT), respectively. However, the underlying mechanisms and the brain structures involved in the action of rTMS are still unknown. In this study we used two sessions of simultaneous TMS-functional magnetic resonance imaging (fMRI), one before and one after, 15 minutes of 1Hz rTMS to map changes in brain function associated with the reduction in cortical excitability of the primary visual cortex induced by 1 Hz rTMS, when TMS was applied on the occipital area of healthy volunteers. Two groups were evaluated, one group composed of people that can see phosphenes, and another of those lacking this perception. The inhibitory effect, induced by the 1 Hz rTMS, was observed through the increase of the PT, in the first group, but did not lead to a global reduction in brain activation, instead, showed change in the activation pattern before and after rTMS. Conversely, for the second group, changes in brain activation were observed just in few brain areas, suggesting that the effect of 1 Hz rTMS might not be inhibitory for everyone and that the concept of inhibitory/excitatory effect of rTMS may need to be revised.
INTRODUCTION
TMS over the motor cortex activate corticospinal pathways and transiently delay motor programming [1], whilst its delivery to the occipital cortex incites light sensations, called magnetophosphenes or phosphenes [2, 3]. The minimum TMS intensity required to do so is defined as the PT that can be used to quantify changes in excitability in the visual cortex [4, 5]. Short trains of magnetic stimuli (two to five) seemingly induce the perception of phosphenes in all volunteers, but the success of inducing it with a single pulse TMS is highly variable [6].
Several studies demonstrated the importance of the frequency of stimulation in determining whether the effect of rTMS in the cerebral cortex is facilitatory or inhibitory. In healthy subjects, low frequency rTMS (1 Hz) suppresses the excitability of the motor [7] or visual cortices [4], expressed as an increase in the motor or the phosphene threshold, respectively, which last for more than 10 minutes; however, high frequency rTMS (5-20 Hz) enhances cortex excitability [8].
Conversely, in some patients, low frequency rTMS enhances cortical excitability; for example, in those who have migraine, 1 Hz rTMS has a facilitatory effect in the occipital [9] and motor [10] areas, suggesting the possible failure of inhibitory circuits that cannot be up-regulated by low frequency rTMS .
Although previous measurements of motor and phosphene thresholds showed that 1 Hz rTMS in healthy population depresses the excitatory cortical neurons, thereby suggesting a subsequent reduction in activation of inhibitory interneuron, the effects of rTMS on regional cerebral blood flow (rCBF) vary, as assessed by positron emission tomography (PET). An increase in rCBF was reported both after 10 [11] and 1 Hz rTMS [12] in control subjects, while in depressed patients, the rCBF over the left prefrontal cortex increased after 20 Hz rTMS, but fell after 1 Hz rTMS [13], showing that the inhibitory/excitatory effect induced by low/high frequency rTMS is not conclusive. Therefore, more studies are needed to understand the correlation between changes in motor and phosphene thresholds, when low/high frequency rTMS is applied, and the induced functional changes in the associated brain structures, finally clarifying the meaning of inhibition/excitation of these brain areas.
In this study, we evaluated the effect of 1 Hz rTMS, when it is applied over the occipital area, in a group of healthy volunteers, by measuring the PT and brain activation maps obtained with simultaneous TMS-fMRI before and after the rTMS exposure (experiment design: TMS-fMRI – 1 Hz rTMS – TMS-fMRI). We aimed to map the effect of 1 Hz rTMS in the entire brain by measuring blood oxygenation level dependent (BOLD) changes in people who experience phosphene, and those who lack this perception, during two fMRI sessions acquired while a very low frequency TMS paradigm was applied. We expect that, in those individuals who are able to perceive phosphene, brain activation would be lowered, after 1 Hz rTMS, since the rise in PT indicates a local inhibition of the stimulated neurons, therefore, suggesting a local reduction of brain sensitivity for TMS stimulus that would decrease the propagation of it in interconnected areas, however for those who lack this perception reduction/increase in brain activation might not be observed, since the effect of rTMS stimulus is not evident, besides, in this group TMS stimulus activate/deactivate a different network, as observed in our previous work [14].
METHODS
Subjects
Ten non-smoking healthy adult volunteers (8 males; 2 females; ages 31 ± 8 years) participated in this study. All subjects were screened carefully to ensure that they met the study’s inclusion criteria: age 18 – 40 years, ability to read and speak English fluently, and right-hand dominance. Subjects were excluded if they were taking any medication other than vitamins (or contraceptives), had any history of chronic medical/neuropsychiatric illnesses or drug use/dependence (a positive urine toxicology screen on study day was exclusionary), had any contra-indicated metallic objects in the body or claustrophobia. The Institution Review Board (IRB) at Stony Brook University approved the study protocol, and each participant signed the IRB’s approved informed consent form.
Neuropsychological Battery
A short battery of neuropsychological tests was administered before and after all TMS sections (the two TMS-fMRI interleaved with 1 Hz rTMS) as recommended in the TMS guidelines for rTMS studies [15]. The battery was comprised of the Mini-Mental State Examination (MMSE) [16] for the assessment of general intellectual functioning, Stroop color-word test [17] for the assessment of inhibitory control, controlled word association (COWA) test [18] (using words beginning with letters F or C and animals, fruits and vegetables as semantic category) for the assessment of initiation, retrieval and set maintenance verbal abilities, and profile of mood state (POMS) [19] to assess level of depression, anger, fatigue, anxiety, happiness (scale: -3 to 3; as observed and self-reported). We also administered the Automated Neuropsychological Assessment Metrics (ANAM) [20] tests of simple reaction time (RT – measure of motor response time), 2-choice RT (assess the capacity for mental set shifting), match to sample (assess matching delay), code substitution (assess learning and delayed memory), and Sternberg 4-choice (assess memory search).
TMS-fMRI and 1 Hz rTMS Experiment
Each Subject Underwent Two Session of TMS-fMRI Interleaved by One Session of 1 Hz rTMS (TMS-fMRI – 1 Hz rTMS – TMS-fMRI). In both TMS-fMRI sessions (TMS-fMRI follows the procedure from our previous study [14]), the stimulus intensity was based on individuals’ PT inside the MRI scanner that was set before the first TMS-fMRI run; for subjects unable to perceive phosphene the stimulator was fixed at 40%, that is based on the PT measured for the first subject able to perceive phosphene under 4 Tesla [14]. The stimulus paradigm, for each TMS-fMRI session, was a block design consisted of three 30-second “REST” epochs interleaved with three 28-seconds “TMS” epochs; during the latter, the pulse was applied with a frequency of 0.25 Hz interleaved, after 300 ms, with fMRI acquisition[14]. Subjects pushed a button, with their right hand, every time they saw “flashes of light” [14]. For the rTMS session, the volunteer was pulled out from the scanner but remained supine on the scanner’s bed with their eyes open; the 1 Hz rTMS was applied for 15 minutes with an intensity that was set for the PT at that position, for those able to perceive phosphene; for those unable to perceive it, the stimulator was set at 60%, which was based on the PT measured for the first subject able to perceive phosphene at that position. Thereafter, the person was pushed back into the scanner and the PT was re-evaluated before the second TMS-fMRI run.
All fMRI were acquired in a 4 Tesla Varian/Siemens MRI scanner (TE/TR=20/2000 ms, 4 mm slice thickness, 1 mm gap, typically 33 coronal slices covering the whole brain, 64x64 matrix size, 3.125 mm in- plane resolution, 90o-flip angle, 94 time points; within 2s of TR, the image was acquired in 1.7 s, i.e., 0.3 s after the previous image acquisition) [14]. Data pre-processing and statistical analysis was done in SPM2, as described in our previous work [14]. All time series were motion-corrected to the first volume using 6 degrees of freedom (3 rotations, 3 translations). For Talairach normalization, the individual scans were matched to a standard reference brain of the same contrast, using a voxel size of 3 x 3 x 3 mm3. Time series were then spatially smoothed with an 8 mm Gaussian Kernel. Fixed-effects group analysis was used in this study, due to the small number of subjects in each group (5 in each); the activation maps were calculated for the entire group using a generalized linear model (GLM - fixed-effect analysis). The design matrix was generated by a boxcar reference function, and its derivative convolved with the canonic hemodynamic response function (HRF). The time series were band-pass filtered with a high-pass filter (cut-off frequencies: 1/128Hz), and an HRF as low-pass filter [14]. The results are presented in the figure and tables, where clusters with at least 10 voxels and p < 0.05 (FWE) were considered significant [21].
RESULTS
During data analysis the subjects were divided in two groups, group 1 are those who have phosphene sensation and group 2 are those who lack this perception. However the results for the neuropsychological tests were obtained joint both groups, since the phosphene perception is not relevant for this analysis.
Behavioral data: The PT was evaluated at the center of the MRI scanner before and after the 1 Hz rTMS session; PT values for group 1 showed an average increase of 25% in the threshold due to the inhibitory effect of 1 Hz rTMS (Fig. 1). Accordingly button press frequency, obtained during both TMS-fMRI sessions (before and after 1 Hz rTMS), and showed an average decrease of 15% for the second TMS-fMRI session, when compared with the first one, as a result of the reduced phosphene perception.
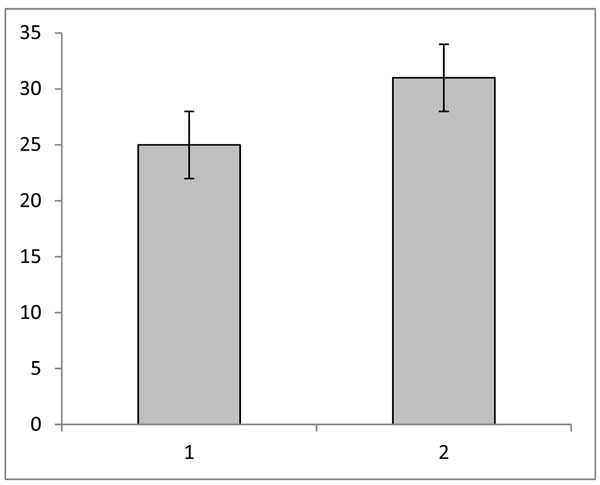
Average phosphene threshold (PT) for group one, 1) before 1 Hz rTMS, and 2) after 1 Hz rTMS; the vertical axis shows the values for the PT as the TMS intensity displayed at the TMS equipment (range: 0 -100%); the error bars are the standard errors.
Neuropsychological test: Results from paired T-tests (before vs. after all TMS sessions) for both groups (group1 + group 2) did not show any significant change at the nominal p < 0.05 threshold. Although the Mini-Mental State Examination results showed a trend towards a significant score (p = 0.052), values were inside the normal range for both runs (27-30).
Brain activation: The results illustrated in Fig. (2) and given in the (Table 1) compare brain activation induced by TMS before (B) and after (A) 1 Hz rTMS. The fixed-effects analysis revealed a significant differential BOLD signal for the comparison B > A for group 1 (perceive phosphenes) at the following locations: occipital lobe (cuneus, lingual gyrus, middle occipital gyrus), parietal lobe (precuneus), frontal lobe (middle, medial, and superior frontal gyrus, precentral gyrus, frontal eyes-field [22], sub-gyrus), cerebellum (anterior lobe/culmen, posterior lobe/cerebellar tossil), limbic lobe (parahippocampal gyrus, anterior cingulate), brainstem (midbrain) and sublobar insula. For the condition B < A, we noted significant differential BOLD signal at the following brain areas: occipital lobe (fusiform and lingual gyrus), parietal lobe (precuneus and sub-gyrus), frontal lobe (prostcentral and precentral gyrus, superior and inferior frontal gyrus, sub-gyral), cerebellum (cerebellar tossil), temporal lobe (superior and middle temporal gyrus, sub-gyrus), sub-loba.r (insula, caudate). Conversely, for group 2 (unable to see phosphenes), the differential BOLD signal for the comparison B > A was significant only at the occipital lobe (lingual gyrus); when comparing B < A there were significant effects at the frontal lobe (precentral gyrus) and parietal lobe (precuneus).
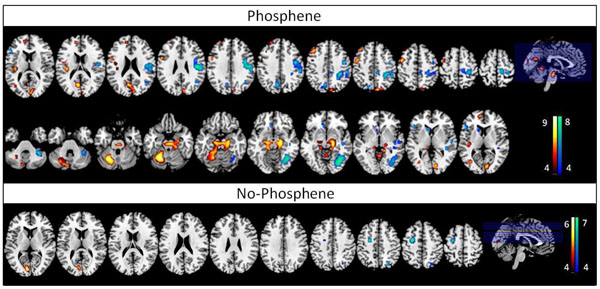
Differential statistical maps showing the brain areas where the BOLD signal is significant (FEW pcorr<0.05 minimum number of pixels = 10) for the comparison of B>A (red-yellow – regions inhibited by rTMS), and B<A (blue-green – regions excited by rTMS) (B=before 1 Hz rTMS, A=after 1 Hz rTMS) for each group, T ≥ 4.57 (FEW, p < 0.05), voxel size ≥ 10; the bars show the T-score values.
The Table Shows the Significant Clusters Presented in the Figure for the Comparisons B>A and B<A (B=before 1 Hz rTMS, A=after 1 Hz rTMS) for Both Groups, T ≥ 4.57 (FWE, p < 0.05), Voxel Size ≥ 10
| Brain Region | Talairach Coordinates | Cluster Level | Voxel Level | |||
|---|---|---|---|---|---|---|
| (x, y, z)[mm] | No. of voxels (pcorr< 0.02) | (T-Score) | ||||
| Phosphene: Before 1Hz rTMS < After 1 Hz rTMS | ||||||
| L, anterior lobe, culmen | -23 | -55 | -23 | 725 | 8.6 | |
| R, Brainstem, midbrain | 19 | -20 | -8 | 7.61 | ||
| R, limbic lobe, parahippocampal gyrus (BA 28) | 19 | -14 | -16 | 6.78 | ||
| L, limbic lobe, posterior cingulate (BA 31) | -7 | -65 | 17 | 144 | 7.47 | |
| R, occipital lobe, lingual gyrus | 7 | -81 | 2 | 6.35 | ||
| R, occipital lobe, cuneus (BA 18) | 7 | -82 | 21 | 5.47 | ||
| L, frontal lobe, precentral gyrus (BA 6) | -43 | -6 | 52 | 39 | 7.18 | |
| R, parietal lobe, precuneus | 9 | -81 | 40 | 32 | 6.42 | |
| R, parietal lobe, precuneus | 18 | -79 | 40 | 5.45 | ||
| L, frontal lobe, middle frontal gyrus (BA 8) | -38 | 22 | 46 | 36 | 6.31 | |
| L, posterior lobe, cerebellar tonsil | -26 | -51 | -36 | 10 | 5.85 | |
| L, anterior lobe, culmen | -1 | -52 | -3 | 19 | 5.84 | |
| L, sub-lobar, insula (BA 13) | -35 | -26 | 17 | 43 | 5.83 | |
| L, frontal lobe, medial frontal gyrus | -9 | 48 | 17 | 34 | 5.61 | |
| L, frontal lobe, medial frontal gyrus | -12 | 44 | 27 | 5.08 | ||
| L, frontal lobe, precentral gyrus (BA 6) | -51 | 2 | 28 | 28 | 5.6 | |
| L, frontal lobe, sub-gyral | -40 | -9 | 22 | 10 | 5.31 | |
| L, occipital lobe, middle occiptal gyrus | -35 | -67 | 5 | 21 | 5.26 | |
| L, frontal lobe, superior frontal gyrus | -24 | 40 | 43 | 16 | 5.03 | |
| L, frontal lobe, medial frontal gyrus | -29 | 40 | 35 | 4.78 | ||
| Phosphene: Before 1Hz rTMS < After 1Hz rTMS | ||||||
| R, occipital lobe, fusiform gyrus | 35 | -60 | -9 | 214 | 7.86 | |
| R, occipital lobe, lingual gyrus (BA 18) | 29 | -71 | -7 | 7.57 | ||
| R, frontal lobe, postcentral gyrus | 40 | -21 | 27 | 536 | 7.81 | |
| R, frontal lobe, precentral gyrus | 40 | -11 | 44 | 7.4 | ||
| R, parietal lobe, sub-gyral | 29 | -42 | 41 | 6.98 | ||
| R, posterior lobe, cerebellar tonsil | 35 | -43 | -34 | 62 | 7.02 | |
| L, parietal lobe, precuneus (BA 7) | -10 | -67 | 33 | 55 | 6.26 | |
| L, parietal lobe, precuneus (BA 7) | -16 | -73 | 40 | 5.06 | ||
| R, temporal lobe, superior temporal gyrus (BA 22) | 49 | -14 | 4 | 12 | 6.16 | |
| R, frontal lobe, superior frontal gyrus (BA 6) | 12 | -5 | 63 | 19 | 6.16 | |
| L, frontal lobe, inferior frontal gyrus (BA 45) | -48 | 20 | 13 | 34 | 6.09 | |
| L, frontal lobe, sub-gyral | -9 | 27 | -1 | 14 | 5.73 | |
| R, sub-lobar, insula (BA 13) | 41 | -21 | -5 | 16 | 5.37 | |
| R, temporal lobe, sub-gyral | 38 | -33 | 4 | 14 | 5.32 | |
| R, parietal lobe, precuneus | 7 | -37 | 44 | 15 | 5.28 | |
| R, temporal lobe, middle temporal gyrus (BA 39) | 43 | -60 | 21 | 18 | 5.05 | |
| L, sub-lobar, caudate | -15 | 15 | 11 | 13 | 5.02 | |
| No- Phosphene: Before 1Hz rTMS > After 1Hz rTMS | ||||||
| L, occipital lobe, lingual gyrus | -7 | -81 | 5 | 28 | 5.82 | |
| No- Phosphene: Before 1Hz rTMS < After 1Hz rTMS | ||||||
| L, frontal lobe, precentral gyrus | -27 | -12 | 59 | 6.87 | ||
| L, frontal lobe, precentral gyrus (BA 4) | -27 | -27 | 20 | 5.54 | ||
| R, parietal lobe, precuneus (BA 7) | 23 | -70 | 11 | 5.17 | ||
DISCUSSION
The effect of 1 Hz rTMS over the primary visual cortex was evaluated by using the simultaneous TMS-fMRI combination. Brain functional response induced by TMS stimulus over the occipital area and associated with phosphene perception was obtained before and after an rTMS session and compared. The results revealed a different pattern of brain activation before and after 1 Hz rTMS for the group able to see phosphene; however, for those who lack this perception, significant increase/decrease in brain activation occurred in few brain areas, after the rTMS train, showing an overall no significant change in brain activation.
Results from our previous work showed a connection between the stimulus site (left cuneus) and the left parietal lobe and left frontal-eye-fields for those who see phosphene [14]; thus, the observed increase in the PT, induced by 1 Hz rTMS, that indicates an inhibitory effect on the cortical area, would suggest that there was a decrease in brain activation in these areas after the rTMS session. However, the comparison of the statistical maps before and after the rTMS run shows decrease in brain activation after rTMS at the right cuneus, right parietal, and left FEF instead. Reduction in brain activation was also observed in the medial frontal gyrus (motor area) and right brainstem (midbrain), a part of the brainstem that has a conduit function for eyes input (superior colliculus) [23] and motor coordination (the red nucleus) [24]; therefore decrease in brain activation in these areas is explained by the reduced phosphene sensation induced by 1 Hz, that led to reduced button press frequency. Finally, the overall change in the brain activation pattern in this group indicates that low frequency rTMS has a significant effect in their brains, but it cannot be considered completely inhibitory.
The group unable to see phosphene showed a significant reduction of brain activation after 1 Hz rTMS just in one brain area, the lingual gyrus at the occipital lobe, and increase in brain activation just in two brain regions, the precentral gyrus at the frontal lobe, and precuneus at the parietal lobe. This points to an inhibitory effect near the stimulation site (left cuneus), but opposite effect on the parietal and frontal lobe, suggesting that low frequency rTMS cannot be considered inhibitory for this group. In fact, their lack of phosphene sensation and the non-significant changes in brain activation after the rTMS session indicate that TMS does not have a major effect on brain function in this group. Accordingly, rTMS might not be a good treatment procedure for this population.
In this study, we also evaluated whether any unwanted persistent effects on behavior/cognition might be induced during the TMS sessions, for safety purpose only, since it is recommended at the guidelines for rTMS use [15]. The results from the neuropsychological tests demonstrated, as expected, that there were no detrimental effects on behavior/cognition induced by either the low frequency rTMS session or the two simultaneous TMS-fMRI sessions, suggesting that this type of study can be safely used in healthy adult volunteers.
Low frequency rTMS (1 Hz) has shown to increases motor [7] and phoshene [4] thresholds when applied for 15 minutes in a group of healthy individuals over the motor or occipital cortices, respectively; therefore suggesting an inhibitory effect in these areas. Based on these findings, low frequency rTMS has been applied in other brain regions to induce inhibition of those brain areas. However, our results, employing imaging to monitor the effect of 1 Hz rTMS in the brain of healthy individuals, show that, although an increase in PT suggests its inhibitory effect at the stimulus site, such an effect may not be true for other brain regions.
Moreover, for those people unable to see phosphene reduction in cortical excitability cannot be verified, since PT cannot be measured and change in brain activation occurred just in few brain regions. Of course, our results are based on a small number of volunteers and future studies, with a larger number of participants, are needed to replicate and validate these preliminary results. In particular, changes in the lateralization in the insula and cerebellum activations, as a result of rTMS, need to be clarified. Nevertheless, this work demonstrated the value of using simultaneous TMS-fMRI or even the combination of TMS and other imaging modalities to better understand the nature of the effect of rTMS in the brain.
CONCLUSION
Brain activation obtained with the simultaneous TMS-fMRI technique, before and after applying 1 Hz rTMS over the primary visual-cortex area, of individual who perceive phosphene, revealed that such low-frequency rTMS suppresses activity in some areas of their brain but increases it in others; conversely, similar procedure applied in a group of people lacking this perception failed to induce significant change in brain activation in most brain areas. Thus, even though we showed that applying 1 Hz rTMS decreased cortical excitability in group 1 when evaluated through measuring the PT, its inhibitory effect was not clear in terms of brain activation; furthermore, the non-significant effect in the group 2 shows that low frequency rTMS might not be inhibitory for everyone. Overall, this preliminary results question the concept of inhibitory effect of 1 Hz rTMS and shows that more studies combining TMS and imaging are needed to better understand the effect of TMS in the brain.
CONFLICT OF INTEREST
The author confirms that this article content has no conflicts of interest.
ACKNOWLEDGEMENT
This work was supported by the Laboratory Directed Research and Development Program of Brookhaven National Laboratory (LDRD-BNL), National Institutes of Health (GCRC MO1-RR-10710-06S1) and U. S. Department of Energy (DOE -OBER).
“Notice: This manuscript has been authored by Brookhaven Science Associates, LLC under Contract No. DE-AC02-98CHI-886 with the U.S. Department of Energy. The United States Government retains, and the publisher, by accepting the article for publication, acknowledges, a world-wide license to publish or reproduce the published form of this manuscript, or allow others to do so, for the United States Government purposes.”

