All published articles of this journal are available on ScienceDirect.
Long-Term Monitoring of Post-Stroke Plasticity After Transient Cerebral Ischemia in Mice Using In Vivo and Ex Vivo Diffusion Tensor MRI
Abstract
We used a murine model of transient focal cerebral ischemia to study: 1) in vivo DTI long-term temporal evolution of the apparent diffusion coefficient (ADC) and diffusion fractional anisotropy (FA) at days 4, 10, 15 and 21 after stroke 2) ex vivo distribution of a plasticity-related protein (GAP-43) and its relationship with the ex vivo DTI characteristics of the striato-thalamic pathway (21 days).
All animals recovered motor function. In vivo ADC within the infarct was significantly increased after stroke. In the stroke group, GAP-43 expression and FA values were significantly higher in the ipsilateral (IL) striatum and contralateral (CL) hippocampus compared to the shams. DTI tractography showed fiber trajectories connecting the CL striatum to the stroke region, where increased GAP43 and FA were observed and fiber tracts from the CL striatum terminating in the IL hippocampus.
Our data demonstrate that DTI changes parallel histological remodeling and recovery of function.
INTRODUCTION
Stroke is associated with a spontaneous degree of functional recovery. In the experimental field, different mechanisms have been described depending on plastic reorganization of the infarct and peri-infarct areas [1, 2], on axonal sprouting [3, 4] and on migration of immature neurons into the peri-infarct cortex [5, 6]. Currently, experimental post-stroke recovery studies are performed using invasive techniques such as tracer labeling [3, 4] and post-mortem histo-molecular analysis of specific plasticity related proteins like GAP-43, a membrane-bound protein found in the axonal growth cones of sprouting CNS axons [7-9].
Magnetic Resonance (MR) Diffusion tensor imaging (DTI) [10, 11] is a non invasive imaging modality which detects the microscopic translational motion of water molecules in tissue, is sensitive to various cellular changes and tissue abnormalities and permits the quantitative evaluation of gray and white matter pathology. The two most commonly used indices of water diffusion in tissue are the magnitude, expressed as the apparent diffusion coefficient (ADC) and the directional dependence of diffusion (diffusion anisotropy [12]) , often expressed as the fractional anisotropy (FA) [13]. ADC is affected by the diffusivity of the water molecules and by the microstructure of the tissue. FA describes the degree of functional anisotropy of the tissue which is be influenced by a number of factors including the degree of myelination, density, diameter, distribution and orientational coherence of the axons as well as the diffusion barriers presented by the glia [14]. Therefore, FA provides an indirect maker of the microstructural properties of the white matter (WM). ADC, combined with other DTI parameters like FA, has been shown to stage and predict ischemic brain injury over its temporal evolution [15]. DTI methodology has recently been used for the characterization of micro and macroscopic reorganization in nervous system tissues [16]. Its importance is essentially based on the opportunity to non-invasively understand brain micro-structural properties and map cerebral connectivity during health and disease states.
In vivo DTI of rodent models of cerebral ischemia is technically challenging [17], due to the small size of the brain and the fact that mice are vulnerable to environmental stress and have a low tolerance for extended periods of anaesthesia (required for MRI). Moreover, models requiring craniotomy or invasive approaches, which disrupt the skull’s integrity, are not ideal for rapid acquisition MRI methods such as echo planar imaging (EPI) because of the MR image artifacts associated with EPI diffusion tensor imaging [18].
Conversely, DTI of fixed tissue has the advantage of allowing extremely high spatial resolution, compared to in vivo studies, because imaging times can be very long. Following tissue fixation, ADC decreases while the anisotropy index remain unchanged [19-21]: therefore, high-resolution DTI of fixed tissue can reveal structural details that are not evident in the much lower resolution in vivo images [22, 23]. In addition, the ability of DTI to detect the direction of white matter fiber tracts within the central nervous system (CNS) enables the use of fiber tracking algorithms for tract tracing and segmentation of the white matter tracts [24, 25].
There is growing interest in studying the mechanisms that promote brain tissue plasticity after cerebral ischemia and in establishing whether these mechanisms could be exploited to potentate or accelerate post-stroke recovery. Currently, a number of pharmacological [26-28] and surgical approaches are applied to improve axonal regeneration in rodent models of experimental cerebral ischemia. Mouse models, in particular, have become important because of the increased availability of transgenic strains. Since many of these emerging therapies may eventually be used in clinical trials, it is important to investigate the use of non invasive imaging modalities such as DTI, for detection and characterization of brain tissue plasticity after stroke.
MATERIALS AND METHODS
Transient Middle Cerebral Artery Occlusion in the Mouse
All animal procedures were approved by the Subcommi-ttee for Research Animal Care of our institution (IACUC). Male ICR-CD1 mice (Harlan, Netherlands, 20-34 g) were anaesthetized and maintained under 1.5% isoflurane in 0.4 l/min oxygen and 2 l/min air (gas delivered via a face mask). Ischemia was induced by placing an 11mm silicone-coated filament (8.0 vicryl) into the common carotid artery and advancing it into the middle cerebral artery until resistance was felt i.e., it was occlusive. The filament was left in place for 30 minutes. Body temperature was maintained at 37°C± 0.5°C using a temperature control unit (Frederick Haer and Co., Brunswick, Maine, USA). Laser Doppler monitoring was not used because of imaging artefacts which would result from probe implantation into the animal’s scalp. After surgery, the surgical site was irrigated with a topical analgesic (0.1 ml Marcaine) and the incision was temporarily co-vered with iodized gauze while the suture was in situ. After removal of the suture, the incision was flushed with saline, blotted dry, closed with 4.0 suture material and an antibiotic cream was applied. During the first 3 days after surgery 0.1 mg/kg Buprenorphine was injected intramuscularly. If analgesic coverage was necessary thereafter, liquid ibuprofen (2-3 cc) was added to 1 oz of HydroGel ((gel used to nourish and hydrate the animals), Schlotterbeck Foss Company, Portland, Maine, USA)). Mice were also treated daily with 0.2 ml 5% Dextrose injected subcutaneously. Sham operated animals were subjected to the same surgical procedures, but without filament insertion.
Neurological Deficit Assessment
Neurological deficits were evaluated after recovery on the day of surgery and daily for the first 3 days. Thereafter, the animals were evaluated before the MRI scan at days 4, 10, 15 and 21 after stroke, using a simple 4 point rating system: no observable deficit 0, failure to extend the forepaw 1, circling 2, loss of circling or righting reflex 3. Intermittent circling was graded as 1.5 [29, 30].
Magnetic Resonance Imaging (MRI)
MR Measurements
All MRI experiments were performed on a 4.7T Biospec Avance scanner (Bruker BioSpin Corp., Billerica, MA, USA) equipped with 40Gauss/cm gradients.
For in vivo imaging, animals were positioned prone, and a custom built elliptical (2.0x3.0 cm) surface coil was placed on top of the head. MRI scans were acquired using a diffusion tensor echo planar imaging (EPI) sequence with the following parameters: TE 32ms, TR 5000ms, 2 b=0 images and 20 diffusion directions at b=1200s/mm2, 64x64 pixels, 16mm FOV (300 μm isotropic resolution), 20 contiguous 0.5mm coronal slices, ∆ 15.3, ∂ 2.6. Mice were imaged in vivo at days 4, 10, 15 and 21 after stroke. MRI was not performed during the acute phase in order to minimize anaesthetic stress and obtain a better survival rate.
Prior to ex vivo imaging, animals were transcardially perfused with 4% paraformaldehyde and the head was excised. The skin and extracranial tissue were removed and the brain, still within the skull, placed in formaldehyde. After one day of post-fixation in 4% PFA, brains were transferred to a 20% sucrose solution for 3 days after which they were soaked in 1mM GdDTPA in a phosphate-buffered saline solution [21]. After 21 days, the brains were suspended in Fomblin® liquid (to reduce MR susceptibility artefacts) in custom built sealed plastic tubes. A custom built 3 turn solenoid coil was used for fixed brain imaging. We employed a 3D spin-echo DTI imaging sequence using the following parameters: TR 250ms, TE 28ms, ∆ 10.4ms, ∂ 6.9ms, 20 diffusion directions at b=4000s/mm2 (100 µm isotropic resolution), NEX 1 and approximately 25 hours scan time per brain [21].
In Vivo Data Processing
Image analysis and display were performed using custom software (MRVision Co., Winchester MA, USA). The serial diffusion-tensor data were processed to generate ADC and FA maps at each scan time-point. Regional analysis was conducted (on coronal sections) using the b0 (T2-weighted image), ADC, FA maps and the following DTI thresholds; decreased ADC < 1 SD of the contralateral (CL) hemisphere and or increased ADC > 1SD of CL hemisphere (entire extent) and increased b0 (T2-weighted signal intensity) to insure exclusion of the ventricles and to account for the changing nature of the ADC/FA during the 21 day experimental course. A region of interest (ROI) defining the infarct area at different time points after stroke was delineated (using a automatic region growing tool) on each lesion containing slice. The mirror region in the CL hemisphere and an equivalent area in the sham brain (control) were also measured.
Ex Vivo DTI Tractography
DTI data were fitted to yield fractional anisotropy (FA) and apparent diffusion coefficient (ADC) maps and regional analysis was performed in the selected regions of interest (ROIs) on coronal sections (MRVision Company, Winchester, MA, USA). We performed ROI analysis (full anatomical extent of the structures on longitudinal slices) of the specific pathways involved in functional recovery after stroke on the high resolution ex vivo images. Specifically, we studied the striato-thalamic motor pathway; striatum, thalamus and the hippocampus (CA1, CA2, CA3, DG) in both the IL and the CL hemisphere.
ROIs encompassed the entire extent (within the selected slice) of the selected brain structures. In the case of the large strokes the peri-infarct (peri-lesional) tissue surrounding the ventricle was seeded. For ex vivo tractography, we used the DTIstudio software (DTI Studio, Jiang & Mori, Johns Hopkins University, Baltimore U.S.A). Tracking of the striato-thalamic pathway was performed in 6 stroke and 3 sham brains. Fiber tracts were generated using the following DTI tractography parameters: start tracking FA of 0.07, stop tracking FA of 0.04 and a turn angle of 35º.
Conventional Histology
After the ex vivo DTI scans were completed, all the brains were removed from the skull and sectioned at 40 μm in a cryostat.
Staining of Myelinated Fibers with Luxol Fast Blue
Freely floating cryostat sections were rinsed in PBS, and transferred through 70%, 80%, and 96% ethanol to a 0.1% solution of Luxol Fast Blue (Luxol Fast Blue MBSN, Solvent 38; Sigma, Deisenhofen, Germany) in 96% ethanol and 0.05% acetic acid. After staining overnight at 56°C, sections were washed in distilled water, followed by PBS, differentia-ted in 0.05% aqueous lithium carbonate followed by 70% ethanol and washed in saline before standard mounting, dehydrating, and coverslipping in Entellan.
Immunohistochemistry for GAP-43
Free floating sections were successively incubated in 20% normal goat serum, a mouse monoclonal antibody to GAP-43 (1:25000, clone 91E12; Boehringer Mannheim), and a biotinylated horse anti-mouse IgG adsorbed against rat IgG (1:250, 45 µl/10 ml; Vector Laboratories). The reaction product was then visualized using standard avidin-biotin horseradish peroxidase/diaminobenzidine methods (Vectastain ABC Kit; Vector Laboratories). Sections were mounted onto glass slides, air dried, immersed in ethanol gradients, and coverslipped. Brain sections from all animals at each time point were immunostained simultaneously. Control sections processed without primary antibody showed no specific staining.
Immunostaining data were examined on three standard coronal sections and specific regions were selected for analysis according to previous literature [31-34] (cortex and striatum: bregma 0.74-0.14 mm; thalamus, bregma 0.22 -1.06 mm; hippocampus CA1, CA3, dentate gyrus (DG): 1.46-1.60 mm). Selected areas were respectively 0.06 ± 0.01 mm2 (Mean ± SD),
Relative changes in the intensity and extent of GAP-43 IR were quantified using a computer-interfaced imaging system (Scion Image). Brain sections, stained with Luxol fast blue and the corresponding MRI images, were used to identify white matter structures and the infarcts. The optical density (OD) in a region of reliably low GAP-43 IR (the corpus callosum) was considered as the "background" value for each section and used to calculate the relative OD (rOD) for each specific region [35] (Fig. 5).
Statistical Analysis
Data were analyzed using parametric ANOVA and Tukey Kramer multiple comparison for in vivo FA and ADC data statistical analysis at the different time points and t-tests for the ex vivo FA value comparison between stroke and sham animals. Correlation between MRI data and GAP43/rOD values was performed using the Spearman r test. The following specific correlations were made; 1. the difference between IL and CL FA values (Δ FA) and 2. the difference between IL and CL GAP 43 rOD values (Δ rGAP 43), both in striatum/peri-striatal tissue and in the DG hippocampus.
RESULTS
Stroke Geographic, Composition and Clinical Characte-ristics
Eight mice with stroke in the MCA territory and three shams were followed up with in vivo imaging. Six strokes and three shams were subsequently perfusion fixed for ex-vivo brain DTI and histology. Lesion volumes and composition are provided in Table 1.
Lesions were of variable size and tissue composition. At day 4/5 post-stroke, approximately 60% of the animals showed some motor recovery and by day 21 all animals (except animal 7) had completely recovered their motor function. At 21 days the two largest strokes (brain 1 and 2, Table 1) had partly undergone cystic transformation, there was severe damage and loss of striatal tissue and severe peri-striatal damage to the external capsule and cortex. The rost-ral to caudal extent of the stroke in brain #1 is show in
(Fig. 1), same brain as in (Fig. 6) below. There was atrophy in and around the lesion area and the associated lateral ventricle was enlarged and had a rim of inhomogeneous, highly anisotropic tissue, (Fig. 1) (average FA = 0.32 ± 0.05, minimum FA of 0.13 and maximum of 0.52). In contrast the two other brains in this lesion category (3 and 7) had much less external capsule, cortical and striatal damage.
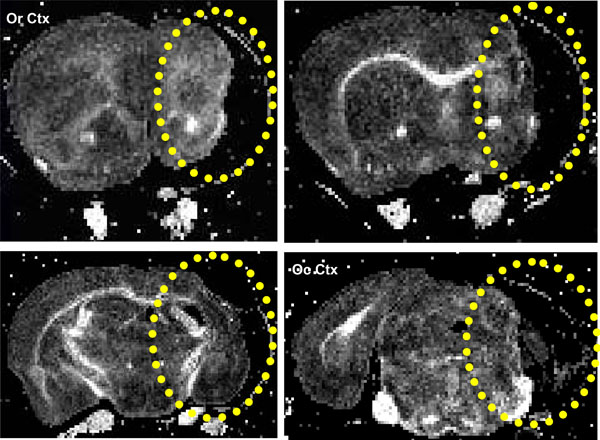
Coronal FA images showing a stroke within the striatum (yellow ellipse), same brain as in Fig. 6. The lesion extends from the rostral Corpus callosum (forceps minor, FM CC) up to an including the caudal occipital cortex (Oc Ctx) region.
In the remaining two brains (4, 5) the lesion was prima-rily within the striatum, (Fig. 2) (brain #4, Table 1 and figure 5 below). However there was also a small amount of damage to the EC (caudal region in 4 and rostral region in 5), (Fig. 2).
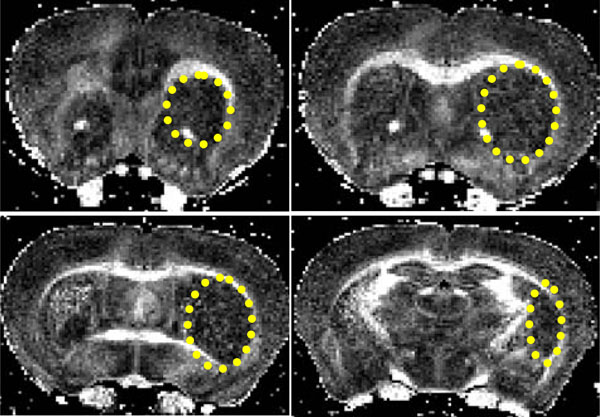
Coronal FA images showing a stroke within the striatum (yellow ellipse). The lesion extends from the rostral corpus callosum (forceps minor, FM CC) up to an including the caudal CA1 region.
Neurological scores did not differ substantially within the stroke group either in the acute or chronic phases (p=ns, Table 1). All animals first showed decreased (D 0: stroke= 29.75 ± 1.67 g, shams= 30.44 ± 0.73 g; D 4/5: stroke= 22.75 ± 3.01 g, sham= 25.3 ± 1.03 g) then increased (D21: Stroke= 32.25 ± 0.7 g, sham= 32.4 ± 1.2 g) body weight during the 21 day experimental course. However, no significant diffe-rences in mean group body weight were observed between the sham and stroke groups either before surgery or at the different time-points when MRI was performed.
In Vivo Analysis
ADC measured in the stroke area was lower than that obtained in a corresponding region in the sham brain at D4/5 (p<0.01). ADC values significantly increased over time in the stroke area (p<0.0001, Fig. 3) and values at D4/5 was significantly different from values at D9/10 (p<0.05), D14/15 (p< 0.01) and D21 (p< 0.001, Fig. 3).
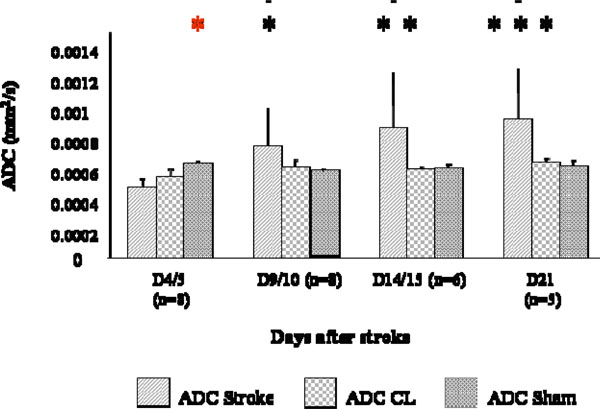
ADC changes at different time points after stroke. Measures were collected in the stroke region (ADC), in the CL mirror region (ADC CL), and a correspondent region of a sham brain bilaterally (ADC sham). ADC was lower in strokes than in shams at D4/5 (p< 0.01, *) and ADC values at D4/5 were statistically different from values at D9/10 (p<0.05, *), D14/15 (p< 0.01, **) and D21 (p< 0.001, ***).
On the contrary, FA values seemed to increase slightly from D4/5 to D21 but no significant differences were observed (Fig. 4). Also, in the CL hemisphere of the stroke animals, some fluctuations in FA values compared to the sham group were discernible but not significant.
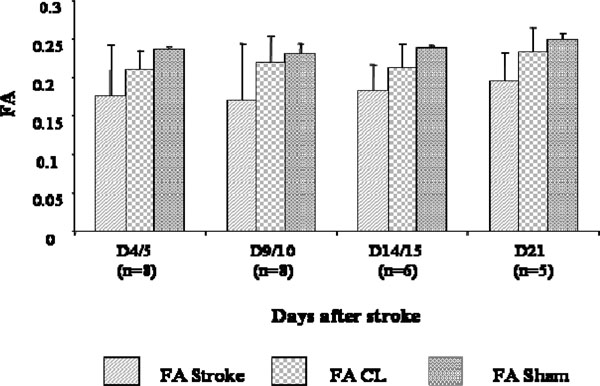
FA changes at different time points after stroke. Measures were collected in the stroke region of the lesioned hemisphere (FA), in the CL mirror region (FA CL), and in the corresponding bilateral regions of the sham brains (FA sham). No statistically significant differences were observed between FA of the stroke, CLr sham brain regions.
Ex Vivo Analysis
IL striatum and CL DG FA values were significantly different for the stroke group compared to the sham. (IL striatum stroke vs sham was 0.28 ± 0.05 vs 0.20 ± 0.04, mean ± SD, p≤ 0.005 and CL DG stroke vs sham was 0.23 ± 0.02 vs 0.25 ± 0.00 Mean ± SD, p≤ 0.05). FA values in all other ROIs considered did not reach significance. ADC data, for all the ROIs, did not show significant differences bet-ween the stroke and sham groups.
DTI Tractography
Two brains (4 and 5; Table 1) showed a peculiar fiber tract trajectory where the tracts connected the CL to the IL striatum. This fiber pattern was not observed in the sham brains (Fig. 5A, B).
Table 1. Stroke Geographic, Lesion Volume, Functional and Physiological Characteristics
| Me # | Lesion | Infact Volume (mm3) | Neuro Score | |||||||
|---|---|---|---|---|---|---|---|---|---|---|
| D4/5 | D9/10 | D14/15 | D21 | PS | D4/5 | D9/10 | D14/15 | D21 | ||
| 1 2 3 7 |
Cortex, external capsule, striatum |
94.2 90.3 21.0 18.5 |
50.0 62.0 15.8 7.5 |
56.6 59.7 14.4 7.7 |
57.3 31.3 12.9 4.2 |
2.0 2.0 2.0 2.0 |
2.0 2.0 2.0 1.5 |
1.0 1.0 1.0 1.5 |
0.0 0.0 0.0 1.5 |
0.0 0.0 0.0 1.5 |
| 8 4 |
Cortex, external capsule |
2.3 7.4 |
1.5 2.3 |
0.6 2.4 |
1.5 1.3 |
2.0 2.0 |
1.0 1.5 |
0.0 1.0 |
0.0 0.0 |
0.0 0.0 |
| 6 5 |
Striatm | 2.5 9.6 |
0.8 6.0 |
- 4.7 |
- 3.2 |
2.0 2.0 |
1.0 1.5 |
0.0 1.0 |
0.0 0.0 |
0.0 0.0 |
| Mean SD |
30.7 38.6 |
18.2 24.0 |
20.9 25.9 |
16.0 21.1 |
2.0 0.0 |
1.6 0.4 |
0.8 0.5 |
0.2 0.5 |
0.2 0.5 |
|
Me: mice; PS: post-surgery.
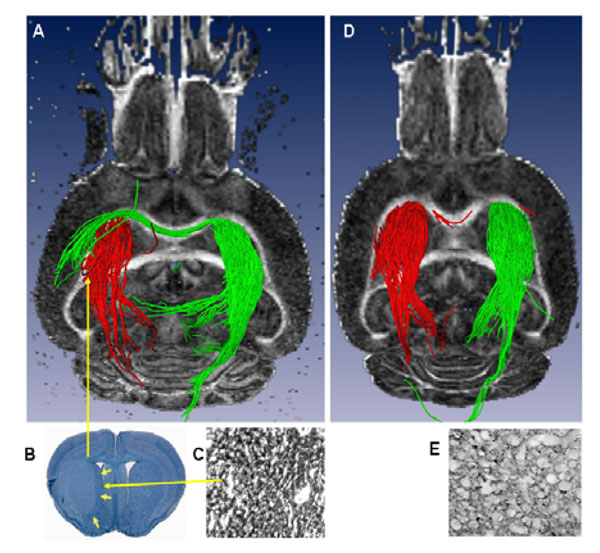
A) Ex vivo 3D DTI (axial slice, posterior view) showing the striato-thalamic tract. Red fiber trajectories originating from the stroke region in the IL striatum pass through the thalamus. Similarly, green fiber solutions from the CL striatum pass through the thalamus but also through the corpus callosum and terminate in the CL lesioned striatum. B) Luxol fast Blue-stained coronal section of the brain showing an intact thalamus with a well-demarcated striatal lesion. C) Magnified image of an adjacent coronal section showing increased GAP43 staining within the striatum. D) Sham brain showing no fiber trajectories connecting the IL and CL striatal re-gions and E) Un-lesioned thalamus showing very little (normal) GAP43 staining.
These brains had small stroke lesions with no white matter involvement. In the brains with the largest strokes (1, 2) there was essentially no discernible striatal tissue but there was a peri-lesional ring of tissue (periventricular region), which when seeded showed coherent fiber tracts connecting; 1. to the thalamus through the ventral, unaffected part of the external capsule, and 2. to the CL external capsule through the corpus callosum, (Fig. 6A). In the remaining 2 brains (3, 7), which had considerably smaller lesions but still some external capsule damage, we observed a similar pattern to that of 1 and 2 above (also not seen in the sham brains). In addition to the tracts seen above, the peri-lesional tracts (1 and 2) were also continuous through the IL anterior external capsule and the CL anterior external capsule (Fig. 6B).
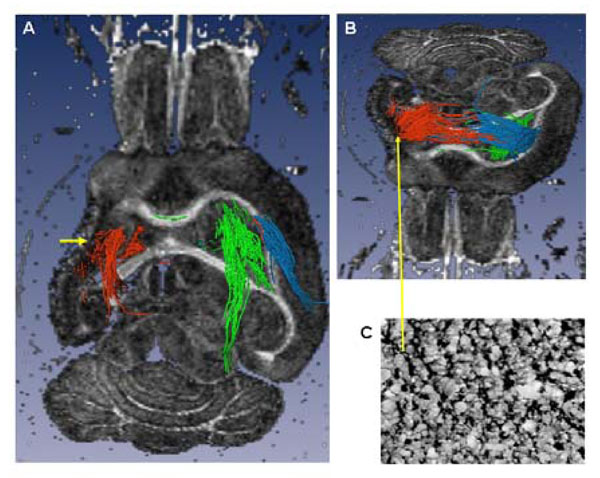
Ex vivo tractography (A axial slice, ventral view and B tilted axial slice, dorsal view) of a brain with a large lesion involving the full anatomic extent (rostral to caudal) of the striatum and cortex, and the antero-lateral extent of the external capsule (EC). A) The lateral ventricle is enlarged, there is loss of striatal, cortical (cystic) and EC tissue (short yellow arrow): the peri-lesional trajectories (red) pass through the posterior, un-involved part of the EC and through the thalamus. In comparison, the contra-lesional trajectories (green) are similar to those seen in the sham brain, (Fig. 5D). B) The dorsal peri-lesional tracts continue to the CL EC. Tracts from the dorsal CL EC (blue) are similar to those originating from the peri-lesional region. C) Tissue region within the peri-lesional tissue showing increased GAP43 expression
Seeding tracts in the hippocampal/thalamus regions showed no prominent differences in fiber trajectories (tracts constrained within these structures) between the stroke and the sham control groups.
Immunohistochemistry
GAP 43 rOD was found to be increased in IL intact striatum/peri-infarct tissue (Fig. 7A, C and Fig. 5C and 6C) of the stroke brains compared to the shams; (Stroke 1.39 ± 0.33 vs Sham 1.06 ±0.05, p<0.05, Fig. 7A). Similarly, in the CL DG hippocampus, GAP 43 rOD was increased in the stroke compared to the sham group (Stroke 1.50 ±0.29 vs Sham 1.15 ± 0.05, p<0.01, Fig. 7B).

A) GAP43 rOD between strokes and shams in the A) IL striatum and B) CL DG hippocampus. GAP 43 staining was much stronger in the stroke CL DG hippocampus of the stroke brains compared to the shams, where it is normally expressed at a low level. In the IL striatum the axon terminals are specifically stained for GAP 43 in the stroke mouse and not in the sham.
Correlation Immunohistochemistry/MRI
Spearmann regression analysis showed a significant correlation between Δ FA and Δ GAP 43 rOD in the DG hippocampus [(IL minus CL ROI) (r=0.67 p<0.05)]. On the contrary, Δ FA and Δ GAP 43 rOD were not significantly correlated in the striatum (p = 0.08).
DISCUSSION AND CONCLUSION
In this study, we applied both in vivo and high resolution ex vivo DTI to study a mouse model of cerebral ischemia, in order to detect chronic plasticity changes related to recovery of motor function.
Rodent models of stroke, especially mice, are particularly useful to study remodelling leading to functional recovery because of the availability of transgenic strains. In vivo DTI showed that ADC in the stroke area was lower than that in the corresponding region in the sham brain at D4/5 (p< 0.01) and increased significantly over time (p< 0.0001, Fig. 3). On the contrary, FA values seemed to slightly increase, but not significantly, in the chronic phase compared to the sub-acute (ns, Fig. 4) Our results are in keeping with the results from previous long term monitoring studies, in animals (especially rodents and non human primates) [36-38] and humans. [39-41].
New axon formation followed by connectivity remodeling is postulated as a mechanism for recovery of function after stroke [3, 4, 33]. At day 4/5 post- stroke, approximately 60% of the animals showed some motor recovery and by day 21 all stroke animals (except animal 7) had completely recovered their motor function. Data in rats have shown that within the first 5 days of lesion induction, hyperexcitibality develops within the tissue both surrounding and remote from the lesion, which results in the reduction in GABAergic inhibition and neuronal resting membrane potential. This peri-lesional dysfunction, which also contributes to the ensuing neurological deficit, partially resolves during the subsequent months [42]. In our study, it may be possible that hyperexcitibality in dysfunctional tissue remote from the lesion, resolves much quicker allowing return of some motor function. In addition, it is also possible that the acute motor recovery observed may in fact be due to a re-routing of function i.e., plastic reorganization of the motor cortical output [43-45]. This phenomenon has been previously described in studies of rats, which showed rapid reorganization of cortical output after facial nerve transaction [46].
In rodents, recovery due to post-stroke axonal sprouting begins at about day 3 and continues until day 14 [33]. Subsequently, synaptophysin levels begin to increase heralding the change over from growth cone formation to synapse formation i.e., creation of functional axonal circuits with recovery of sensory/motor function.
To investigate the remodeling of functional pathways associated with long-term remodeling of the brain, we studied the expression of a protein (GAP-53), expressed in the axonal growth cone of growing axons [9, 47, 48]. According to previously published data [3, 33], plasticity changes begin as late as 3 weeks after the acute ischemic event in specific areas such as the striatum, hippocampus, thalamus and cortex [31-34]. Interestingly, we found that GAP 43 was more highly expressed in the intact IL striatum and the peri-infarct tissue (p<0.05; Fig. 7) and the CL DG hippocampus (p=0.01; Fig. 7) of the stroke brains.
Our DTI analysis also showed that FA, in the IL striatum/peri-infarct tissue and CL DG, was significantly increased in the stroke brains compared to the shams.
It is possible that increased FA may represent increased fiber tract ‘representation’ in these two regions (i.e., increased axonal number and/or density). To better elucidate this finding, we used the striatum and the hippocampus as seed regions in order to perform tractography of the striato-thalamic pathway and the hippocampal circuits. Both circuits are known to be involved in functional recovery after MCAo [49, 50].
Our tractography data have shown two anomalous DTI fiber trajectory patterns which were not seen in the sham brains:
- In the brains which had small strokes (4 and 5, Table 1), we observed a strong, coherent fiber tract connecting the CL to the IL striatum (striatal to striatal fiber tracts) through the corpus callosum (Fig. 5A and B). In non human primates, it has been shown that the nuclei of the striato-pallidal system are closely connected functionally with the corresponding CL structures [51]. After focal cortical stroke, it has been previously reported that the peri-infarct cortex [3] and CL cortical areas develop new horizontal cortical connections, by axonal sprouting, within three weeks post stroke [8]. However, no data are available to date regarding sub-cortical horizontal projection after stroke. We hypothesize that the sub-cortical horizontal connections seen in our study do in fact represent post-stroke plastic changes in the brain.
- In the brains with large strokes (1, 2, Table 1), because of the extensive damage and loss of striatal tissue we observed tracts from the peri-lesional tissue which connected to the thalamus. This fiber pattern was very different from that seen in the small strokes and it is quite plausible that due to the extensive loss of striatal and cortical tissue and damage to the external capsule, the most efficient route to re-establish a thalamic connection was via the ventral, unaffected (perilesional) part of the external capsule. Again, the two brains with smaller strokes involving the same brain tissues as 1 and 2 above showed the same fiber patterns. These brains had some damage to the ventral part of the external capsule and also showed a ring of peri-lesional hyperintense (FA) tissue in the region of the subventricular zone (SVZ). The SVZ is known to be the region in which neuroblasts are born and from which they migrate to the cortex following focal cortical ischemia [52] and therefore would be the most likely region from which new sub-cortical axo-nal sprouting can occur. It is also interesting to note that, in the two very large cystic strokes where the striatum was almost completely destroyed, the peri-lesional trajectories which ran dorsally were similar to the tracts originating from the CL EC.
Previous studies have shown that there can be compensatory post-stroke sprouting in other brain regions such as striatum hippocampus and thalamus [53, 54]. However, seeding the hippocampus CA regions, the DG and thalamus, did not result in any substantial and consistent fiber tracts in any of the brains. This finding might, in fact, reflect the intrinsic limitation of the DTI technique which was unable to discriminate the intricate fiber crossings known to exist in these regions.
In both cases, we infer that the fiber tracts connecting to or crossing the IL striatum may be the anatomical basis of the histological changes in GAP 43 expression observed in the stroke brains. However, the unusual fiber trajectories seen in the stroke brains (above) may also be due to the unmasking of less dominant pathways due to cellular necrosis in substantial areas of the striatum, the overlying cortex and deep white matter (a well known limitation of DTI is that it can only pick out a single, dominant, fiber direction per voxel; subsidiary fiber pathways, if they exist, are not detected).
In this study, we used the DTIStudio data processing software, which allows tracking based on the FACT algorithm (a deterministic tracking algorithm). There are some major drawbacks associated with the use of this particular methodology for tracking axonal projections within the brain [55]. However, it is widely used for in vivo tracking studies and has 3 major ‘free’ parameters; the FA values for starting and stopping tracking, and the maximum turn angle at each step. The maximum turn angle is the most complex to optimize; too small an angle results in major, straighter, tracts, while too large an angle results in many spurious tracts. The start and stop tracking FA were chosen based on the mea-sured FA within the tissue regions selected. Tracking halts when the FA in the voxel is at the stop FA value hence there is no tracking outside of the brain i.e., through the background noise. The maximum turn angle was selected based on many trials using angles between 10 and 70 degrees and the angle chosen which resulted in the most coherent tract bundles [21].
In summary, long term monitoring of rodent brain for up to 21 days showed motor recovery well in advance of axonal sprouting measured by GAP-53 increase in the peri-lesional tissue. DTI tractography showed two different fiber patterns which allowed new connections between the peri-lesional tissue and the thalamus.
From these data, it appears that DTI gives valuable non-invasive information about post-stroke plasticity paralleling histologic and anatomic changes in the areas and pathways involved in motor recovery after stroke. This is the first study which shows that it is possible to demonstrate in vivo and ex vivo microstructural and connectivity remodeling after stroke in mice. Further confirmation of this finding should be performed in larger cohorts of rodents and in humans.
ACKNOWLEDGEMENTS
This work was supported in part by the Swiss Heart Foundation (CG), an Established Investigator Award from the American Heart Association (AdC), and the Athinoula A. Martinos Center for Biomedical Imaging (P41RR14075, S10RR016811, the MIND Institute). We would like to thank L Benowitz, for lab facilities and expertise on GAP 43 staining, G.G. Dai for pulse sequence development, J.B. Mandeville for help with image reconstruction, and A. Kumar, N. Hadjikhani and Brian Quinn for their valuable comments on the manuscript.
REFERENCES
in press


