All published articles of this journal are available on ScienceDirect.

Does Congenital Deafness Affect the Structural and Functional Architecture of Primary Visual Cortex?
Authors Info & Affiliations
Abstract
Deafness results in greater reliance on the remaining senses. It is unknown whether the cortical architecture of the intact senses is optimized to compensate for lost input. Here we performed widefield population receptive field (pRF) mapping of primary visual cortex (V1) with functional magnetic resonance imaging (fMRI) in hearing and congenitally deaf participants, all of whom had learnt sign language after the age of 10 years. We found larger pRFs encoding the peripheral visual field of deaf compared to hearing participants. This was likely driven by larger facilitatory center zones of the pRF profile concentrated in the near and far periphery in the deaf group. pRF density was comparable between groups, indicating pRFs overlapped more in the deaf group. This could suggest that a coarse coding strategy underlies enhanced peripheral visual skills in deaf people. Cortical thickness was also decreased in V1 in the deaf group. These findings suggest deafness causes structural and functional plasticity at the earliest stages of visual cortex.
1. INTRODUCTION
Classic experiments by Hubel and Wiesel demonstrated the role of environmental input in shaping the primary visual cortex (V1), through manipulations of animals’ visual environments such as dark rearing or rearing in environments consisting exclusively of vertical stripes, and using electrophysiological and histological methods to discern the neural consequences [1, 2]. Subsequent research in humans into visual development and plasticity using functional magnetic resonance imaging (fMRI) has borne out these principles [3-5]. These lines of research typically address the consequences of a compromised visual system. However, the impact of deprivation of one sense on the cortical architecture of remaining intact senses is less well understood. The study of visual changes in congenitally deaf people provides a model to address this question.
Deaf people demonstrate superior detection of targets and motion discrimination, which are concentrated spatially in the peripheral visual field (PVF) [6-10]. These enhancements are specific, since contrast sensitivity [11], brightness sensitivity [12], colour discrimination [13], and temporal resolution [14-16] remain unaltered. These changes are thought to be evidence of compensatory plasticity as deaf people rely on peripheral vision to orient to new stimuli, particularly those which are moving in the periphery, as the typical division of labour with audition is not possible [17].
During fMRI scanning, deaf native signers, hearing native signers, and hearing non signers responses to viewing flow fields of moving dot stimuli were contrasted to explore differences in motion processing across the visual field [18]. Participants were required to attend to either the central visual field (CVF) or peripheral visual field (PVF).
Greater activation in MT+/MST visual motion processing regions occurred in hearing participants when they attended to the CVF, whereas deaf participants had greater activation in these regions when attending to the PVF [18]. While there was an equal amount of activation in lower visual areas (V1/V2), deaf participants recruited posterior parietal cortex (PPC) and posterior superior temporal sulcus (p-STS) to a greater extent in the peripheral motion condition. The authors concluded enhanced peripheral visual processing skills in deaf people were mediated by increased involvement of attentional regions such as PPC [18]. Importantly, changes were not observed in hearing native signers, demonstrating that deafness, rather than native use of a sign language, causes changes to peripheral vision.
Cross-modal plasticity, specifically functional takeover of auditory cortex by visual processing, has also been studied as a candidate neural mechanism to explain differences in deaf peoples’ vision. This has been tested against explanations based on ‘compensatory hypertrophy’ of the visual system. Evidence for compensatory hypertrophy was sought through measuring the amount of activation and surface area in the regions V1/V2/V3/V4 and MT+ during standard retinotopic procedures in deaf native signers, hearing native signers and hearing non signers groups [19]. There were no differences between groups in surface area, activation, or between the cortical representation of CVF and PVF of these visual areas [19]. Cross-modal plasticity was characterised through measuring responses in auditory cortex to a peripheral visual motion stimulus which was either attended or ignored. Deaf native signers activated auditory areas to a greater extent in comparison to both hearing native and hearing non signers. Activation was modulated by attention. Thus changes in visual processing due to deafness were argued to be restricted to auditory cortex and higher visual areas [19].
The neural locus of enhanced peripheral visual processing skills in deafness has been examined with congenitally deaf cats [20]. The contribution each auditory area makes to superior peripheral visual localization and decreased movement detection thresholds was examined by individually cooling distinct auditory areas in deaf cats [20]. Cooling of the dorsal zone (DZ) of auditory cortex in deaf cats eliminated their superior motion detection thresholds [20]. Analogously, cooling of the posterior auditory field (PAF) eliminated their superior visual localization in the contra-lateral visual field [20]. Thus a causal link was demonstrated between specific areas of auditory cortex and the enhanced visual processing skills noted in the visual periphery of deaf animals. Tract tracing studies investigating the anatomical bases for enhanced peripheral motion processing subserved by DZ in the auditory cortex of deaf cats has demonstrated an increase in projection strength between this area and the posterolateral lateral suprasylvian area which is an extrastriate region thought to be involved in processing visual motion [21, 22]. Overall, the extent of anatomical alterations in auditory cortex was small, suggesting that different connections became unmasked or received greater functional weighting in the case of congenital deafness, as opposed to entirely new connections developing [22, 23]. From tract tracing studies, there is also evidence of a direct connection between primary auditory and primary visual cortices in Macaca fascicularis monkeys [24]. Whilst this connection was relatively weak in comparison to projections from adjacent polysensory cortices, it may contribute to visual differences observed in congenitally deaf animals. These findings suggest that rather than substantial rewiring of visual information at the level of the thalamus to auditory cortex, visual information reaches these auditory regions through the amplification of existing connections.
Hierarchical processing is a key organising principle of visual cortex [25, 26]. Retinotopic structure in MT+ has been identified, which strongly suggests regularities in information processing throughout the visual system [27-29]. Therefore the findings summarized above showing changes in higher visual areas and auditory cortex in congenitally deaf humans, and in the connectivity of the auditory and visual cortices in animal models of deafness, are likely to be preceded by changes lower down the visual hierarchy. Optic coherence tomography (OCT) has been used to demonstrate larger neuroretinal rim areas in deaf participants, which is thought to reflect retinal ganglion cell number [30]. Additionally, the retinal nerve fiber layer in peripapillary regions relating to the temporal retina was significantly thicker in deaf participants; the extent of changes were correlated with sensitivity in the PVF as measured by Goldmann Perimetry [30]. Microstructural properties of the visual thalamus and the visual thalamocortical radiation are altered in congenitally deaf participants [31]. This is indicative of changes to how visual information is conveyed into visual cortex. These findings imply that changes are present at the earliest stages of visual processing in deaf people, and further investigation of primary visual cortex is critical to providing a more complete description of altered visual processing in deafness.
Traditional retinotopic mapping procedures use phase encoded stimuli to map polar angle and eccentricity in visual areas [32]. Population receptive field (pRF) modeling adds a statistical summary of the receptive field properties of neuronal populations in each voxel to the measurements derived from retinotopic mapping [33]. Naturally, these pRF parameters do not simply reflect the average of receptive field sizes of individual neurons in the voxel as measured in electrophysiological experiments. Measurements could be influenced by factors such as scatter of the individual receptive fields, as well as contextual interactions between the neurons both within the population measured and those outside of it. Despite these caveats, pRF modeling is a non-invasive method enabling closer approximation of receptive field properties, which constitute the cortical architecture.
In summary, previous studies into the neural basis of enhanced peripheral visual acuity in congenitally deaf humans have found alterations in auditory cortex, as well as attention related areas in higher visual and parietal cortex. However, studies using retinotopic mapping to contrast the size and activation in early visual areas between deaf and hearing participants have found no group differences. The methods used in previous studies however did not permit a precise assessment of the spatial selectivity of visual cortical voxels. More recent studies of the retina and visual thalamocortical tract in congenitally deaf humans have found alterations in these structures which, given the hierarchichal structure of the visual cortex, suggests closer examination of the cortical architecture in early visual areas is warranted. In the current study we used visual psychophysics and fMRI with population receptive field modeling to measure the structural and functional properties of primary visual cortex. We contrasted hearing and congenitally deaf participants to determine whether plasticity in these regions could account for the enhanced peripheral vision observed in deaf people. We employed visual stimulation of a wide field of view up to an eccentricity of 37.5 degrees to particularly assess differences in the peripheral visual field, as we predicted differences would be concentrated in these regions. Based on previous findings that increased cortical magnification factor [34] (and so decreased population receptive field size [35, 36]) is associated with increased acuity, we predicted that the deaf group would have decreased population receptive field sizes in the visual periphery. White matter alterations in the visual thalamus and visual thalamocortical tract have been reported in congenital deafness [31]; we wanted to determine whether these structural abnormalities persisted into the cortical visual processing hierarchy. Increased cortical thickness in visual areas has been reported in blind participants [37, 38] and linked to reduced visual acuity [39]. As such, we predicted thinner visual cortex in the deaf group.
2. METHODS
2.1. Participants
Fifteen congenitally severely/profoundly deaf participants (7 female/8 male) and 15 hearing participants (11 female/4 male) were scanned. One male deaf participant was excluded from MRI analysis due to excessive motion in the scanner. Psychophysics data were not collected from another deaf male participant due to time restrictions at the experimental sessions. All participants were right handed and screened for additional neurological and psychiatric problems. Participants did not differ significantly in age (t(27)=0.2, p=0.843, hearing mean 38.32(+/- 7.9 SD), deaf mean 39(+/- 10.2 SD)). Aetiology of participants’ deafness was based on self-report. For the 14 deaf participants whose data were analysed, 5 were deaf through maternal rubella, 3 reported genetics as their cause of deafness, and 6 had an unknown cause of deafness. Vascular lesions can also occur in cases of maternal rubella, therefore all images were screened by one of the authors who is an experienced neuroanatomist (MIS). No neuroanatomical anomalies were detected in the deaf group.
Enhanced visual processing skills are present in animal models of congenital deafness [20, 40, 41]. This unambiguously demonstrates that the peripheral vision advantages observed in deaf people are a result of deafness rather than the use of a sign language. Depending on whether a person is hearing or deaf, native acquisition of a sign language has been shown to have a different effect on the neural representation of visual motion processing [6, 18] and lateralisation of face processing [42]. Therefore, contrasting deaf to hearing native signers may not be the most appropriate contrast with which to isolate the effect of deafness on the visual system. Plasticity is greatest during development, and as such any influence sign language is likely to have on the development of the visual system will be greater earlier in development in comparison to later in development. To attenuate the effect sign language will have on the development of visual cortex, we tested only participants who had learnt sign language after the age of 10 years. To attempt to control for any residual effect of sign language on visual processing we tested hearing participants who had also learnt to sign after the age of 10 as a control group. The deaf group was significantly younger than the hearing group when they began to learn sign language (t(27)=3.42, p=0.002, hearing mean 25.87(+/- 7.5 SD), deaf mean 17.82(+/- 4.78 SD)). Matching age of sign language acquisition between deaf and hearing populations is challenging since deaf and hearing people who learn sign language late in life do so for different reasons. Deaf participants relied upon speech reading prior to having learnt sign language, and all but 2 of the 14 deaf participants whose data were analysed reported that they could converse fluently with hearing people in everyday conversation using speech reading.
During testing, all participants’ vision was corrected to normal. Research was approved by UCL Research Ethics Committee.
2.2. Psychophysics Task
Stimuli for the psychophysics experiment were generated in MATLAB R2012a (MathWorks, Inc.) and displayed using the Psychtoolbox package (http://psychtoolbox.org). Stimuli were presented on a Toshiba Satellite Pro laptop (resolution: 1280*800). Three participants were instead tested using a Macbook Pro (1440*900) due to technical failure. Viewing position was stabilized at 34 cm from the participants eyes to the fixation cross with a chin rest. The eccentricities at which stimuli were presented were comparable across laptops.
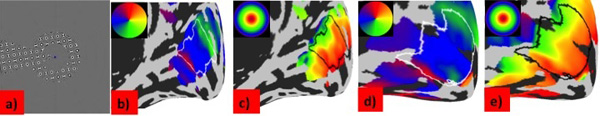
Mapping stimulus and retinotopic maps. (a) In the scanner participants viewed rotating wedge and expanding ring stimuli containing a high contrast flickering checkerboard pattern whilst maintaining fixation on a small blue dot in the center of the screen. (b-e) Maps of population receptive field (pRF) parameters for a deaf (b, c) and a hearing (d, e) participant. Data are projected on an inflated model of the right cortical hemisphere. Polar angle (b, d), eccentricity (c ,e) are shown in deaf and hearing participants respectively. The region of interest in primary visual cortex included in the analysis is outlined in each map. All maps are thresholded at R²=0.1, corresponding to the model fit required for the inclusion of the data point for analysis.
In separate runs, we measured position discrimination at central, middle and peripheral visual field locations (C/M/P VF). Stimuli were scaled to increase in size and width across eccentricity to approximate the decrease in overall acuity and cortical magnification. Two vertically arranged pairs of white Gaussian dots were presented for 300 ms at either side of the fixation dot at 1.3°, 10.2° or 20.3° eccentricity (corresponding to the CVF, MVF, and PVF conditions). The standard deviation of each Gaussian dot in the CVF was 0.13°, and the vertically arranged pair was 0.64° apart. In the MVF condition standard deviation was 0.21° and dots were 1.06° apart, and in the PVF condition standard deviation was 0.47° and dots were 2.33° apart. Of these two pairs, one pair was misaligned. To discourage participants from saccading to one dot pair, they were informed that both pairs were misaligned, so that a strategy based on only looking at one pair would fail. Participants were required to identify which pair was more misaligned, and indicate their response via a right or left arrow key press. The brief stimulus duration of 300 ms prevented saccades to both locations within a trial. Participants were allowed unlimited time to make their responses. The decision to make these tasks self-paced was based on previous findings which suggest deaf participants’ speed accuracy trade-off is different to that of hearing people [43]. Thresholds were estimated using a simple 2-down, 1-up staircase procedure which converged on a performance of ~70.7% correct. The threshold was calculated by excluding those reversals with ±2 mean absolute deviations from the mean, and then calculating the mean across the latter half of these reversals. There were 5 short blocks within each staircase. This position discrimination task was favored over other visual acuity tasks because it is brief and comparably simple, which is of particular importance when working with this special population who are unfamiliar with visual psychophysics.
2.3. Imaging Parameters
Images were acquired using a Siemens 1.5T Avanto scanner at the Birkbeck-UCL Centre for Neuroimaging. Echo planar images were acquired in an interleaved order (TR=2000 ms, TE=39 ms, voxel resolution 3 mm isotropic, flip angle 90°, BW=1474 Hz/pix) with 24 axial slices, centered on and tilted to be parallel with the calcarine sulcus. The front of the head coil was removed to avoid obscuring participants’ view, leaving 20 remaining channels for data collection.
An MPRAGE structural sequence with voxel size of 1 mm isotropic, flip angle of 7°, TI=1000 ms, TR=8.4 ms, TE=3.57 ms and BW=190 Hz/pix was acquired using the 32 channel head coil.
2.4. fMRI Stimuli and Task
For the pRF modeling, a dynamic, high-contrast ‘ripple’ pattern was used as this maximizes the visual response, which is displayed in Fig. (1a). The pattern was defined as follows;
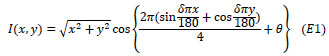 |
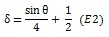
In which I is pixel intensity at a pixel in Cartesian coordinates (x, y), defined relative to the center of the screen. The parameters θ and δ, correspond to the phase and spatial frequency of the pattern. Parameter θ varies with time from 0 to 4π in 72 equal steps of 32 ms, completing each cycle approximately every 1.15 s. Parameter, δ, was a function of θ,
 |
Positive pixel intensity values were set to white, whereas negative or zero values were set to black. The background was uniform grey.
For the mapping, this stimulus was viewed through an aperture consisting of a rotating wedge and expanding/contracting ring in two runs each lasting 6 min 30 s. The wedge subtended a polar angle of 36° and eccentricities from 1-37.5°. It rotated through the visual field in 20 discrete steps of 18°, one per fMRI volume acquired. In order to drive sufficient responses in the periphery, the ring width was logarithmically scaled with increasing eccentricity up to a maximal eccentricity of 37.5°. It changed in 16 discrete steps. The wedge rotated clockwise in the first run, followed by a counter-clockwise rotation in the second run, while the ring expanded in the first run and contracted in the second run. The wedge rotated for 8 cycles, while there were 10 expansions/contractions of the ring. The runs ended with 60 seconds of blank gray to estimate the baseline response.
We modeled the hemodynamic response function (HRF) based on a run lasting 5 min 10 s, using a full screen version of stimulus with a radius of 37.5° visual angle from fixation. The stimulus was bounded by a blank gray screen. The stimulus appeared for 2 seconds followed by 28 seconds of blank gray. This was repeated 10 times. In both mapping and HRF runs at the central and outer edge of the stimulus, the contrast of the ripple pattern was ramped linearly down to zero over a range of 1.2° visual angle.
Throughout the scanning session, participants were instructed to monitor the color of the fixation dot subtending 1°, and count how many times this changed from blue to red. Every 200 ms the fixation dot could change color from blue to red for 200 ms with a probability of 0.05, though these color changes never occurred in succession. Participants were then asked to report how many times the color change happened at the end of each run. This task was designed to ensure participants maintained fixation. The ease of the task ensured all participants could perform it, therefore avoiding introducing group differences. To facilitate fixation stability, a low-contrast ‘radar screen’ pattern covered the screen [44]. This pattern consisted of 12 evenly spaced radial lines extending from outside of the fixation dot to the horizontal edge of the screen, and 11 equally spaced concentric rings centered on fixation, extending to the vertical edges of the screen. All stimuli were generated in MATLAB R2012a (MathWorks, Inc.) and displayed using the Psychtoolbox package (http://psychtoolbox.org).
Stimuli were projected onto a large screen in the scanner bore, approximately 13 cm from the participants’ eyes. The head coil was elevated, so the participants’ gaze was perpendicular to the screen. This position precluded the use of eye tracking equipment. Having the large screen in the scanner bore placed body size restrictions on participants. A smaller screen was therefore used for 3 people (2 deaf, 1 hearing) allowing participants a field of view up to 16° eccentricity. This direct view method was used as it allowed the largest field of view, which was essential for investigating changes in the visual periphery.
2.5. MRI Data Analysis
FreeSurfer (http://surfer.nmr.mgh.harvard.edu/) was used for surface reconstructions. Pre-processing of functional images was completed in SPM8 (http://www.fil.ion.ucl.ac.uk/spm/). Software built in house was used in order to complete the pRF mapping analysis (http://dx.doi.org/10.6084/m9.figshare.1344765).
A 1.5mm3 smoothing kernel was applied to the structural images before they underwent cortical reconstruction and volumetric segmentation in FreeSurfer 5.0.0. Comprehensive details of these procedures are provided elsewhere [45-53]. Briefly, brightness and contrast normalization is performed on the images, and all non-brain tissue is removed with a hybrid watershed/surface deformation procedure [54]. Images undergo Talairach transformation, subcortical white matter and deep gray matter structures are segmented [50] and the gray white matter boundary is tessellated, topology automatically corrected [48, 55] and surface deformation is performed following the application of intensity gradients to optimally place the gray/white and gray/CSF borders where the greatest change in intensity signifies transition to the other tissue class [45]. During reconstruction, the cortex is modeled as a surface model (mesh of triangles). The co-ordinates of these vertices are known from the original T1 image used to perform the reconstruction, which allows rendering of the surface.
In pre-processing functional images, the first 7 volumes were discarded from each run, ensuring magnetization transfer stabilization. Images were unwarped [55] realigned and co-registered to the structural scan with SPM8.
Primary visual cortex and areas V2 and V3 were manually delineated by the experimenter in FreeSurfer based on the polar angle and eccentricity maps. Anatomically V1 is situated in the calcarine sulcus, and contains a complete representation of the contralateral half of the visual field [32]. Vertices within the regions were labeled to extract data for further analyses.
For population receptive field (pRF) modeling, data were projected onto the surface generated in the FreeSurfer cortical reconstruction by finding the voxel in the functional image that fell midway between each pair of vertices in the pial and white matter surface mesh. For each run, the observed time series were z-score normalized and linear detrending was applied. Participants’ HRF models were calculated by averaging the 10 instances of the HRF stimulus using only visually responsive vertices (those for which the mean response minus the standard error across trials and between the second and tenth volume of the HRF was above zero). We further fitted a two-gamma function with four free parameters (delay for peak, delay for undershoot, amplitude ratio of peak/undershoot, overall amplitude) to these average HRF data.
During model fitting, a predicted time series was calculated from the overlap between the pRF model and binary stimulus aperture for each point in time, and then convolving it with the specific participant’s HRF model [33]. We fitted a Difference of Gaussian (DoG) receptive field model, which is comprised of a subtraction of 2 Gaussian functions, whereby the Gaussian with the larger standard deviation is subtracted from the Gaussian with the smaller standard deviation. Thus there are six parameters: visual field position (x and y in Cartesian co-ordinates), the spatial spread of the facilitatory center of the pRF (σ1), the spatial spread of the surrounding suppressive region (σ2), the amplitude ratio of the 2 Gaussians relative to each other (δ), which corresponds to a suppression index, and finally the overall signal amplitude (β). The DoG model has been argued to provide a more physiologically plausible model of the data as it is capable of modeling contributions from center surround receptive field structures [56] which are well characterized from the electrophysiology literature [57]. This model accounts for negative bold responses (defined as when the fMRI signal deviates below levels observed when viewing a blank gray screen), which are observed in spatial proximity to active regions [56].
A coarse-to-fine approach was used in which the parameters are disambiguated and then refined further. Data were initially smoothed on the spherical cortical surface with a large kernel (FWHM= 8.3 mm). The coarse fit generated thousands of permutations of the pRF parameters and calculated the predicted time series for each. This coarse fit stage involved only the three parameters of a standard Gaussian (i.e. x, y, and σ1). The prediction showing the maximal Pearson correlation with the observed (smoothed) data was then selected. During the fine fit, the parameters from this fit were then used to optimize the pRF parameters of the DoG model at each vertex, where the squared residuals between the model and the data were minimized using a Nelder-Mead simplex search optimization procedure [58]. The fine fit then used unsmoothed data and included a beta parameter to estimate the amplitude of the signal. Only vertices for which a reasonable coarse fit (R2>0.05) was found were used. Finally, parameter maps were smoothed again (FWHM=5 mm) in order to create smooth maps.
2.6. Data Exclusion Criteria
Several aspects of the experimental protocol differed from typical retinotopic mapping procedures. The elevated head position for the direct view of the widefield stimulus meant participants were less comfortable; this resulted in greater movement which cause head motion artifacts and prevented scanning people for long periods in this position. The elevated head position also precluded the use of eye tracking equipment, which would otherwise have been used as an objective criterion for excluding participants with poor fixation. Scanning time was deliberately kept short as we relied on a video link to communicate with deaf participants and we wanted to reduce the amount and complexity of communication to avoid the introduction of artifacts by head movements (which are part of sign language), as well as communication breakdown which would have contravened guidelines set out in our ethics approval to complete this imaging project.
We developed several criteria to ensure artifactual data points did not have an undue influence on results. Preliminary data analysis demonstrated evidence of an ‘edge effect’, whereby pRF size plateaued at around 30° eccentricity. It is possible that pRF sizes continued to increase beyond this range; however, because the mapping stimulus did not extend beyond 37.5° eccentricity, there may be an artifactual deflation of pRF size for pRFs outside this range. Generally, the reliability of model fits at these locations is poor. Such saturation artifacts at the edge of the stimulus range are common in pRF studies [35, 59]. They may also show a reversal of the eccentricity map at the anterior edge of V1 which could confound the analysis (although inspection of our maps suggested this was relatively uncommon). Thus to minimize the influence of such artifacts, we restricted our analysis to an eccentricity range of 3 to 30°. Even in spite of this we did however observe a gradual saturation of the relationship between pRF size and eccentricity, which may have caused an underestimation of increasing pRF size with eccentricity and consequently the differences between groups. The central visual field was truncated for the same reason (the fixation dot extended up to 1° eccentricity and beyond that the stimulus was gradually ramped up in contrast up to an eccentricity of 2.2°). These issues with edge effects additionally meant that participants who were scanned using the smaller screen were excluded from the MRI analysis, although their data from the visual psychophysics tasks was still analyzed. The smaller screen was used by 1 hearing participant and 2 deaf participants, and we excluded data from these participants. For the hearing group, this corresponds to 28 hemispheres remaining in V1 (2 hemispheres excluded), and 56 visual areas remaining in V2 and V3 (4 hemispheres excluded). For the deaf group, as we excluded one participant prior to analysis due to excessive motion during scanning, this left 24 hemispheres in V1 (4 hemispheres excluded), and 52 visual areas in V2 and V3 for analysis (8 visual areas excluded).
For each parameter, data points not within three standard deviations of the mean were excluded (this corresponded to one data point for the σ1 parameter, one data point for the β parameter, one data point for the δ parameter, and three for the visual area parameter across all participants).
We further excluded data due to it being unable to delineate a map or the data being biologically implausible, which we defined as not displaying a significant positive correlation between eccentricity and pRF centre size [35]. These biologically implausible data are likely to result from excessive measurement noise that would drown out any physiologically relevant effect. In the hearing group, we excluded an additional 2 hemispheres in V1 (26 remaining), 11 V2s (45 remaining) and 12 V3s (44 remaining). In the deaf group, we excluded an additional 6 hemispheres from V1 (18 remaining), 14 V2s (38 remaining), and also 14 V3s (38 remaining).
As hemispheres are not independent observations, in instances where there was data available from both hemispheres, we took the arithmetic mean of the parameter observations. Therefore, in V1 statistical analysis is performed on 10 participants in the deaf group and 14 participants in the hearing group. No statistical analyses were performed on visual areas V2 or V3, though the number of observations upon which the plots are based matches those in V1 (see Supplementary Fig. 1).
This is a relatively high rate of data exclusion; we employed rigorous criteria to minimise the contribution from these aforementioned factors as they may have disproportionately affected data from the deaf group. Nevertheless, the pattern of results without any of these steps is qualitatively the same (see Fig. 5).
2.7. Group Comparison
To assess the differences between the two groups we used a curve fitting approach, in which we fitted either cumulative Gaussian or higher order polynomials to averaged pRF data within each group. The cumulative Gaussian curve of estimated pRF parameter z as a function of eccentricity (p) was defined as follows;
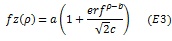 |
where a corresponds to amplitude, b horizontal shift, and c the slope of the function. The exponential fits to the relationship between parameter z and eccentricity (ρ) was defined as follows;
 |
where m corresponds to the amplitude of the curve, k the decay factor, and l the asymptote. Additional curve fits employed polynomials of second (quadratic), third (cubic) or fourth order to describe the relationship between group-average pRF data and eccentricity.
A bootstrapping approach was then used to test for significant differences between the groups. We resampled the data within each group with replacement (separately in each eccentricity band) and refitted the function curves 1000 times. For each pair of resampled curve fits we calculated the difference between the individual parameters as well as the area under the curves. We then calculated the p-statistic for each parameter difference by quantifying what proportion of these 1000 differences had the opposite sign as the observed difference. This approach is akin to a one sided test, and therefore we have used an alpha level of α<0.025 as the level of significance required to determine whether the curve parameters were different between the deaf and hearing groups.
3. RESULTS
To discern whether congenital deafness resulted in changes to the functional and structural architecture of primary visual cortex, we collected retinotopic mapping data using fMRI on groups of deaf and hearing participants, matched in terms of having learnt sign language after 10 years of age. Fig. (1b-e) shows typical polar and eccentricity maps. We were able to detect retinotopic map structure in all participants, confirming there are no macroscopic differences between deaf and hearing groups [19].
3.1. Difference of Gaussian Model
In each participant’s native space, we contrasted parameters derived from the population receptive field model between groups (σ1, σ2, δ and β). We used a Difference of Gaussian (DoG) model which can characterise contributions from the inhibitory surround of the population receptive field by modeling negative bold responses to stimulation near the receptive field center [56]. Analysis was performed on the mean of the results from both hemispheres from participants, or a single hemisphere when the participants other hemisphere had been excluded because of poor data quality.
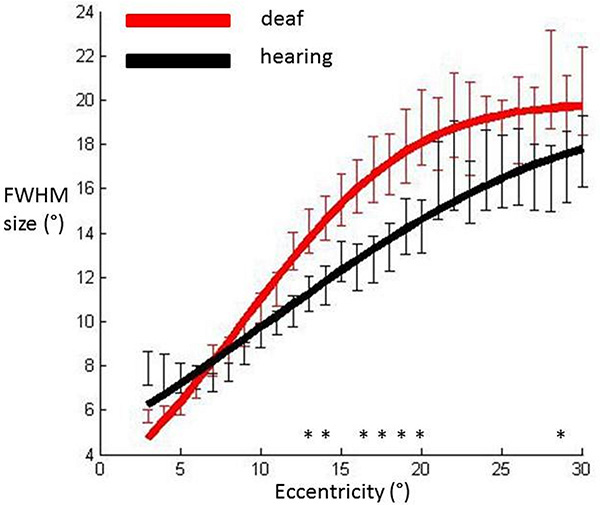
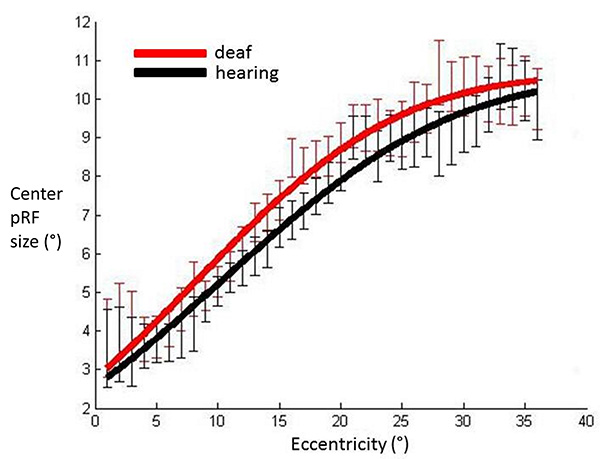
Full width at half maximum (FWHM) sizes of the pRF averaged across participants’ hemispheres in each group and plotted against eccentricity in primary visual cortex. Data were fitted with a cumulative Gaussian curve. Independent samples t-tests were used to assess whether there were differences between groups at each eccentricity bin.
Significantly different bins (p<0.05) are denoted with an asterisk. Red: Deaf participants, Black: Control group. Error bars denote +/- standard error of the mean.
We calculated the FWHM of the DoG pRF profile (Fig. 2). This measurement corresponds to width of the facilitatory part of the DoG profile. The relationship between eccentricity and FWHM was well described with a cumulative Gaussian curve (hearing R²=0.96, deaf R²=0.98), and bootstrapping analysis revealed a significant difference between the two groups in that the slope with eccentricity was greater in the deaf group as compared to the hearing group (p=0.0031). Eccentricity based bin-wise independent samples t-tests demonstrated the differences were concentrated in the near and far periphery. Fig. (3) depicts the average pRF profile for deaf and hearing groups in steps of 4° which again demonstrates the differences between groups are concentrated in the near and far periphery.
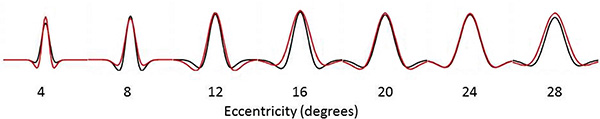
Average pRF profile illustrating differences between the deaf (red) and hearing (black) groups in steps of 4° eccentricity.
Fig. (4) shows that the cumulative Gaussian curve also provided a good fit for the relationship between the facilitatory center parameter (σ1) and eccentricity (hearing R²=0.98, deaf R²=0.98). There was a non-significant trend suggesting a steeper slope of increase in facilitatory pRF size with eccentricity in the deaf group (p=0.027). Amplitude and horizontal shift parameters did not differ between groups (p=0.501, p=0.254 respectively). We investigated the spatial specificity of these results using eccentricity based bin-wise independent samples t-tests. This demonstrates differences in pRF centre size were concentrated in the near periphery. The relationship of the inhibitory surround parameter (σ²) with eccentricity was also well described by a cumulative Gaussian curve (hearing R²=0.97, deaf R²=0.96). None of the curve parameters differed significantly between groups (all p values>0.076). These results suggest the difference between deaf and hearing groups in FWHM was likely to be driven by an increase of the center facilitatory parameter.
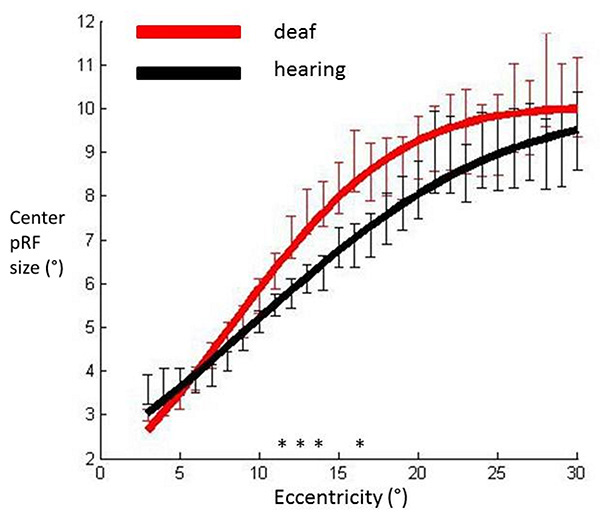
pRF center sizes averaged across participants’ hemispheres in each group and plotted against eccentricity in primary visual cortex. Data have been fitted with a cumulative Gaussian curve. Independent samples t-tests were used to assess whether there were differences between groups for each eccentricity bin.
Significantly different bins (p<0.05) are denoted with an asterisk. Red: Deaf participants, Black: Control group. Error bars denote +/- standard error of the mean.
Following this, we contrasted the overall signal amplitude (β) between the groups. The data were fit with a third order polynomial (hearing R²=0.87, deaf R²=0.73). There was a weak trend which may have suggested a main effect of group, in which the deaf group displayed greater signal amplitude in comparison with the hearing group but this did not reach significance (p=0.053). None of the other curve parameters were significantly different (all p values>0.229). We investigated this trend further by completing eccentricity based bin-wise independent samples t-tests between the groups, none of which yielded significant differences between groups. This suggests that there were no reliable differences in signal amplitude between groups at any eccentricity.
We also analysed the amplitude ratio between center and surround components (δ). With lower order polynomials, there were large discrepancies between the fit achieved for each group, which may have led to misleading results. Accordingly, we fitted the curves with a fourth order polynomial (hearing R²=0.79, deaf R²=0.72). We examined only the main effect of group (which corresponds to the area under the curve); this was not significant (p=0.168).
PRF density quantifies the amount of visual space between any given pRF position and its neighbors. We contrasted this parameter between groups, as it is informative regarding how pRFs are arranged spatially. The relationship between this measure and eccentricity was well described with a cumulative Gaussian fit (hearing R²=0.97, deaf R²=0.98). There were no differences in V1 between groups (all p values>0.19). Finding no differences between groups in terms of pRF density, while the FWHM size increases necessarily translates to an increase in overlap of pRFs.
3.2. Control Analyses
To determine whether the strict exclusion criteria used in this study biased results, Fig. (5) shows all data prior to any exclusion procedures. This demonstrates the same qualitative pattern of results irrespective of these data exclusion procedures. The difference between groups was not statistically significant (p=0.062 for the main effect of area under curve) but this is unsurprising considering that this data set includes biologically implausible results in which pRF size decreased with eccentricity.
We completed several analyses to determine whether the DoG model and the stimulus protocol were appropriate to model the population receptive field properties. Zuiderbaan [56] displayed blank periods interspersed throughout their stimulus presentation, whereas we presented a blank period of 60 seconds at the end of each run. While very unlikely, there could have been a different amount of signal drift between the groups. Alternatively, this temporal placement of the baseline period may have been insufficient to estimate the suppressive surround. However, Fig. (6) shows bold time series and model fits from the DoG Model, which demonstrate that the detrending of these time series data did not produce artifacts during the blank gray periods in which the stimulus was not displayed. We further contrasted the baseline period between deaf and hearing groups. For each participant, we averaged the responses from V1 of the final 30 seconds of the isoluminant screen. We did not apply any data exclusion procedures. An independent samples t-test revealed there were no differences in signal drift between the two groups (t(1738)=1.30, p=0.19), and that for each group, these means were close to zero (hearing mean=-0.1092, deaf mean=-0.0927).
We also investigated the estimation of FWHM using a standard two-dimensional Gaussian population receptive field model [33]. These results are displayed in Fig. (7) alongside the FWHM derived from the DoG model. While the group difference did not reach significance (p=0.085 for the main effect of area under the curve), the pattern of results was qualitatively similar irrespective of which of these methods are used to estimate the FWHM.
We also wanted to test whether the effects reported could be explained by haemodynamic or model fit differences between the groups. In contrast to the above analyses, we did not average across participants’ hemispheres. Typically deaf people will differ in the extent of hearing loss in either ear which could have consequences for either the model fit or haemodynamic response; averaging across hemispheres would remove this variance which may be important for detecting a difference between groups. Further, this approach has greater statistical power than averaging across hemispheres, making it a more stringent test regarding whether these haemodynamic or model fit differences could have contributed to differences between groups. The hearing group was exposed to considerable scanner noise, in contrast to the deaf group who would be subject to minimal, if any, scanner noise. Thus, it is plausible that intermodal stimulus competition in the hearing group, in which auditory cortex activation reduced the amount of blood available for visual processing [60, 61] contributes to the differences between groups. We explored this possibility by contrasting the peak amplitudes from the HRF measurement. The sparse stimulus presentation during HRF modeling enabled more effective estimation of baseline. An exponential function was used to model the fit between eccentricity and peak amplitude (hearing R2=0.96, deaf R2=0.95). There were no significant differences between groups for any of the parameters of this curve (all p values>0.067). A quadratic function was used to model the fit between eccentricity and model fit (hearing R²= 0.78, deaf R²=0.80). There were no significant differences between the groups (all p values>0.13).
No outlier removal procedures have been applied to the data so all participants are included in this graph. PRF center sizes averaged across participants in each group, plotted against eccentricity in V1. Red: Deaf participants, Black: Control group. Error bars denote +/- standard error of the mean. This demonstrates that the pattern of results is qualitatively the same prior to the stringent data exclusion procedures which were applied, suggesting these did not have a distorting effect on results.
3.3. Structural Data
We additionally contrasted cortical thickness measurements from functionally defined V1 between the groups. Convincing curve fits were not found between cortical thickness and eccentricity with any function; there appeared to be no systematic relationship between eccentricity and cortical thickness. As such, binned data across eccentricity was contrasted between groups using a linear mixed model. We modelled a random effect of participant in which we accounted for the correlated sources of random error from the 2 hemispheres of each participant, as well as a fixed effect of group. This revealed the deaf group had thinner cortex in V1 (F(1,1247)=4.485 p=0.034).
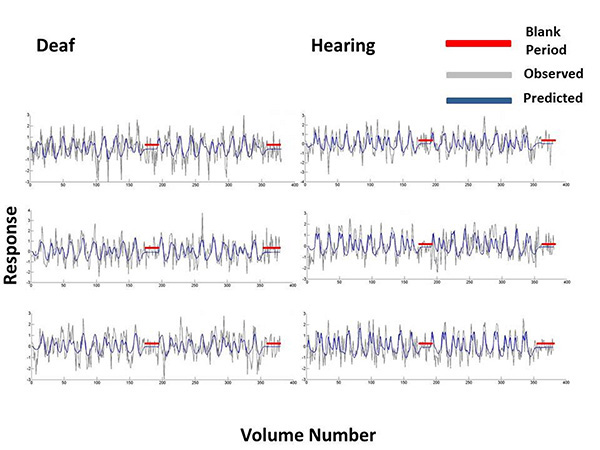
For 3 participants from the deaf and hearing groups we plotted the Difference-of-Gaussian model predictions and bold time series data at vertices in primary visual cortex. These time series were selected on the basis that they were at the 80th percentile of all the model fits, when these were ordered from the poorest to the best fit. The model predictions are plotted in blue and the observed bold response at that vertex is plotted in grey. Blank periods in which a blank grey screen was presented rather than a mapping stimulus are highlighted in red.
We additionally completed this analysis with the data before the outlier removal procedures based on the functional data. This also demonstrated a main effect of group (F(1,1913)=5.47 p=0.019), in which the deaf group had thinner cortex in comparison to the hearing group. The effects were therefore not dependent upon the outlier removal procedures.
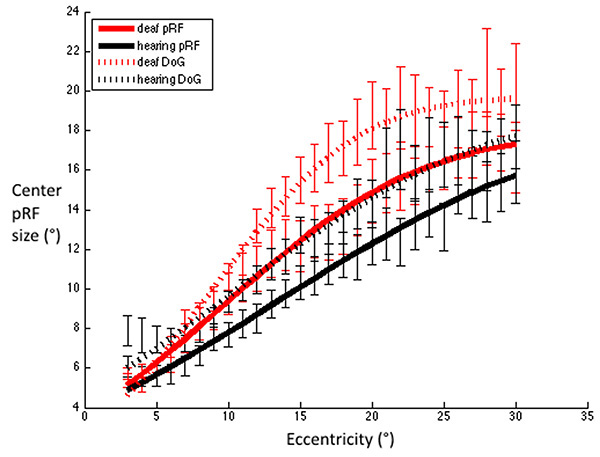
FWHM for V1 were estimated using Difference-of-Gaussians and standard 2D Gaussian population receptive field models. Red dashed line: Deaf participants DoG, Black dashed line: Control group DoG. Red solid line: Deaf participants standard pRF, Black solid line: Control group standard pRF. Error bars denote +/- standard error of the mean. This demonstrates that irrespective of the model used to estimate the FWHM, the pattern of results is qualitatively the same, whereby deaf FWHMs are greater than those of the hearing group, and this difference is most notable in the near – far periphery.
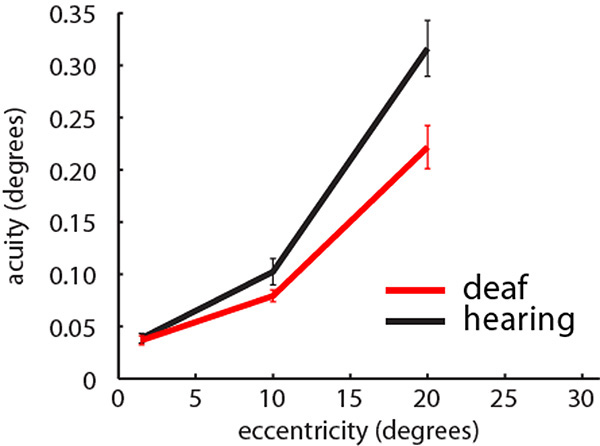
Visual positional discrimination thresholds in the central (1.5°), middle (10°) and peripheral visual field (20°) averaged across participants in each group. Red: Deaf participants, Black: Control group. Error bars denote +/- standard error of the mean. Analysis is based on 13 deaf participants and 15 hearing participants.
3.4. Visual Psychophysics
To test whether the groups differed in position discrimination at different visual field locations (Fig. 8), we completed a repeated measures ANOVA with a between subjects factors of group (deaf/hearing) and a within subjects factor of visual field location (C/M/PVF, corresponding to 1.3°, 10.2° or 20.3° eccentricity). Data deviated from the assumption of sphericity (W(2)=0.47, p<0.001), and therefore a Greenhouse-Geisser correction was applied. There was an interaction between group and visual field location (F(1.3,35.3)=5.138, p=0.022). Post-hoc t-tests revealed no group differences in the CVF (t(27)=0.31, p=0.757), nor the MVF (t(27)=1.58, p=0.127), but that the deaf group were significantly more sensitive than the hearing group in the PVF (t(27)=2.66, p=0.013).
3.5. MRI – Visual Psychophysics Correlations
We then used correlations to determine whether there was a linear relationship between MRI derived cortical architecture variables (center and surround size parameters from the DoG model and cortical thickness), and position discrimination ability. As we did not map within the central 2°, for the central visual field we correlated position discrimination ability with MRI derived cortical architecture variables at 3°. There was a significant negative correlation between cortical thickness and position discrimination at 10° (MVF) (R=-0.56, p=0.003). Aside from this, none of the MRI derived cortical architecture variables correlated with position discrimination ability.
DISCUSSION
To determine whether auditory deprivation alters functional or structural properties of primary visual cortex, we examined population receptive field properties and cortical thickness. The deaf group displayed larger pRFs as estimated by the full width at half maximum (FWHM) of the pRF profile. The trend towards a larger facilitatory center component of the pRF profile in the deaf group suggests this parameter, rather than the suppressive surround, was particularly enlarged in the deaf group. These effects were specific to the visual periphery. Cortical thickness in V1 was decreased in the deaf group. These functional and anatomical changes may contribute to the observed increased peripheral position discrimination ability in the deaf group.
Finding increased pRF sizes in the deaf group who also demonstrated enhanced peripheral position discrimination was the opposite of what we predicted, and counter-intuitive, since small (population) receptive field sizes are thought to underpin high resolution vision in the fovea. However, enhancing resolution throughout visual cortex by decreasing receptive field sizes would require massive cortical expansion to maintain visual coverage, which is unrealistic given the physical size constraints on the brain. PRF density (visual area) was matched between groups; by definition if pRF density remains the same while pRF size increases, overlap between pRFs will increase. Increasing receptive field size and overlap could improve localization and spatial discrimination through pooling signal across several noisy units. This ‘coarse coding’ provides a means of increasing sensitivity without cortical expansion [62].
Owing to the coarse spatial resolution of fMRI relative to individual neurons, it is inevitable pRF size estimates will include extra-classical effects (regions in visual space where stimuli do not elicit a spiking response but instead modulate the response to stimuli in the classic receptive field). We used a Difference of Gaussians model to account for some of the effects of these extra-classical properties of neurons [47]. Other factors may contribute to the suppression estimated by the pRF model, including extra-classical receptive field interactions and the positional scatter of neuronal receptive fields. Future research into neuronal parameters giving rise to pRF size will be important to understand the mechanism behind our results.
We observed no correlations between center and surround parameters of the DoG model, and visual position discrimination. There are several potential reasons for this. Firstly, the relationship between cortical magnification factor and acuity may not be linear in the periphery, as it is at more central eccentricities [34]. An interaction between different pRF parameters may account for increased acuity. If the deaf group employ a ‘coarse coding’ mechanism in the periphery and the hearing group do not, the relationship between pRF size and acuity may differ between the groups. In addition, there may be insufficient statistical power to properly assess correlational relationships due to the small number of participants. Finally, our position discrimination task was a combined measure from both visual hemifields. We also averaged pRF parameters across participants’ hemispheres. This may have removed the fine-grained information required to detect correlational relationships. Previously, correlational relationships between visual acuity and cortical architecture were shown when visual acuity was tested at more eccentricities, with a greater number of measurements providing a more reliable estimate [34, 36]. Thus, possible relationships between these variables in our data may have been obscured.
One of the ways attention exerts its effects is through manipulation of receptive field properties [63-65] in which receptive fields shrink and move towards the foci of attention [55]. PRF modeling can measure such changes due to attentional modulations [66, 67]. The fixation task we used was very easy (all participants scored higher than 95%) to avoid introducing group performance differences, which may have confused the interpretation of fMRI data. However, this meant attention was not completely controlled; the deaf group may have excelled at ignoring the task irrelevant mapping stimulus, thus enlarging their peripheral receptive field sizes. However, direct comparison of the extent of attention effects reveals they are more pronounced further up the visual hierarchy [66, 68]. This is the opposite of what we have found here, as effects appear greater in V1 (see Supplementary Information Fig. 1).
Eye movements are also a potential source of variance. The tilted head position precluded the use of eye tracking equipment. However, participants performed the fixation task accurately, ruling out large or extended periods of eye movements, which would be more likely to result in the inability to reconstruct visual maps rather than increases in the estimate of pRF size. Eye movements would have to be excessive to produce even subtle pRF size increases and would have caused increases across the entire range of eccentricities [3]. Furthermore, there is evidence deaf people are better at sustaining fixation [69]. Again, our results are the opposite of what would be anticipated should eye movements account for the differences between groups. Finally, we find it implausible that differences in age of sign language acquisition or sign language usage account for our effects, as differences between the groups emerge beyond the eccentricity at which sign language is received (~7°) [70].
Population receptive field size measurements were larger than those generated in previous studies [3, 33, 35, 71]. However, the aforementioned studies used 3T scanners, whereas here we used a 1.5T scanner. This affects the functional resolution of the blood-oxygen dependent signal, which may lead to differences in estimation of pRF size. Moreover, pRF sizes may depend on the mapping stimulus, as that determines which neuronal populations are driven to respond. We used a dynamic stimulus containing strong motion energy, which may have increased estimates of pRF size, although future research should explicitly compare pRF estimates using a range of different stimuli. Finally, using a much wider field of view than any previous study mapping pRFs in humans may have changed within-area interactions. Nevertheless, the group comparison remains valid even if the absolute pRF sizes are different than they might have been under another experimental setup.
Naturally, a final alternative is that pRFs in deaf participants were simply larger due to random variation. This remains a valid hypothesis especially considering that the group differences we observed are relatively small. Further conclusions on whether pRFs are enlarged in deaf participants will require independent replication. Importantly, however, our results already conclusively show that the enhanced peripheral vision in deaf people is not explained by smaller pRFs.
Deafness and age of sign language acquisition have been linked to anatomical changes in visual cortex. Penicaud [72] have demonstrated gray matter volume in early and dorsal association visual cortex is negatively correlated with age of sign language acquisition in deaf participants. They argue this is not an effect of auditory deprivation by contrasting deaf participants with different ages of sign language acquisition to hearing non signers. However, variance due to language within the deaf group may be greater than variance between groups due to auditory deprivation. We replicate this finding of decreased cortical thickness in V1 of deaf late learners of sign language. Our groups differed in age of sign language acquisition and thus we cannot entirely exclude the possibility of contributions from this factor. However, Allen [73] demonstrated that deaf native signers have increased volume in the calcarine sulcus relative to hearing non signers, but not hearing native signers, implying an interaction between sign language age of acquisition and auditory deprivation [73]. Our results concur in demonstrating that auditory deprivation contributes to anatomical alterations of early visual cortex. Penicaud [72] posit their findings demonstrate native signers have greater computational power in early visual cortex. However, it is not evident that increased gray matter volume in early visual cortex translates to increased computational power. While we found that in participants with thinner cortex, position discrimination was worse, this seems to contradict previous findings that thinner cortex is associated with better spatial acuity [37] and also our present results which demonstrated that better acuity in the deaf group is also accompanied by thinner cortex. Therefore this structural relationship requires further examination, with different measures of visual function. Increased occipital cortical thickness has been reported in congenitally [39] and early blind participants [38]. High resolution vision has been argued to be required for typical pruning mechanisms to occur during development, the absence of which leaves thicker, immature cortex [39, 37]. FMRI data acquired from the same participants studied by Penicaud [72] while they completed a grammatical judgment task, demonstrated that late signers preferentially recruited visual cortex, in contrast to native signers who engaged classic perisylvian language networks [74]. We propose that the lack of plasticity of perisylvian cortex for late learners of sign language forces visual cortex to adapt to processing the complex and dynamic sign language signal, requiring adaptations including the thinning of cortex, which facilitates communication by reducing the length of connections between neurons [36]. Explanations based on deafness and sign language use are not mutually exclusive; there may be an additive effect of sensory deafferentation and environmental enrichment (visual environment - sign language signal).
In conclusion, here we showed enhanced peripheral position discrimination in congenitally deaf adults. This is accompanied by increased cortical pRF size, in the absence of any change in the density of pRFs. This may suggest a ‘coarse coding’ strategy, in which overlapping neurons are better able to localise and discriminate peripheral stimuli. The lack of increased surround representation of the population receptive field suggests these effects are not mediated by suppression effects, but are a result of an enlargement of the whole pRF, and in particular the facilitatory center region. Our results demonstrate auditory deprivation is capable of causing both structural and functional plasticity of the cortical architecture in primary visual cortex.
FUNDING
This work was supported by a MRC studentship awarded to CRS, an European Research Council Starting Grant (310829) awarded to DSS, Wellcome Trust Fellowships awarded to MMacS (WT075214 (2006) and WT100229(2013)), and National Institutes of Health (R01 MH 081990) and Royal Society Wolfson Research Merit Award awarded to MIS.
CONFLICT OF INTEREST
The authors confirm that this article content has no conflict of interest.
ACKNOWLEDGEMENTS
We would like to thank Parob Coast for assistance with sign language interpreting during data collection, and Ivan Alvarez for comments on the manuscript.
AUTHOR CONTRIBUTIONS
C.R.S. conceived the experiment and designed it with M.I.S., M.M. and D.S.S. Data was collected by C.R.S. with assistance from M.M. Data was analysed by C.R.S. and D.S.S. The manuscript was written by C.R.S., and all co-authors provided comments on this.

