All published articles of this journal are available on ScienceDirect.

Attentional Networks in Adolescents with High-functioning Autism: An fMRI Investigation
Authors Info & Affiliations
Abstract
Background:
Attentional deficits in Autism spectrum disorder (ASD) are often noted, but their specific nature remains unclear.
Objective:
The present study used the child Attentional Network Task (Child ANT) in combination with functional magnetic resonance imaging (fMRI) to determine if the consistently cited deficits of orienting attention are truly due to dysfunctions of orienting-based networks. We hypothesized that these observations are, in fact, a reflection of executive dysfunctions. As such, we expected that although ASD adolescents would perform worse on the orienting portion of the Child ANT, the strongest differences in activation between them and the neurotypical (NT) control group would be in areas classically associated with executive functioning (e.g., the frontal gyri and anterior cingulate cortex).
Method:
The brain activity of six high-functioning adolescents with ASD and six NT adolescents was recorded while these individuals performed the three subcomponents of the Child ANT.
Results:
ASDs were shown to be more accurate than NTs for the alerting, less accurate for the orienting, and similar in accuracy for the executive portions of the Child ANT. fMRI data showed increased bilateral frontal gyri recruitment, areas conventionally associated with executive control, during the orienting task for the ASD group.
Conclusion:
We submit that the increased activations represent neurocorrelates of signal fixation attributable to the subset of executive control responsible for sustained maintenance signals, not the main components of orienting. Therefore, excessive fixation in ASD adolescents is likely due to dysfunctions of executive control and not the orienting subcomponent of the attention network.
INTRODUCTION
Attention Network Dysfunction in Autism Spectrum Disorder
Attention represents an important avenue of exploration in Autism Spectrum Disorder (ASD) given that individuals have consistently been observed to have impairments [1]. In one of the largest studies undertaken, up to 93% of observed participants were shown to have some form of attentional deficit [2]. While a diagnosis of ASD was previously grounds for exclusion from receiving a diagnosis of attention deficit hyperactivity disorder (ADHD) (DSM IV), the growing awareness of the overlap in attention deficits between the two disorders [1, 3, 4] has caused this to change (DSM V). Deficits in attention for ASD are commonly observed in social contexts (e.g., failures of joint attention and turn taking) and are less severe for executive functioning than in ADHD [3]. Attentional deficits in ASD, however, also occur in elementary forms of processing, including simple target detection tasks [5] and tests of vigilance or sustained attention [6]. For more information on the commonalities and differences in attentional deficits between ASD and ADHD, see [7].
The concept of attention is, in itself, a series of operations that integrate external sensory inputs with internal information and decision-making and many subcomponents are required to complete even the most basic task [8, 9]. Now that attentional deficits have been demonstrated to be a consistent finding in ASD, it is therefore worthwhile to isolate the subcomponents of attention in an attempt to determine if these impairments represent a wholesale dysfunction or localized deficits. In doing so, we may be able to better tailor our management styles to aid those affected. To this end, the attention model of [8] has served as a basis for identifying the subcomponents of attention in previous investigations [10-14].
This model suggests that there are three main subcomponents of attention: alerting, orienting, and executive control [8]. Each subcomponent is thought to represent an independent neural circuit and is composed of different regions of interest (ROIs) interacting with one another [8]. In brief, the locus coeruleus, right frontal and right parietal cortices are associated with alerting, the temporoparietal junction, superior parietal cortex, and frontal eye fields are associated with orienting, and the prefrontal cortex and anterior cingulate cortex (ACC) are associated with executive control [15].
Description of Attentional Networks Task (ANT)
In order to assess the three subcomponents of attention proposed by Posner, et al. [8] (i.e., alerting, orienting, and executive control), Fan et al. [10] created the Attentional Networks Task (ANT). The task consisted of a series of arrows pointing either right or left with a “target” arrow at the center of the screen. Participants were asked to identify the direction of the centrally presented arrow by pressing a key indicating either the left or right direction. For the alerting condition, an asterisk was briefly flashed at the center of the screen before the stimuli were shown, thus alerting participants to an upcoming stimulus. For the orienting condition, two warning cues corresponding to the position of the upcoming stimuli were briefly flashed at either the top or bottom of the screen, thus orienting participants to the position of the upcoming stimuli. Finally, executive control was evaluated by having flanking arrows either be congruent or incongruent with the direction of the target (i.e., central) arrow [10]. The ANT was originally tested in neurotypical (NT) adults and was shown to produce consistent single-subject estimates of the three subcomponents of attention. These results further supported the notion that processing efficiencies for the three subcomponents is largely independent [10].
A variation of this test designed for children (aptly named the Child Attention Network Task; Child ANT) was then created for the possibility of providing insight into how to help improve their attentional abilities [16]. The Child ANT has since been used to investigate attention processes in NT children [17], children with attention deficit hyperactivity disorder (ADHD) [12], and children with ASD [14].
Previous Findings of ANT in ASD
Previous investigations of ASD through the use of the ANT and Child ANT have shown differing results with deficits being observed in all three subcomponents of attention at varying ages [11, 13, 14]. Posner and Rothbart [15] suggested that the orienting network deficiencies (perhaps the most consistent finding in ANT studies of ASD) are a probable explanation for the commonly reported overly fixative nature of those with autism (e.g., their tendency to focus their gaze on an ear lobe rather than on more informative features of a human face such as the eyes). Others, however, have proposed that these delays are in reality due to executive impairments [18, 19], which produce difficulty in dividing (or inhibiting) attentional resources amongst competing external stimuli. Neuroimaging may help settle this dispute by allowing us to observe the areas of activation whilst ASD participants perform the ANT in real time.
Pertinent fMRI Findings in ASD
Indeed, fMRI studies of ASD have exploded in recent years and range in topics from social cognition to inhibition control [20]. Amongst the most consistent findings related to executive control are atypical activations in the ACC in participants with ASD [21-23], suggesting decreased cortical specialization (mild shifting of cortical location areas in response to a variety of tasks), leading to the hypothesis that autism is a distributed brain systems disorder [24]. (An extensive review can be found in [24]). A previous fMRI investigation of attentional processing in children with ASD used socially and non-socially-cued stimuli to show that regions commonly activated in NT children for the socially-cued stimuli were only active for children with ASD during the non-socially-cued stimuli presentations. Unique areas of activation in the left dorsal frontal parietal cortex and medial temporal lobe were seen when children with ASD saw the socially-cued stimuli ([25]. Therefore, the incorporation of the ANT with fMRI may allow us to identify differences in attentional processing between adolescents with ASD and their NT counterparts for the subcomponents of attention.
The Current Study
The present study uses the child ANT [16] in combination with functional magnetic resonance imaging (fMRI) to identify behavioral and brain activation differences between ASD and NT adolescents for the three subcomponents of attention in an attempt to reconcile previous observations and to determine if the consistently seen deficits of orienting attention are truly due to dysfunctions of orienting-based networks or are a reflection of executive dysfunctions. In accordance with previous work in children, we expected that ASD adolescents would perform demonstrably worse on the orienting and executive portions of the Child ANT, while performance on the alerting section would likely be normal [14]. We hypothesized that deficits in orienting and executive performance would relate to decreased patterns of brain activity within the fronto-cerebellar network (specifically the ACC, the middle and superior frontal gyri (MFG and SFG), and the cerebellum); a network previously indicated to play a role in directing attention (i.e., searching for responses) and executive decision-making (i.e., response selection) [26] more so than the orienting network proposed by [8]. We base this assertion on consistent pathology and decreased brain activity noted in the cerebellum of ASD individuals as summarized in a review by [27].
MATERIALS AND METHODS
Participants
Six high-functioning ASD (Mean age: 17.33 years, 4 males/ 2 females, ADOS scores ranging from 7 to 21) and six NT adolescents (Mean age: 15.83 years, 4 males/ 2 females) performed the Child ANT while undergoing fMRI scanning. Clinical diagnoses were confirmed using the Autism Diagnostic Observation Schedule (ADOS). The ASD group did not display significant motion artifacts for any participants and standard preprocessing motion correction using MCFLIRT was performed on all subjects. The response rate was 100% for both groups. Per parent-report, participants in the NT group were free of ASD-related symptoms or any other neurological or psychiatric conditions. Participants provided informed consent and received $25 compensation for their involvement in the study. All participants had normal or corrected-to-normal vision and were right-handed. Informed written consent was obtained from all participants before scanning. This study was approved by the Institutional Review Board (IRB) of Texas Tech University.
The Modified Child ANT Task
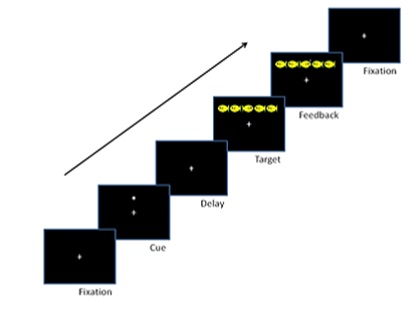
Six high-functioning ASD and six NT adolescents performed the Child ANT while fMRI images were acquired via a Siemens 3T Skyra. A modified version of the Child ANT was developed for use inside of the scanner and was presented using ePrime 2.0. Each session lasted 30 minutes and consisted of 3 blocks of 48 trials. Stimuli were presented for 2 second-intervals in an event-related design. Participants were told to “feed the fish” by pressing fiber optic buttons (left or right index finger) that matched the direction the target fish was facing. Trials began with a fixation cross followed by 1 of 4 trial types, each indexing the efficiency of alerting, orienting and executive attention by presenting stimuli in 4 different cueing conditions: no cue, central cue, double cue, and spatial cue. On no cue trials, the target fish appeared alone; central cue, an asterisk was presented at the same location as the fixation cross; double cue, an asterisk appeared simultaneously above/below the fixation cross; spatial cue, a single asterisk was presented in the same position as the target fish. On executive trials two flanker fish appeared to the left/right of the target, oriented either congruently/incongruently (i.e., pointing in the same/opposite direction, Fig. 1).
Analyzing Behavioral Data
Response time (RT) and accuracy were calculated for each attentional subcomponent using the methodology developed by [10] alerting (no cue - center cue), orienting (center cue - spatial cue) and executive (congruent flanker - incongruent flanker). A 2(group) x 3(attention type) mixed-design analysis of variance (ANOVA) was performed for the RT and accuracy data.
Analyzing BOLD fMRI Data
Functional images were acquired via a Siemens 3T Skyra (located at the Texas Tech Neuroimaging Institute; TR=2000ms; TE=20; FOV=240 mm; Flip angle=80; Voxel size: 3x3x4 mm; axial slices=34). Structural 3D high resolution T1 images were acquired using same orientation as the functional sequences (0.9X0.9X0.9 mm). Functional data analyses were carried out using the fMRI Expert Analysis Tool (FEAT) in FSL. Imaging preprocessing involved removing non-brain structures by Brain Extraction Tool (BET), motion correction by using MCFLIRT, temporally high-pass filtered with a cutoff period of 100s, spatial smoothing with a 5mm Gaussian FWHM algorithm and co-registration of the fMRI data to anatomic images with each subject and MNI 152 standard brain space.
The Child ANT paradigm was presented using ePrime with a random ordering of trials per session. The log files for each session were interrogated to determine the order of trials and an onset time vector was generated for each of the six conditions in that session. The design matrix was constructed to model the three attention conditions at the individual level, by segregating images according to attention/trial type (i.e., alerting, orienting, and executive). These vectors were grouped according to the above three network definitions and saved along with duration values and condition labels for importation during the First Level Analysis (FLA). Since this study was event-driven, durations were determined from the log files, as they were dependent on participant responses. A summary of the fMRI contrasts used to determine each subcomponent network is given in Table 1.
| Alerting Network | T-contrast of No Cue > Double Cue |
| Executive Network | T-contrast of Flanker Incongruent > Flanker Congruent |
| Orienting Network | T-contrast of Center Cue > Spatial Cue |
In the group level analyses, average brain activations across participants and contrasts between groups were conducted using the FMRIB Local Analysis of Fixed Effects tool (FLAFE) and activation was thresholded using clusters determined by z >2.3 at Pcorrected<0.05 (default FWE correction in FSL).
RESULTS
Behavioral Data
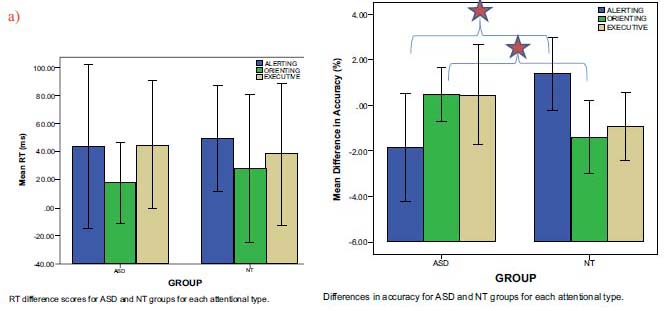
A 2(group) x 3(attention type) mixed-design analysis of variance (ANOVA) on the accuracy data revealed no significant main effects, but did reveal a significant Group x Attention Type interaction (F= (2, 20) =6.307, p < 0.01). A 2 (group) x 3 (attention type) mixed-design ANOVA on the RT data revealed no significant main effects and no significant interactions with attention type (Fig. 2a). Post-hoc comparisons of least significant difference test (LSD) (p < 0.05) showed a significant difference on alerting and orienting accuracy between the ASD and NT groups (Fig. 2b). Specifically, ASD participants (M=-1.852, 95% CI [-3.609,-0.095]) were more accurate than NT participants (M=1.389, 95% CI [-0.368, 3.146]) on alerting trials, while NT participants (M=-1.389, 95% CI [-2.610, -0.168]) were more accurate than ASD participants (M=0.463, 95% CI [-0.758, 1.684]) on orienting trials. There was no significant difference between the groups on executive trials. NT and ASD adolescents showed no difference in RT for any of the three attentional networks.
 Indicates Post-hoc comparisons of least significant difference test (LSD) (p<0.05)
FMRI Data
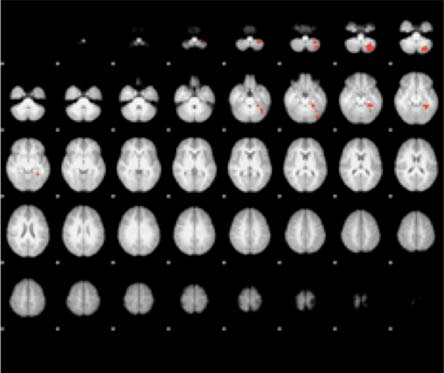
(Fig. 3) presents the activation areas of significant contrast for the ASD versus NT adolescents. In the alerting attention condition, more activation was found for the NT group in the left cerebellum (i.e. the left inferior semi-lunar lobule, the left pyramis, the left culmen, and the left declive) and in the left parahippocampal gyrus (Brodmann Areas (BA) 19 and 36). No significant differences in alerting activation were found in the ASD minus NT contrast. For orienting attention, the ASD group was significantly more active than the NT group in the bilateral MFG (BA 9 and BA 10), the right SFG (BA 10) and the left ACC (BA 32). Again, no significant activation differences were found between groups for the ASD minus NT contrast. For executive attention, the ASD group was significantly more active than the NT group bilaterally in the anterior cerebellum. The NT minus ASD contrast revealed no significant differences in activation between the two groups. Table 2 lists the exact coordinates of activation for each of the three attention types as a function of ASD versus NT contrasts.
| Condition | Region | Brodmann Area | X | Y | Z | Z-score |
|---|---|---|---|---|---|---|
| Alerting: ASD > NT | None | - | - | - | - | - |
| Alerting: NT > ASD | L ISL | - | -30 | -66 | -46 | 3.39 |
| L Pyr | - | -28 | -74 | -44 | 3.25 | |
| L Cul | - | -24 | -36 | -16 | 3.96 | |
| L PHG | 19 | -36 | -40 | -12 | 3.53 | |
| 36 | -24 | -36 | -16 | 3.36 | ||
| L Dec | - | -38 | -54 | -24 | 3.10 | |
| Orienting: ASD > NT | R MFG | 9 | 8 | 46 | 20 | 3.44 |
| 10 | 10 | 50 | 14 | 3.04 | ||
| L MFG | 10 | -8 | 50 | 16 | 3.00 | |
| R SFG | 10 | 18 | 56 | 16 | 2.97 | |
| L ACC | 32 | 0 | 52 | 14 | 2.88 | |
| Orienting: NT > ASD | None | - | - | - | - | - |
| Executive: ASD > NT | L ACe | - | -6 | -42 | -42 | 3.35 |
| R ACe | - | 14 | -36 | -42 | 3.15 | |
| Executive: NT > ASD | None | - | - | - | - | - |
DISCUSSION
Our behavioral and imaging findings are, overall, consistent with previous investigations of ASD that used the ANT or Child ANT [11, 13, 14, 25, 28] with some minor differences that may be explained by the high-functioning nature of our participants [23] or their age [20]. Consistent with our hypothesis, the ASD group showed significantly more activity in brain regions that are commonly associated with executive processes of attention during the orienting task (e.g., bilateral MFG [BA 9 and BA 10], the right SFG [BA 10] and the left ACC [BA 32] [8], suggesting an increased reliance on executive functions in an attempted compensation of a dysfunctional orienting network. These regions have been indicated by [29] to be involved in a subset of executive control that is responsible for sustained maintenance signals. Such over-activation of this network would reasonably result in fixation on a given signal, leading to an inability to shift attention, which in turn would lead to lower accuracy on an orienting task. This resulting fixation would not only explain the lower accuracy seen here, it has been previously reported in young children with ASD [30].
Somewhat surprisingly, the ASD adolescents in this study were more accurate than NTs on alerting trials suggesting that they were better able to “detect” the occurrence of an event in the environment. The only significant contrasts noted from our fMRI results for this task showed decreased left-hemispheric cerebellar (left inferior semi-lunar lobule, left pyramis, left culmen, left declive) and parahippocampal activations (BA 19 and 36). This may seem somewhat puzzling as alerting function was previously ascribed to be mediated by the locus coeruleus, and the right parietal and frontal lobes; not the cerebellum [8]. The role of the cerebellum, however, is not without precedent in attention circuitry, especially with regard to visual tasks. Gottwald et al., [31] demonstrated that patients with focal cerebellar lesions showed distinct deficits in a divided attention task. Schweizer et al., [32] went even further to provide evidence for the role of the cerebellum in visuotemporal attention by reporting an increased magnitude of attentional blink in patients with chronic focal cerebellar lesions. This hemispheric lateralization previously seen in other studies of alerting may support the left-sided lateralization seen here as a probable component of the greater accuracy observed in ASD adolescents during the alerting phase of the Child ANT. For a full review of the cerebellum’s known role in attention and its implications in ASD, see [27].
CONCLUSION
Similar to previous studies, it was seen that deficits of the subcomponents of attention represent a common occurrence in ASD. To our knowledge, this is the first study to investigate attention networks in ASD adolescents using a combination of fMRI and the Child ANT. Here, high-functioning ASD adolescents were found to have enhanced alerting abilities, deficient orienting, and comparable levels of executive functioning when performing the Child ANT. fMRI contrasts of the ASD and NT groups during task performance lead us to suggest that the observed differences are underlined by aberrant task-related brain processing efficiency. ASD adolescents were shown to have markedly reduced brain activity in areas related to the alerting task despite their superior accuracy. Conversely, they were shown to exhibit heightened activity in areas related to sustained maintenance signals during the orienting task; likely representing fixation that led to lowered accuracy. This finding is particularly significant as it serves as a probable candidate for the highly sought after neurocorrelates that underlie the often cited excessive fixation displayed by ASD individuals that are noted by a deficit in orienting [15], but were otherwise previously elusive [11].
LIMITATIONS
Limitations of this study include its specified age range, its use of a fixed effects model for BOLD fMRI analysis, and its lack of biomarkers to further classify participants into subgroups; as is becoming a consistent standard for neuroimaging studies [33]. A fixed effects model was used as it would allow for a more accurate analysis of how attentional processing may be affected in these specific individuals. The small sample size for each group is due in part to the difficulty of identifying individuals who are high-functioning enough to complete this task within an MRI scanner, yet are still symptomatic. Furthermore, the sample size is still within common practice for BOLD fMRI studies. This may, however, limit the generalizability of our observations to the adolescent ASD population as a whole.
COMPLIANCE WITH ETHICAL STANDARDS
Funding
This research is funded through a donation from Allen and Linnie Howard. We would like to acknowledge and thank the Howards for their generous contribution.
Ethical Approval
All procedures performed in studies involving human participants were in accordance with the ethical standards of the institutional and/or national research committee and with the 1964 Helsinki declaration and its later amendments or comparable ethical standards. Informed consent: Informed consent was obtained from all individual participants included in the study.
CONFLICT OF INTEREST
The authors confirm that this article content has no conflict of interest.
ACKNOWLEDGEMENTS
This research is funded through a donation from Allen and Linnie Howard. We would like to acknowledge and thank the Howards for their generous contribution. We would also like to thank Justin Brough, Catherine Chesnutt, Dipika Patel, Bryan Schiller, Courtney Kastner, Omatsolu Mene-Ejegi, Amanda Bosch, and Wesley Dotson for their assistance.

