All published articles of this journal are available on ScienceDirect.
Manganese-enhanced MRI Offers Correlation with Severity of Spinal Cord Injury in Experimental Models
Abstract
Background:
Spinal cord injuries (SCI) are clinically challenging, because neural regeneration after cord damage is unknown. In SCI animal models, regeneration is evaluated histologically, requiring animal sacrifice. Noninvasive techniques are needed to detect longitudinal SCI changes.
Objective:
To compare manganese-enhanced magnetic resonance imaging (MRI [MEMRI]) in hemisection and transection of SCI rat models with diffusion tensor imaging (DTI) and histology.
Methods:
Rats underwent T9 spinal cord transection (n=6), hemisection (n=6), or laminectomy without SCI (controls, n=6). One-half of each group received lateral ventricle MnCl2 injections 24 hours later. Conventional DTI or T1-weighted MRI was performed 84 hours post-surgery. MEMRI signal intensity ratio above and below the SCI level was calculated. Fractional anisotropy (FA) measurements were taken 1 cm rostral to the SCI. The percentage of FA change was calculated 10 mm rostral to the SCI epicenter, between FA at the dorsal column lesion normalized to a lateral area without FA change. Myelin load (percentage difference) among groups was analyzed by histology.
Results:
In transection and hemisection groups, mean MEMRI ratios were 0.62 and 0.87, respectively, versus 0.99 in controls (P<0.001 and P<0.001, respectively); mean FA decreases were 67.5% and 40.1%, respectively, compared with a 6.1% increase in controls (P=0.002 and P=0.019, respectively). Mean myelin load decreased by 38.8% (transection) and 51.8% (hemisection) compared to controls (99.1%) (P<0.001 and P<0.001, respectively). Pearson’s correlation coefficients were -0.94 for MEMRI ratio and FA changes and 0.87 for MEMRI and myelin load.
Conclusion:
MEMERI results correlated to SCI severity measured by FA and myelin load. MEMRI is a useful noninvasive tool to assess neuronal damage after SCI.
INTRODUCTION
Every year, 12,500 cases of spinal cord injury (SCI) occur in the United States. The majority of patients are young, active individuals in their fourth decade of life [1]. Despite significant scientific and clinical effort over the past century, little is known about treatment paradigms to improve SCI outcome beyond natural history [2, 3]. Ongoing and future experimental studies are anticipated to improve our understanding of mechanisms of SCI or to suggest therapeutic interventions. Better quantification of the injury severity in SCI yields an improved understanding of the recovery potential for patients with a similar degree of neurological dysfunction. Such quantification approaches will allow us to enroll more homogeneous populations and improve the study structure in future clinical trials for SCI, for which effective treatments have been woefully lacking [4].
Currently, histologic assessment is the gold standard for evaluating the severity of an SCI and for determining the effectiveness of investigated treatment modalities [5, 6]. Thus, in laboratory studies, a substantial number of animals are required for sacrifice at different time points during the experiment for longitudinal analyses of histologic changes. Magnetic resonance imaging (MRI) techniques, such as diffusion tensor imaging (DTI), have the potential to provide information on the functional status of the spinal cord, as well as fiber integrity, without or with minimal animal sacrifice. For example, DTI has been used to demonstrate neural tract integrity after SCI [7, 8].
Manganese-enhanced MRI (MEMRI) has been widely implemented to assess different fiber tracts in the brain [9, 10]. Mn2+ exhibits electrochemical properties similar to Ca2+ and is transported via calcium voltage-gated channels [11, 12]. As manganese distributes along the functionally active tracts, these tracts can be visualized on T1-weighted MRI as a hyperintense signal [13, 14]. Our previous study showed a correlation of T1-weighted signal intensity and manganese concentration in the setting of SCI [15].
A correlation between MEMRI, DTI and histology has not yet been shown. To determine whether MEMRI could be used to assess SCI as effectively as histology, we compared MEMRI with DTI and histologic assessment in hemisection and transection animal models of SCI.
MATERIALS AND METHODS
Eighteen adult female Sprague-Dawley rats (8 weeks old, weight = 300 g) were used in this study. All animal experiments were performed in accordance with the National Institutes of Health Office of Laboratory Animal Welfare guidelines and were approved by the Institutional Animal Care and Use Committee of Barrow Neurological Institute and St. Joseph’s Hospital and Medical Center, Phoenix, Arizona.
Study Groups
Rats in this study were evenly distributed among 6 groups with 3 rats per group: transection SCI with manganese chloride (MnCl2) injection (SCIT+Mn); transection SCI without MnCl2 injection (SCIT–Mn); hemisection SCI with MnCl2 injection (SCIH+Mn); hemisection SCI without MnCl2 injection (SCIH–Mn); control rats without SCI and with MnCl2 injection (Control+Mn); control rats without either SCI or MnCl2 injection (Control–Mn). Control animals underwent T9 laminectomy without SCI.
Animal Surgery and Spinal Cord Injury Models
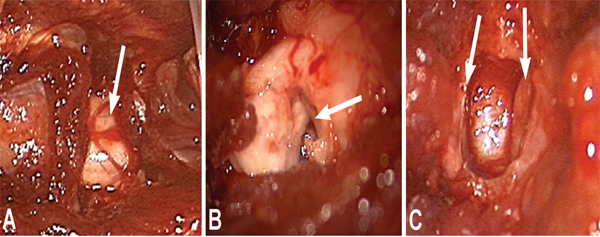
Rats were adequately anesthetized with an intramuscular injection of ketamine, xylazine, and acepromazine cocktail. Hairs above the spine were clipped and the skin was cleansed with iodine. The T9 spinal level was localized with intraoperative fluoroscopy and marked with a skin marker. Each rat was placed in a supine position on a heating pad to maintain core body temperature. Oxygen was supplied via nasal cannula. The skin was prepared and draped in standard sterile fashion. An operative microscope was used for the procedure. A midline incision was performed and muscle dissection was carried out to expose the lamina of the T9 level. A laminectomy was performed with a 2-mm bone rongeur. The dura was opened longitudinally in the midline with a scalpel and reflected laterally with forceps. Hemisection and transection models of SCI were used. For the hemisection model (SCIH±Mn groups), the left hemicord was transected with a scalpel, leaving the right hemicord intact. For the transection model (SCIT±Mn groups), the spinal cord was fully transected (Fig. 1). Hemostasis was achieved with irrigation and application of small wet cotton balls. The wound was closed in multiple layers and animals were observed until they recovered from anesthesia. Animals received antibiotic injection and pain control in the immediate postoperative period. Their urinary bladders were expressed every 8 hours.

Manganese Chloride Injection
Twenty-four hours after SCI, the animals in the SCIT+Mn, SCIH+Mn, and Control+Mn groups were anesthetized again and prepared for MnCl2 injection. Cranial hair was clipped and the scalp was cleansed with iodine. The head was affixed to a stereotactic frame. A longitudinal midline scalp incision was performed to expose the bregma. A high-speed drill was used to place two boreholes 2 mm caudal from the bregma and 2 mm lateral to both sides. An automatic microinjector with a 5-μL Hamilton syringe was affixed to the stereotactic frame. The needle was slowly advanced to a depth of 3 mm at each borehole sequentially, which provided access to the lateral ventricle in all animals. A 2-μL volume of 0.2 mol/L MnCl2 was injected into each lateral ventricle over a period of 5 minutes to allow accommodation of the injected fluid into the ventricle. The needle was slowly removed to avoid cerebrospinal fluid (CSF) or MnCl2 backflow.
Sixty hours after MnCl2 injection (84 hours after SCI surgery), all animals were anesthetized and received a transcordal perfusion of a mixture of 50 mL of normal saline and 1,000 units of heparin, followed by 50 mL of 4% paraformaldehyde. Spinal columns were removed for further imaging and preserved in 4% paraformaldehyde solution.
MRI and Image Analysis
Ex vivo MRI was performed using a 7-T, small-animal, 30-cm, horizontal-bore magnet and BioSpec Avance III spectrometer (Bruker, Billerica, MA) with a 116-mm high-power gradient set (600 mT/m) and a 30-mm whole-body quadrature volume coil. Prior to imaging, each spinal column was secured in a custom-made holder, which was then filled with a perfluoropolyether fluid, Galden (Solvay Solexis, Houston, TX), which is invisible on MRI and produces no background signal.
T1-weighted spoiled gradient-echo images were acquired 60 hours after MnCl2 injection (repetition time [TR] = 361 ms, echo time [TE] = 6.7 ms, flip angle = 40°, matrix = 1,024 × 1,024, 78 × 29 ×500 micron voxels, number of excitations [NEX] = 2). DTI imaging was performed in animals without MnCl2 injection (spin-echo, TR = 12.5 s, TE = 27 ms, matrix = 128 × 128, 195 × 195 × 1,000 micron voxels, NEX = 2, 16 diffusion direction, b-value = 2,000 s/mm2).
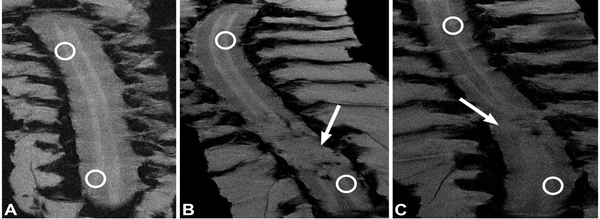
MEMRI T1-signal intensities of the spinal cord 10 mm rostral from the SCI epicenter (T9 level in control animals) were calculated and normalized to the paravertebral muscle intensities using ImageJ software. The ratio between spinal cord signal intensity above and below the SCI was calculated. A ratio value approaching 1 signified minimal signal change between areas of spinal cord where measurements were taken (Fig. 2).

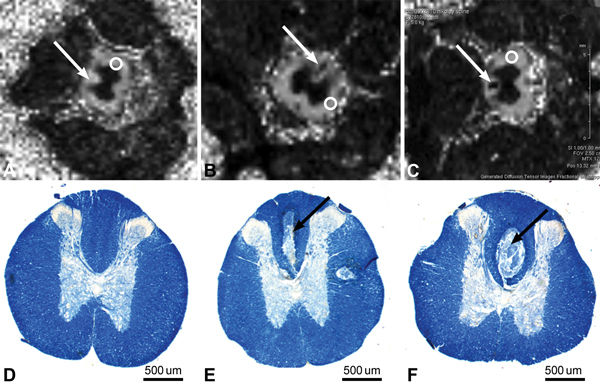
Diffusion data were analyzed using Bruker ParaVision 5.0 software. From the diffusion-weighted images, 3 eigenvectors and their corresponding eigenvalues (λ1, λ2, and λ3) representing the main diffusion directions and magnitude of diffusivity were calculated for each voxel. Fractional anisotropy (FA) maps were calculated from the 3 eigenvalues. Region-of-interest measurements were taken 10 mm rostral to the SCI epicenter. The FA in the dorsal column lesion area was normalized to the lateral white matter area that showed no change in FA (Fig. 3).

Histology
After MRIs were performed, the spinal specimens were further processed for histologic analysis. In each specimen, the bony elements were removed and the segment of the spinal cord corresponding to the SCI area (T9 level in control animals) and 10 mm rostral was excised for paraffin embedding. Tissues from the SCI epicenter and approximately 10 mm rostral were cut into 15-μm sections. Luxol fast blue, a myelin stain, was used to assess myelin damage [16]. The optical density of Luxol fast blue staining in the rat spinal cord was determined in the SCI epicenter. The optical density at 10 mm rostral to the T9 injury epicenter was also measured as a control. The percentage difference of myelin load at the injury epicenter between SCI and control animals was calculated in groups receiving MnCl2 injections.
Data Analysis
MEMRI T1-signal intensity ratio, DTI FA, and myelin load percentage differences were calculated and compared among study groups. Data were processed using Microsoft Excel. (Microsoft, Inc., Redmond, WA) and Statistica (Dell Statistica, Tulsa OK). The one-way ANOVA test and the post hoc ANOVA Bonferroni test were used for data analysis, with results considered significant if P <0.05. Pearson’s correlation coefficient was calculated to evaluate the correlation between the MEMRI T1-signal intensity ratio, DTI FA and myelin load percentage differences.
RESULTS
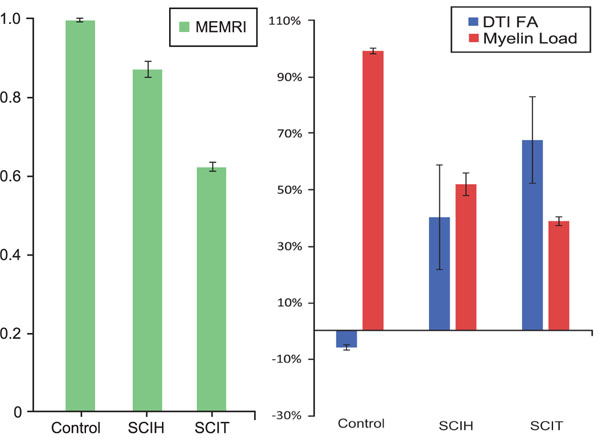
The mean T1-signal intensity ratio in the Control+Mn group was 0.99, which was significantly higher than in the SCIT+Mn (0.62) and SCIH+Mn (0.87) groups (PANOVA <0.001; post hoc ANOVA P<0.001 and P<0.001, respectively). The mean T1-signal intensity ratio in the groups without MnCl2 injection did not show statistically significant differences (PANOVA <0.016); Control–Mn (0.98); SCIT–Mn (0.97); SCIH–Mn (0.98) (Fig. 4), (Table 1).

| Control | SCIH | P value (Control vs. SCIH) | SCIT | P value (Control vs. SCIT)* | |
|---|---|---|---|---|---|
| MEMRI† | 0.99±0.003 | 0.87±0.02 | <0.001 | 0.62±0.01 | <0.001 |
| DTI FA‡ | –6.1%±0.9% | 40.1%±18.5% | 0.019 | 67.5%±15.3% | 0.002 |
| Myelin load† | 99.1%±1.0% | 51.8%±4.0% | <0.001 | 38.7%±1.5% | <0.001 |
The mean FA percentage increase in Control–Mn animals was 6.1%. The SCIT–Mn and SCIH–Mn groups had 67.5% and 40.1% FA percentage decreases, respectively (PANOVA=0.04; post hoc ANOVA P=0.002 and P<0.019, respectively, compared to controls) (Fig. 4), (Table 1).
The myelin loads in all animals at the spinal cord level 10 mm rostral to T9 were only minimally different. The SCIT+Mn and SCIH+Mn animals showed 38.7% and 51.8% myelin loads, respectively, compared to similar T9 spinal cord of Control+Mn animals (PANOVA=0.04; post hoc ANOVA P<0.001 and P<0.001, respectively) (Fig. 4), (Table 1).
The Pearson correlation coefficients were 0.87 (P=0.002) for MEMRI T1-signal intensity ratio and myelin load, –0.94 (P=0.0001) for FA percentage change and myelin load, and –0.90 (P=0.001) for MEMRI T1-signal intensity ratio and FA percentage change.
DISCUSSION
While neuronal degeneration and regrowth is often evaluated by histologic means, noninvasive methods that provide functional assessments over time are needed for a more complete understanding of SCI status. The use of MEMRI T1-signal intensity ratio in rat transection and hemisection SCI models in this study demonstrates that MEMRI offers a correlation with severity of SCI.
Successful research on SCI requires a well-defined and efficient animal model (i.e., a model that uses the fewest possible animals) for studying the basic mechanisms of cord injuries as well as potentially effective clinical therapies. Traditionally, rodent SCIs are modeled using a mid-thoracic (~T9) cord lesion of various types. Lesions are typically either contusive/compressive or transsectional, with the latter including both incomplete and complete dissections [17]. Spinal hemisections can be a particularly useful and efficient approach to studying SCIs, because there is an internal control on the side contralateral to the lesion [18]. In our experiments, we used the transection model as the most extreme injury severity and the hemisection model to represent moderate SCI. While it is recognized that contusion-type injury is the most common type of SCI in clinical settings, tearing and separation of fibers also occur within the scope of contusion-type injuries. Thus, although the use of transection and hemisection models limits our results because they do not solely represent the typical SCI in human patients, the hemisection and transection models do provide consistent and controlled spinal cord tissue damage. In addition, for this exploration, the model used allowed us to gain preliminary correlational evidence.
Histologic examination of rat spinal cord tissue has revealed differences in gray and white matter injury progression at multiple time points post-injury in a controlled contusion rat model [19]. There was a significant loss of gray and white matter 24 hours post-injury in our study. We performed imaging in rat specimens 84 hours after SCI, which is sufficient time to cause significant spinal cord tissue damage that can be detected by histology and potentially with MRI techniques.
MEMRI can provide information on the functional activity of neural tissue. The chemical properties of Mn2+ resemble those of Ca2+, allowing it to be transported through voltage-gated Ca2+ channels in neurons [20-22]. Mn2+ is paramagnetic and causes robust T1 shortening in tissue water that shows up as strong enhancement on MRI [12]. Systemic injection of MnCl2 into the CSF allows for assessment of activity-dependent uptake [13, 15, 23]. The uptake depends on the functional activity of the spinal cord: uptake by functionally active neurons is greater than uptake in damaged or inactive neurons [24, 25]. A previous study has shown that MEMRI signal from Mn2+ injected into the ventricles correlated to functional assessment in a rat SCI model [23]. The rate of transport is much higher than axonal transport could account for, indicating that the transport occurred through the CSF, with local activity-dependent uptake into the gray matter. The comparison of MEMRI results to images acquired after injection of a different, non-Ca2+-like contrast agent, gadolinium-DTPA, showed that MEMRI results could not be explained by simple disruption of the CSF system due to the injury. MEMRI was compared to total Mn2+ content measured by inductively coupled plasma mass spectrometry (ICP-MS) in a full transection SCI rat model [15]. The intensity of the gray matter signal in T1-weighted MRI and the ICP-MS-measured Mn2+ was significantly decreased below the injury site. The MRI signal intensity corresponded with Mn2+ levels from the cervical to the lumbar sections of the spine.
MEMRI can also be used to study axonal transport by injecting the agent directly into the white matter [26]. However, these images also contain a strong gray matter enhancement that indicates that significant gray matter uptake must also play a role in these results. Also, performing a focal injection into the spinal cord can be challenging and requires an additional laminectomy.
There are few Mn2+ delivery routes described in previous reports. The direct spinal cord intramedullary Mn2+ injection provides selective neural tract tracing with MEMRI [27]. However, direct Mn2+ injection may cause damage to the spinal cord. Other alternatives include Mn2+ injection into the cisterna magna and lateral ventricles [15, 23, 25, 28]. Both cisterna magna and lateral ventricle injections provided reliable enhancement of uninjured spinal cord. The time frame for MEMRI after cisterna magna and lateral ventricle injections has been previously shown to be optimal at 60 hours [23]. In our previous study, we demonstrated a correlation between T1-signal intensity manganese concentration measured by ICP-MS after an intraventricular Mn2+ injection [15].
Another MRI method that can be used to assess white matter status is DTI, which provides a method to measure directional water diffusion in the white matter tracts [29-32]. While normal water diffusion is isotropic in all directions in an unbounded space, in a case where there is structure that restricts the water molecule’s movement, the diffusion will become more anisotropic. An example of this restricted diffusion is that within an axon, where the diffusion can travel along the distance of the axon with relative freedom, while the membrane walls restrict diffusion along the width of the axon, DTI can measure the degree of anisotropy that is quantified by the parameter FA. In the spinal cord, FA has been shown to correspond to axonal integrity and can be used to follow white matter injury progression [30-32]. Further assessment of how our imaging results relate to the underlying tissue pathology was performed with histologic staining for myelin. The change in myelin load was then compared to the imaging results and all three measures were correlated to injury severity. In our study, MEMRI, DTI, and myelin load showed strong correlations with severity of SCI.
In addition to the alterations in white matter FA due to injury, DTI also revealed focal lesions in the dorsal columns, both caudal and rostral to the injury site. Other groups have previously reported similar lesions revealed by DTI [26]. Similar lesions appeared in tissue stained for myelin content, providing evidence that the FA alteration corresponds to myelin content.
Manganese overdose results in damage to the nervous system, liver, and heart. The most common symptom of manganese intoxication is tremor caused by damage of basal ganglia. Thus, cautious use of manganese is warranted [22, 33].
CONCLUSION
A major advantage of the MEMRI approach is the ability to study spinal cord injury longitudinally through the injury and recovery period of a laboratory animal. This technique may not only provide a more accurate picture of injury evolution but may also reduce the number of animals necessary to perform a particular experiment. Our results showed that MEMRI correlates to DTI and histology at a single time point.
LIST OF ABBREVIATIONS
| CSF | = Cerebrospinal fluid |
| DTI | = Diffusion tensor imaging |
| FA | = Fractional anisotropy |
| ICP-MS | = Inductively coupled plasma mass spectrometry |
| MEMRI | = Manganese-enhanced MRI |
| MRI | = Magnetic resonance imaging |
| NEX | = Number of excitations |
| SCI | = Spinal cord injury |
| SCIH | = Hemisection SCI |
| SCIT | = Transection SCI |
| TE | = Echo time |
| TR | = Repetition time |
CONFLICT OF INTEREST
The authors confirm that this article content has no conflict of interest.
ACKNOWLEDGEMENTS
This work was supported in part by funds from the Newsome Family Endowed Chair in Neurosurgery Research held by Dr. Preul.


