REVIEW ARTICLE
Contrast Mechanisms for Tumor Cells by High-frequency Ultrasound
Yada Juntarapaso1, Chiaki Miyasaka2, Richard L. Tutwiler1, Pavlos Anastasiadis3, 4, *
Article Information
Identifiers and Pagination:
Year: 2018Volume: 12
Issue: Suppl 1: M4
First Page: 105
Last Page: 119
Publisher ID: TONIJ-12-105
DOI: 10.2174/1874440001812010105
Article History:
Received Date: 12/3/2018Revision Received Date: 20/5/2018
Acceptance Date: 28/5/2018
Collection year: 31/12/2018

open-access license: This is an open access article distributed under the terms of the Creative Commons Attribution 4.0 International Public License (CC-BY 4.0), a copy of which is available at: https://creativecommons.org/licenses/by/4.0/legalcode. This license permits unrestricted use, distribution, and reproduction in any medium, provided the original author and source are credited.
Abstract
Scanning Acoustic Microscopy (SAM) is a powerful technique for both the non-destructive determination of mechanical and elastic properties of biological specimens and for the ultrasonic imaging at a micrometer resolution. The implication of biomechanical properties during the onset and progression of disease has been established rendering a profound understanding of the relationship between mechanoelastic and biochemical signaling at a molecular level crucial. Computer simulation algorithms were developed for the generation of images and the investigation of contrast mechanisms in high-frequency and ultra-high frequency SAM. Furthermore, we determined the mechanical and elastic properties of HeLa and MCF-7 cells. Algorithms for simulating V(z) responses were developed based on the ray and wave theory (angular spectrum). Theoretical simulations for high-frequency SAM array designs were performed with the Field II software. In these simulations, we applied phased array beam formation and dynamic apodization and focusing. The purpose of our transducer simulations was to explore volumetric imaging capabilities. The novel transducer arrays designed in this research aim at improving the performance of SAM systems by introducing electronic steering and hence, allowing for the 4D imaging of cells and tissues.
1. INTRODUCTION
In order to achieve high-resolution ultrasound cellular and tissue imaging, high-frequency ultrasound transducer arrays are currently designed for Scanning Acoustic Microscopy (SAM). It is widely accepted that high-frequency and ultra-high frequency SAM is a very powerful technique capable of determining and studying biomechanical properties of single cells at a subcellular resolution including the nucleus, cytoplasm, and cytoskeleton [1, 2]. SAM is also a non-invasive method requiring no chemical staining or fixation for qualitative and quantitative measurements of mechanical properties of biological cells and tissues [3]. Additionally, SAM is capable of resolving individual cells and organelles at ultra-high frequencies above 600 MHz [4, 5]. Time-resolved SAM has a significant advantage over other acoustic microscopy techniques in that mechanoelastic properties (e.g., thickness, sound velocity, acoustic impedance, density and attenuation) of living cells can be directly obtained [1]. Determining mechanoelastic properties, allows for these features to be integrated into computer models and simulations that, in turn, can be used to better comprehend ultrasound scattering and attenuation effects in biological systems. However, SAM faces limitations with regard to spatial resolution; in order to overcome these limitations in the spatial resolution of conventional phase-resolved acoustic microscopy, Shekhawat and Dravid demonstrated the use of two-frequency ultrasonic holography for measuring time-resolved variations in ultrasonic oscillations at a sample surface [6, 7].
For high-frequency and ultra-high frequency acoustic microscopy applications in the range between 100 MHz and 1 GHz, thin-film, single element transducers have been commonly employed. For example, single-element high-frequency transducers in the range between 100 and 300 MHz with thin ZnO films have been developed for use in mechanical SAM systems [8, 9]. On the other hand, transducer arrays have not yet been thoroughly explored. Ito et al. developed 100 MHz linear transducer arrays using ZnO thin-films for applications in non-destructive testing and for SAM by preparing ZnO film layers approximately 10 µm thick for an operation frequency of 100 MHz [8]. Transducer arrays were fabricated for exploring the ultrasound beam forming characteristics [8, 9].
In this paper, we developed algorithms and performed computer simulations using Matlab (MathWorks, Natick, MA, USA). The simulations aimed at investigating contrast mechanisms obtained by high-frequency time-resolved SAM. The mechanical properties of HeLa and MCF-7 cells were calculated from the V(z) responses and radio-frequency (RF) data sets. Simulations of V(z) responses involved the calculation of the reflectance function for layered models including the coupling medium, cell or tissue specimen and the substrate. Furthermore, theoretical simulations of the high-frequency ultrasound array designs for SAM were performed using Field II. We included phased array beamforming and dynamic apodization and focusing. The goal of the transducer simulations was to achieve improved image resolution, volumetric imaging, and 4D imaging generation of the cells.
2. THEORY
2.1. Time-resolved Acoustic Microscopy
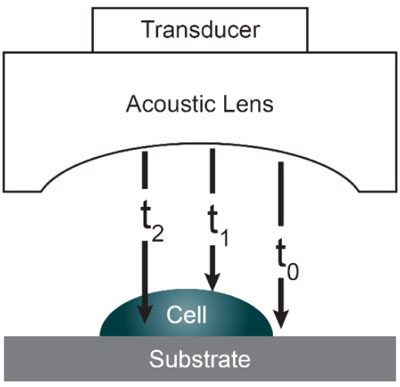
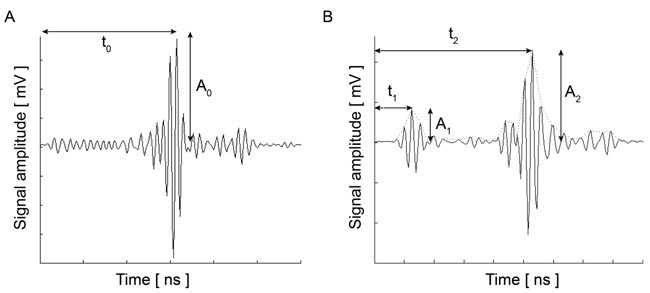
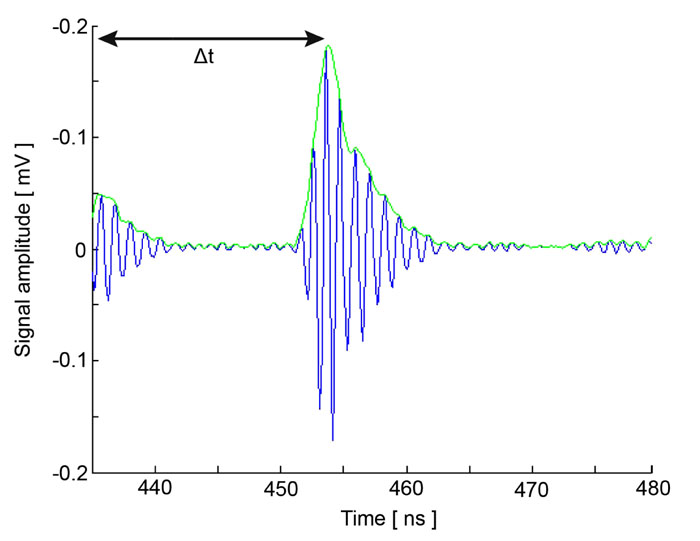
Acoustic microscopy was first developed in 1972 by Lemons and Quate at Stanford University for cellular imaging with a nearly optical resolution [5, 10, 11]. Since then, it has been used for mapping the elasticity of biological samples [4, 12, 13]. Biomechanical properties (e.g., thickness, longitudinal sound speed, density, acoustic impedance, elasticity, attenuation) of cells and tissues can be determined using the time-resolved technique. This technique relies on echoes reflected from the sample and the interface between the sample and its substrate. Fig. (1) illustrates the functioning concept of time-resolved acoustic microscopy. A reference signal (t0 ) is acquired from the reflected echo when the transducer is at focus. The arrival time of the echo reflected off the cell surface is defined as t1 while the arrival time of the echo reflected from the cell/substrate interface is defined as t2.
Since the arrival times originating from the surface of the sample and the substrate/sample interface are only separated by a few nanoseconds (in the ultra-high frequency regime), it is of paramount importance to be able to separate the echo signals in the time domain. This is achieved by emitting sufficiently short pulses so that the reflected signals do not overlap [1]. The mechanical and elastic properties can be determined using time-resolved techniques [1]. We define τ1 to be the time delay between the surface and the reference echoes (τ1 = t0 – t1), τ2 the time delay between the interface and the reference echoes (τ2 = t0 – t2), and τ12 the time delay between the interface and the surface echoes (τ12 = t2 – t1). By applying a simple mathematical optics formula, the cell thickness, d, at any scanning position coordinates (x, y) can be computed using Eq. (1), when the sound velocity in the coupling medium, c0, is known. Following the calculation of the cell thickness at given coordinates, the longitudinal sound velocity, c, can then be determined using Eq. (2) as follows [1]:
 |
(1) |
 |
(2) |
The acoustic impedance of the sample can be derived based on the amplitude of the reference signal reflected from the coupling medium and the substrate interface, A0; the amplitude of the substrate/cell echo signal, A1; and the acoustic impedance of the coupling medium, Z0 from Eq. (3) [1]:
 |
(3) |
It is noted that the acoustic impedance of the coupling medium needs to be known a priori. Typically, cell and tissue media or buffer solutions used for coupling purposes exhibit very close viscoelastic properties to water at given temperatures, therefore this requirement does not pose any technical limitations.
Once the ultrasound velocity and acoustic impedance of the sample have been determined, the density at any given coordinate position (x, y) can be obtained by applying Eq. (4) [1]:
 |
(4) |
Briggs et al. established the mathematical expression for obtaining the acoustic attenuation [1]. The attenuation in the coupling medium α0, the amplitude of the reflected signal from the cell surface A2, the amplitudes A1 and A0 (see above), and the impedance of the substrate Zs are all used for calculating the attenuation coefficient (Fig. 2) in Eq. (5):
 |
(5) |
2.2. Contrast Mechanism
The contrast in acoustic images of biological specimens can be created using the difference in attenuation rather than differences in the reflection coefficient because their acoustic impedances are close to the acoustic impedance of the coupling medium. It has been shown that the difference in attenuation can be enhanced by using highly reflective materials [14]. For example, silica glass was used as a substrate when operating SAM at frequencies in the range of 200 - 600 MHz. On the other hand, sapphire was used as a substrate when operating SAM at a frequency of 1 GHz or higher [13, 15]. The corresponding contrast mechanism varies with the V(z) distribution. Additionally, some information about the adhesive condition between the cells and the substrate can be explored by using the scanning reflection acoustic microscope [13, 15]. The V(z) distribution can be explained by Eqs. (6) and (7):
 |
(6) |
 |
(7) |
where u is the acoustic field; P is the pupil function of the lens; R is the reflectance function; k is the wave number in the coupling medium; and f is the focal length. By substituting r = fsinθ into Eqs. (6) and (7), we obtain expressions in terms of the half aperture angle of the lens as shown in Eqs. (8) and (9):
 |
(8) |
 |
(9) |
where θ is half the aperture angle of the acoustic lens.
By replacing kz = k cosϑ into Eqs. (8) and (9), we obtain Eqs. (10), (11) and (12) as follows:
 |
(10) |
 |
(11) |
 |
(12) |
Furthermore, Eq. (10) yields the following expression:
 |
(13) |
where, F-1{V(z))} is the inverse Fourier transform.
The reflectance function R plays an important role in the V(z) response and the corresponding contrast formation across the cell. Normal cells grown under physiological conditions on a given substrate can be described by the reflectance function as determined by the layered media (e.g., coupling medium, cell, substrate) shown in Fig. (3A). Conversely, when a cell is compromised (e.g., apoptosis, necrosis), the reflectance function is described as the layered media consisting of the coupling medium, the cell itself, the fluid, and the substrate (Fig. 3B) [16].
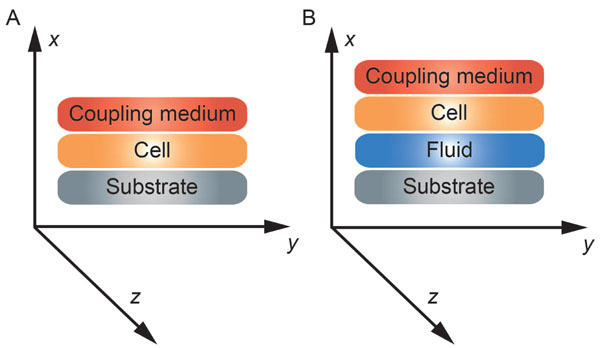 |
Fig. (3). Schematic diagram of the cell-layered structure model for different conditions. (A) healthy cell; (B) injured cell. |
2.3. Layer Model and Reflectance Function of Biological Cells
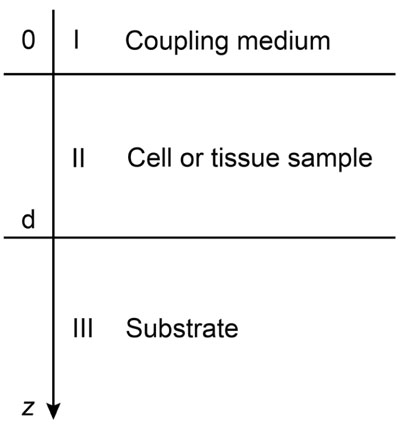
Biological specimens can be considered as thin films with near zero shear modulus. Fig. (4) illustrates the layered structure model comprised of the cell specimen, the coupling medium and the substrate. Here, the biological cell is assumed to have zero shear velocity. Thus, the layered structure can be treated as a liquid-liquid-solid system.
Coupling medium (layer I):
 |
(14) |
 |
(15) |
Biological specimen (layer II):
 |
(16) |
 |
(17) |
Substrate (layer III):
 |
(18) |
 |
(19) |
The superscript “+” indicates wave propagation in the positive direction along the z-axis; the superscript “–“ indicates wave propagation in the negative direction along the z axis; the Roman numerals I, II, and III indicate media layers of the propagating wave. Φ represents the potential of the longitudinal wave and Ψ represents the potential of the shear wave; A is the amplitude of the potential of the longitudinal wave; B is the amplitude of the potential of the shear wave; k is the wave number; and ω is the angular frequency.
By applying Snell’s law, following expressions are obtained:
 |
(20) |
 |
(21) |
By substituting Eqs. (20) and (21) into Eqs. (14) through (19), we obtain the following expressions describing the layered structure of the model as illustrated in Fig. (4) for layer I, layer II and layer III respectively.
For the coupling medium (layer I) the following expressions are valid as shown in Eqs. (22) and (23):
 |
(22) |
 |
(23) |
For the biological cell or tissue (layer II) following expressions as shown in Eqs. (24) and (25):
 |
(24) |
 |
(25) |
Finally, the substrate layer (layer III) is described by the following expressions as shown in Eqs. (26) and (27):
 |
(26) |
 |
(27) |
The particle velocity along the z-axis and the continuity of stress are the boundary conditions in this layered structure are expressed in Eqs. (28) and (29):
 |
(28) |
 |
(29) |
where σz is the normal stress along the z-direction; τxz is the horizontal shear stress; and υz is the particle velocity component along the z direction.
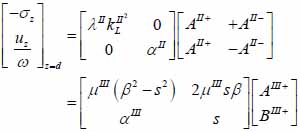
The particle velocity and stress for each layer in the model can be calculated from Eqs. (22) through (27) and subsequently substituted into Eqs. (28) and (29) respectively to satisfy the boundary conditions. By solving boundary equations, the set of the first order of simultaneous equations relating to the potential can be obtained as follows:
 |
(30) |
 |
(31) |
 |
(32) |
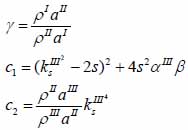
whereas λ and µ are Lame’s constants. Then, by solving Eqs. (30), (31) and (32), the reflectance function can be obtained by Eqs. (33) and (34):
 |
(33) |
 |
(34) |
The V(z) distribution can be simulated to obtain the longitudinal velocity in biological cells once the reflectance function has been determined by using Eqs. (24) and (25).
3. METHODS AND SIMULATIONS
3.1. Calculation of the Reflectance Function
The reflectance function for biological cells and tissues and their substrate system is calculated by employing the layer model described in the previous section. Here the biological specimen was treated as a thin film with near zero shear modulus attached on a substrate. The biological specimens used in the calculations were kidney tissue, HeLa and MCF-7 cancer cells; the substrates we used for our calculations were both fused quartz and glass substrates.
3.2. Simulations of V(z) Distributions
Once the calculations of reflectance function for the biological specimen and the substrate were completed, we then simulated the V(z) distributions for the system. The V(z) distributions were simulated using MATLAB by assigning parameters for the acoustics lens, the biological specimen and the substrate. For example, the thickness of an average HeLa cell is about 5 -12 µm, while its longitudinal velocity is about 1534 m/s. The glass substrate’s shear wave velocity is approximately 5845 m/s. These values are in good agreement with previously published studies [17, 18].
3.3. Calculation of the Acoustic Field, the Pupil and Reflectance Function of the Lens
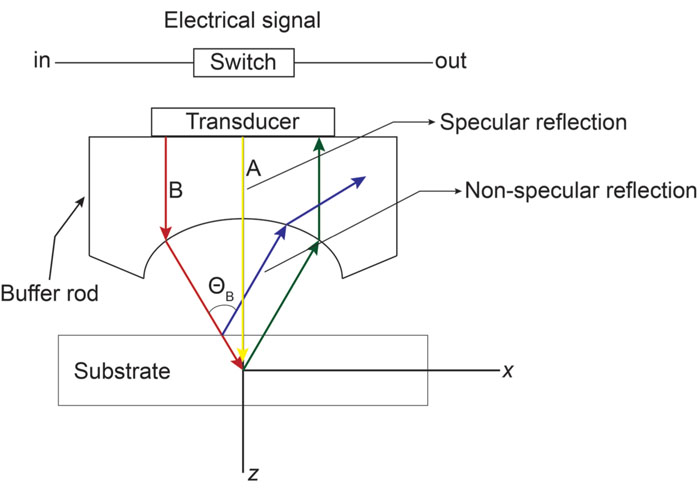
Here we calculated and plotted the V(z) distributions that were described in the previous section. Fig. (5) illustrates the schematic diagram for calculating the V(z) distribution by means of the Fourier Angular Spectrum method. Fig. (6) shows the schematic diagram for determining the V(z) distribution by means of the Ray theory method.
3.4. Determining mechanical properties of biological cells and tissues with time-resolved SAM
3.4.1. Acoustic Images and Data Acquisition
Acoustic images are generated by assigning a greyscale value to each individual pixel in the scanning field. The dimensions of the field are set prior to the data acquisition; consequently, this defines the size and therefore the number of pixels of the acoustic image. Each pixel is defined by its coordinates on the image plane, (xi, yi). C-scan acoustic images are generated by mechanically scanning the sample in a parallel plane to its surface. Each pixel corresponds to an A-scan comprised by an RF signal or multiple RF signals averaged. Combining the A-scans for all pixels of an individual line on the image matrix leads to the respective B-scan. Combination of all B-scans, in turn, leads to the generation of the C-scan. Samples can be reconstructed in three-dimensions by recording C-scans at different defocus positions z. In order to improve the signal-to-noise ratio, a multi-fold averaging of the acquired signal is typically applied. Here, I(xi, yi, z) is the brightness of the acoustic image at the defocus distance of the lens, z, and at any pixel position (xi, yi). If s(t, xi, yi, Z) is the RF signal measured at any given pixel position (xi, yi) as a function of time t, the brightness, I(xi, yi, z) at the same pixel position is defined as the integral over time of the squared RF signal sn(t, xi, yi, z) shown in Eq. (35) [19]:
 |
(35) |
where N is the total number of measurements acquired at each pixel position (xi, yi); ΔT is the time gate for the RF signal.
Fig. (7) shows the RF signal measured for an MCF-7 cell. By taking the average of the envelope of the recorded RF signals, a cross-section of the cell along the scan line can be obtained by Eq. (36) [19]:
 |
(36) |
At each pixel position, the signal is averaged N times. By utilizing the Hilbert transform H(s) [20], we can determine values of the maxima and the corresponding positions of the echo signals reflected from the surface of the sample and the cell/substrate interface as shown in Fig. (7) [19, 20].
3.5. Thickness, Sound Velocity and Attenuation of Cells
MATLAB scripts were developed for performing all simulations and for obtaining the local thickness, sound velocity, and attenuation of MCF-7 and HeLa cells. Furthermore, for the calculations we employed the quantitative formulas reported in detail by Briggs et al. [1, 4] and described above.
3.6. Transducer Simulations
The transducer simulations were performed and developed using the Field II ultrasound simulation program [21, 22]. Field II originally developed by J. A. Jensen employs the concept of spatial impulse response developed by Tupholme [23] and Stepanishen [24, 25]. The spatial impulse response can be viewed as the impulse response for the linear system at a specific point in space and it was used to explain how the transducer transmits sound in space. The pressure produced by the transducer can be described by the spatial impulse response and can be determined by using the Rayleigh integral in Eq. (37):
 |
(37) |
 is the position of the field point in space; c is the speed of sound and S is the surface area of the transducer. The emitted pressure field can be expressed by Eq. (38) as follows:
 |
(38) |
where vn(t) is the surface velocity of the transducer and ρ is the density of the coupling medium. Due to the linear acoustics that were employed, apodization of the transducer surface can be included in the simulations as can the responses from transducer elements in the case of an array. Furthermore, the scattered field can be determined from the spatial impulse response. The signal received from the transducer can be calculated from Eq. (39):
 |
(39) |
*r indicates spatial convolution and *t denotes temporal convolution; vpe is the pulse-echo impulse including the transducer excitation and the electro-mechanical impulse response during the pulse’s emission and reception. The inhomogeneities in the tissue caused by density and perturbations of the propagation velocity are taken into account by fm; hpe represents the pulse-echo spatial impulse response, which shows the relation between the transducer geometry and the spatial extent of the scattered field; vpe, fm and hpe can be expressed by Eqs. (40), (41) and (42) respectively as follows:
 |
(40) |
 |
(41) |
 |
(42) |
Once the spatial impulse response for the transmitting and the receiving transducer is determined and then convolved with the impulse response of the transducer, the received response can be computed. By adding the response from a collection of scatterers, a single RF line in an image can be computed. The scattering strength of the collection of scatterers is calculated from the density and speed of sound perturbations in the tissue. In the case of homogeneous tissues, it can be generated from a collection of randomly placed scatterers, in which a scattering strength was assigned by a Gaussian distribution. The variance of the Gaussian distribution is calculated from the backscattering cross-section of the specific tissue [21]. In order to test the imaging quality of the transducers, point targets and cyst phantoms were used is the transducer simulations.
3.6.1. Point Targets
This phantom served to describe the spatial variation of the point spread function for a specific transducer focusing and apodization scheme. The synthetic phantom was comprised of five-point targets beginning at 30 mm from the transducer surface and moving at increments of 10 mm along the z-axis. A linear scan image was constructed of these five points and compressed so as to display a 40 dB dynamic range.
3.6.2. Cyst Phantom
This phantom was composed of a cyst region and was utilized to explore the contrast-lesion detection capabilities of imaging systems. The scatterers in the phantom were created by determining random positions within a 60×50×10 mm cube. Subsequently, a Gaussian distributed amplitude was assigned to each individual scatterer. The amplitude was set to “0” if the scatterer dwelled within a cyst region. A linear scan of the phantom was performed by 64-, 128- and 192-elements transducer arrays including a Hanning apodization in transmit and receive mode.
3.6.3. Cell Models
We created a bitmap image of scattering strength for the acoustic image of cells. Then we used this map to calculate the multiplication factor for the scattering amplitude, which was assigned by the Gaussian distribution. Finally, we modelled the variation of the density and speed of sound perturbations in the tissue. The scatterer maps we used were based on the acoustic C-scan images obtained from the experimental data set for HeLa and MCF-7 cells respectively. A phantom of acoustic images of cells was made with 105 scatterers that were randomly distributed within the phantom. A Gaussian distributed scatter amplitude with a standard deviation were calculated from the scatter map. The phantom was scanned at various frequencies (7, 70, 100, 600, 800 MHz) of a phased array transducer with 64, 128 and 256 elements respectively with approximately half wavelength spacing and Hanning apodization. A single focus on transmit was used while dynamic focusing was used during reception. Each image consisted of 50 scan lines.
The phantom was also scanned with a 100 MHz, 20×20 2D fully populated array with approximately half wavelength spacing and Hanning apodization. A single focus point during transmit mode was used for the transducer. However, we employed multiple focus points during the reception phase. Each image was composed of 30 lines.
4. RESULTS AND DISCUSSION
4.1. Calculation of the Reflectance Function
Fig. (8) depicts the V(z) distributions for fused quartz for simulations based on the ray theory and the angular spectrum technique. The amplitudes were normalized prior to plotting. Subsequently, they were plotted as a function of the focal zone, z.
Fig. (9) shows the V(z) curve simulations for a thin kidney tissue mounted on fused quartz substrate and for HeLa cells mounted on sapphire substrate, respectively. It shows that the V(z) distributions have a distinct pattern and period. The periods of V(z) curve for the kidney mounted on the fused quartz are different from those of the fused quartz substrate. The periods of the V(z) curve for HeLa cells attached on the sapphire substrate were also different from those of the kidney tissue. This demonstrates that the surface acoustic velocity of a thin biological specimen can also be measured with the V(z) curve technique.
4.2. Imaging of HeLa and MCF-7 Cells
The acoustic images of HeLa and MCF-7 cells were created using custom MATLAB scripts. Representative acoustic images from HeLa and MCF-7 cells are shown in Fig. (10).
4.3. Quantifying Mechanical Properties of Biological Cells with Time-resolved SAM
The biomechanical properties of HeLa and MCF-7 cells (thickness, sound velocity, acoustic impedance, density and acoustic attenuation) were determined using the time-resolved technique as described above. In brief, the RF signals collected from HeLa and MCF-7 cells were analyzed with custom developed MATLAB scripts. These images were acquired at a center frequency of 860 MHz. The mechanical properties of HeLa and MCF-7 cells cultured in vitro are listed in Table 1.
| - | MCF-7 | HeLa |
|---|---|---|
| Thickness [ µm ] | 11.9 | 5.27 |
| Sound velocity [ m/s ] | 1573 | 1500 |
| Acoustic impedance [ MRayls ] | 1.6 | 1.77 |
| Density [ kg/m3 ] | 1016 | 1182 |
| Attenuation [ Neper/µm ] | - | 0.21 |
4.4. Transducer Simulations for the Generation of C-scans
Transducer simulations were performed for generating C-scan images of MCF-7 cells in a variety of phased array settings with varying number of elements. Representative C-scans are shown in Fig. (11).
CONCLUSION
High-frequency time-resolved SAM is a powerful method for determining the mechanical properties of biological cells. In the current paper, we described various approaches for simulating the contrast mechanisms for cancer cells (e.g., MCF-7 and HeLa). We calculated the biomechanical properties of tumor cells and performed simulations for the RF signals obtained by high-frequency SAM. Various high-frequency 1D and 2D transducer-arrays were used for the simulations in order to achieve higher image resolution and improve volumetric imaging capabilities. Phased array beamforming, dynamic apodization and focusing were employed in these simulations. The results indicate that the electronic beam steering in the case of high-frequency and ultra-high frequency SAM is an option that needs to be further elucidated and developed. This would allow for improved spatial resolution for subcellular geometries. SAM offers great promise as a non-invasive technique for the determination of biomechanical properties of biological cells and tissues. Improving our understanding of mechanoelastic properties and their association to underlying molecular and biochemical signaling remains of central importance for improving our understanding of the tumor microenvironment, cancer pathogenesis, progression and metastasis.
CONSENT FOR PUBLICATION
Not applicable.
CONFLICT OF INTEREST
The authors declare no conflict of interest, financial or otherwise.
ACKNOWLEDGEMENTS
The authors would like to acknowledge Eric Strohm and Michael Kolios (Ryerson University, Toronto, Canada) for providing experimental data and technical support for this research.
REFERENCES
| [1] | Briggs GAD, Rowe JM, Sinton AM, Spencer DS. Quantitative methods in acoustic microscopy Ultrasonics Symposium Proceedings Chicago, IL, USA. 1988; pp. 1988; 743-9. |
| [2] | Bereiter-Hahn J, Berghofer F, Kundu T, Penzkofer C, Hillmann K. Evaluation of mechanical properties of cells by scanning acoustic microscopy using V(z) characteristics American Society of Mechanical Engineers, Applied Mechanics Division, AMD 1992; 71-80. |
| [3] | Saijo Y, Santos Filho E, Sasaki H, et al. Ultrasonic tissue characterization of atherosclerosis by a speed-of-sound microscanning system. IEEE Trans Ultrason Ferroelectr Freq Control 2007; 54(8): 1571-7. |
| [4] | Briggs GAD, Wang J, Gundle R. Quantitative acoustic microscopy of individual living human cells. J Microsc 1993; 172(Pt 1): 3-12. |
| [5] | Lemons RA, Quate CF. Acoustic microscopy: Biomedical applications. Science 1975; 188(4191): 905-11. |
| [6] | Shekhawat GS, Dravid VP. Nanoscale imaging of buried structures via scanning near-field ultrasound holography. Science 2005; 310(5745): 89-92. |
| [7] | Tetard L, Passian A, Lynch R M, Voy B H, Shekhawat G, Dravid V, et al. Elastic phase response of silica nanoparticles buried in soft matter. Applied Physics Letters 2008; 93: 133113. |
| [8] | Ito Y, Kushida K, Sugawara K, Takeuchi H. A 100-MHz ultrasonic transducer array using ZnO thin films. IEEE Trans Ultrason Ferroelectr Freq Control 1995; 42: 316-24. |
| [9] | Cannata JM, Williams JA, Zhou QF, Sun L, Shung KK, Yu H, et al. Self-focused ZnO transducers for ultrasonic biomicroscopy. J Appl Phy 2008; 103. |
| [10] | Lemons RA, Quate CF. A scanning acoustic microscope 1973; 1006-8. |
| [11] | Lemons RA, Quate CF. Acoustic microscope-scanning version. Appl Phys Lett 1974; 24: 163-5. |
| [12] | Hildebrand JA, Rugar D, Johnston RN, Quate CF. Acoustic microscopy of living cells. Proc Natl Acad Sci USA 1981; 78(3): 1656-60. |
| [13] | Ebert A, Tittmann BR, Du J, Scheuchenzuber W. Technique for rapid in vitro single-cell elastography. Ultrasound Med Biol 2006; 32(11): 1687-702. |
| [14] | Briggs GA, Wang J, Gundle R. Quantitative acoustic microscopy of individual living human cells. J Microsc 1993; 172(Pt 1): 3-12. |
| [15] | Tittmann BR, Miyasaka C, Maeva E, Shum D. Fine mapping of tissue properties on excised samples of melanoma and skin without the need for histological staining. IEEE Trans Ultrason Ferroelectr Freq Control 2013; 60(2): 320-31. |
| [16] | Zhao X, Akhtar R, Nijenhuis N, et al. Multi-layer phase analysis: Quantifying the elastic properties of soft tissues and live cells with ultra-high-frequency scanning acoustic microscopy. IEEE Trans Ultrason Ferroelectr Freq Control 2012; 59(4): 610-20. |
| [17] | Strohm E, Czarnota GJ, Kolios MC. Quantitative measurements of apoptotic cell properties using acoustic microscopy. IEEE Trans Ultrason Ferroelectr Freq Control 2010; 57(10): 2293-304. |
| [18] | Miura K, Yamamoto S. A scanning acoustic microscope discriminates cancer cells in fluid. Sci Rep 2015; 5: 15243. https://www.nature .com/articles/ srep15243 |
| [19] | Weiss E C, Anastasiadis P, Pilarczyk G, Lemor R M, Zinin P V. Mechanical Properties of Single Cells by High-Frequency Time-Resolved Acoustic Microscopy. IEEE Transactions on Ultrasonics, Ferroelectrics, and Frequency Control 2007; 54: 2257-71. |
| [20] | Boche H, Pohl V. Characterization of the stability range of the Hilbert transform with applications to spectral factorization 2017 IEEE Int Sym Info Theory (ISIT) 2017; 2368-72. |
| [21] | Jensen J, Stuart MB, Jensen JA. Optimized plane wave imaging for fast and high-quality ultrasound imaging. IEEE Trans Ultrason Ferroelectr Freq Control 2016; 63(11): 1922-34. |
| [22] | Jensen JA. Simulation of advanced ultrasound systems using Field II 2004 2nd IEEE International Symposium on Biomedical Imaging: Nano to Macro (IEEE Cat No 04EX821) 2004; 1: 636-9. |
| [23] | Tupholme GE. Generation of acoustic pulses by baffled plane pistons. Mathematika 2010; 16: 209-24. |
| [24] | Stepanishen PR. Transient radiation from pistons in an infinite planar baffle. J Acoust Soc Am 1971; 49: 1629-38. |
| [25] | Stepanishen PR. The time Dependent force and radiation impedance on a piston in a rigid infinite planar baffle. J Acoust Soc Am 1971; 49: 841-9. |


