All published articles of this journal are available on ScienceDirect.
Image Fusion based on Cross Bilateral and Rolling Guidance Filter through Weight Normalization
Abstract
Introduction:
Image Fusion is the method which conglomerates complimentary information from the source images to a single fused image . There are numerous applications of image fusion in the current scenario such as in remote sensing, medical diagnosis, machine vision system, astronomy, robotics, military units, biometrics, and surveillance.
Objective:
In this case multi-sensor or multi-focus devices capture images of the particular scene which are complementary in the context of information content to each other. The details from complementary images are combined through the process of fusion into a single image by applying the algorithmic formulas. The main goal of image fusion is to fetch more and proper information from the primary or source images to the fused image by minimizing the loss of details of the images and by doing so to decrease the artifacts in the final image.
Methodology:
In this paper, we proposed a new method to fuse the images by applying a cross bilateral filter for gray level similarities and geometric closeness of the neighboring pixels without smoothing edges. Then, the detailed images obtained by subtracting the cross bilateral filter image output from original images are being filtered through the rolling guidance filter for scale aware operation. In particular, it removes the small-scale structures while preserving the other contents of the image and successfully recovers the edges of the detailed images. Finally, the images have been fused using a weighted computed algorithm and weight normalization.
Results:
The results have been validated and compared with various existing state-of-the-art methods both subjectively and quantitatively.
Conclusion:
It was observed that the proposed method outperforms the existing methods of image fusion.
1. INTRODUCTION
The multi-sensor images captured through multiple sensors systems have very limited information and are not capable of providing the complete information of the particular scene due to the principle physical limitations constraints in the sensor systems. It is difficult to get all the information about a particular scene when captured through a single sensor. Hence, image fusion techniques are employed to combine this multi sensory information together while avoiding the loss of information. Fusion algorithms combine two images captured through different sensors in a single image so that the adequate information of the particular scene is transferred to a single image that contains comprehensive visual data about the subject under study. Digital photography [1], military for weapon detection [2], helicopter navigation [3], medical sector, navigation, remote sensing, and military [4-9] are the current areas of application in image fusion. In the field of medical imaging, the CT (Computed Tomography) images give the information related to the bone structures and in the case of the MRI image, it shows brain tissue anatomy and soft tissue detail. Image fusion techniques find widespread applications in surgical aspects in order to fetch adequate information corresponding to the specific target areas.
In the literature section of this manuscript, we have discussed the different existing methods [10]. The main objective of the proposed method is to enhance the performance of the image fusion technique by combining two images captured from different sensors into a single image. By applying detailed images obtained by subtracting cross bilateral filter output and then a scale aware operation using rolling guidance filter, an improved fusion performance is demonstrated.
The paper has been summarized as follows: Section 2 presents the literature survey. Section 3 presents the proposed method. Section 4 presents the discussion of the experimental framework including results and discussion and Section 5 describes the conclusion and future scope.
2. LITERATURE SURVEY
Numerous image fusion techniques have been implemented so far in the literature. Image fusion is performed at three processing levels, i.e., signal, feature, and decision. The signal level fusion of an image is also termed as the image fusion at the pixel level, which fuses visual information corresponding to each pixel from a number of registered images into a single fused image and is termed as fusion at the lowest level. The object-level fusion of image is also known as feature level fusion of image fusing feature descriptor information and object details which have been extracted from the individual input images. Finally, symbol or decision level fusion of image represents probabilistic decision information retrieved by local decision-makers using applying results of feature level processing on each image.
Among a large number of image fusion methods proposed in the literature, the multi-scale decompositions approach (wavelet, pyramid) [11, 12] and the data-driven techniques [13, 14] are the most popular. However, these approaches are more prone to artifacts into a fused image. To overcome these issues, optimization-based image fusion techniques were proposed. However, these techniques exhibited a large number of iterations to obtain an appropriate fused image. Sometimes these techniques tend to do over smoothing of the fused images due to multiple iterations. Subsequently, the edge-preserving techniques are currently popular in the field of image fusion. These processes of image fusion use edge-preserving smoothing filters for the motive of fusion. Over a decade, researchers and scientists have implemented plenty of studies in the field of image fusion [15-18]. The lifting-based wavelet decomposition [19] is proposed to minimize the mathematical complexity with a smaller memory requirement for image fusion. An image fusion technique for the satellite images using multi-scale wavelet analysis is presented [20]. Also, the pixel level multi-focus fusion of image was introduced on the basis of the image blocks and artificial neural network [21]. Further, the image fusion at pixel level was presented by decomposing the input images by applying wavelet, curvelet, bandalet, and contourlet transform [22-24]. An image fusion method [25] employs Discrete Cosine Transform (DCT) based fusion of images instead of pyramids or wavelets and the performance of these techniques is similar to convolution and lifting based wavelets. Further, Discrete Cosine Harmonic Wavelet Transform (DCHWT) [26] has been introduced to reduce the mathematical complexity. A variant of standard bilateral filter, known as the cross bilateral filter was introduced with pixel significance which employs a second image to shape the filter kernel [27, 28]. In a study [29], a Bilateral filter is used for multiscale decomposition of multi-light image collections for detail and shape enhancement. Also, temporal joint bilateral filter and dual bilateral filter were introduced [30] for multispectral video fusion in which the former employs infrared video to find filter coefficients and filters the visible video with respect to these coefficients. Further, the application of bilateral filter for the hyperspectral fusion of images was introduced [31], which separates weak edges and fine textures after subtracting bilateral filter results from the input image. The magnitude of these different images is used to detect the weights directly. Another version of a bilateral filter, which employs center pixel from the infrared image and the neighborhood pixels from the visual image to locate the filter kernel and works on the infrared image, was introduced for human detection through the fusing of infrared and visible images [32]. Further, multiscale directional Bilateral Filter (BF), which is the combination of the bilateral filter and Directional Filter Bank (DFB) was introduced for a multisensor fusion of images to accomplish the edge-preserving capability of the bilateral filter and directional detail capturing capability of Directional Filter Bank (DFB) [33].
3. METHODOLOGY
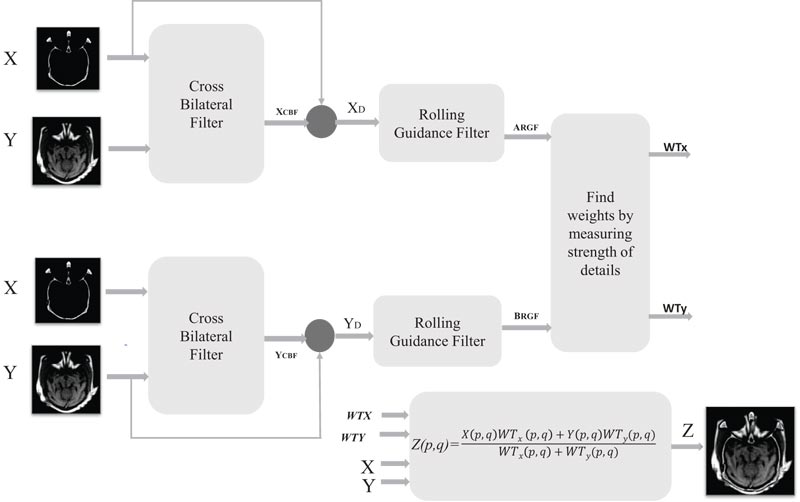
The proposed method addresses the shortcomings of the previously existing image fusion methodologies. The proposed method fuses two medical images taken from two different sensors. Firstly, the proposed algorithm uses a cross bilateral filter that uses one image for finding the kernels and the other for the filtering. The detailed images are obtained after subtracting cross bilateral filter output from the respective input images. Then details image are input to the rolling guidance filter for scale aware operation. It removes the small-scale structures while successfully recovering the edges of the detail images. Here, the weights are computed by calculating the strength of the detail images obtained after scale aware operation. Finally, the computed weights are multiplied with the source images followed by weight normalization (Fig. 1).
3.1. Cross Bilateral Filter
The bilateral filter is a local, nonlinear, and non-iterative method which integrates the low pass filter and edge stopping mechanism that reduces the filter kernel when the intensity difference between the pixels is more. As both levels of gray similarities and geometric closeness of neighborhood pixels are taken into considerations, the weights of the filter depend on both Euclidian distance and the distance in gray or color space. It smoothens the image by preserving the edges applying neighborhood pixels.
Mathematically, for an image X, bilateral filter output at a location of the pixel m is estimated below as follows [34]:
 |
(1) |
where Gδs (||m – n||) is a geometric closeness function,
and Gδr(|X(m) −X(n)|) is the level of gray similarities or edge stopping function
 |
is known as normalization constant
||m-n|| is Euclidean distance between m & n as well as S is a spatial neighborhood of m.
The values of δs and δr check the behavior of the bilateral filter and the dependency of δr/δs values and the derivative of the original signal on the behavior of the bilateral filter is studied elaboratively [35]. The appropriate δs value is chosen based on the optimal amount of LPF (Low pass filter) and blurs more for higher δs, since it integrates values from the large distance locations [36]. Also, if an image is scaled up or scaled down, δs must be adjusted in order to retrieve desired results. It seems that an optimal range for the δs value is (1.5-2.1); likewise, the ideal value for the δr relies on the amount of the edge to be preserved accordingly. If the images get attenuated or amplified, δr has to be adjusted in order to obtain the optimal result. Cross bilateral filter considers both levels of gray similarities and the geometric closeness of neighborhood pixels in image X to adjust the filter kernel and filters the image Y. Cross Bilateral Filter output of image Y at a pixel location m is estimated as [37]:
 |
(2) |
Where Gδs (||m – n||) is a geometric closeness function
Gδr(|X(m)−X(n)|) is the level of gray similarities or edge-stopping function
 |
is known as normalization constant.
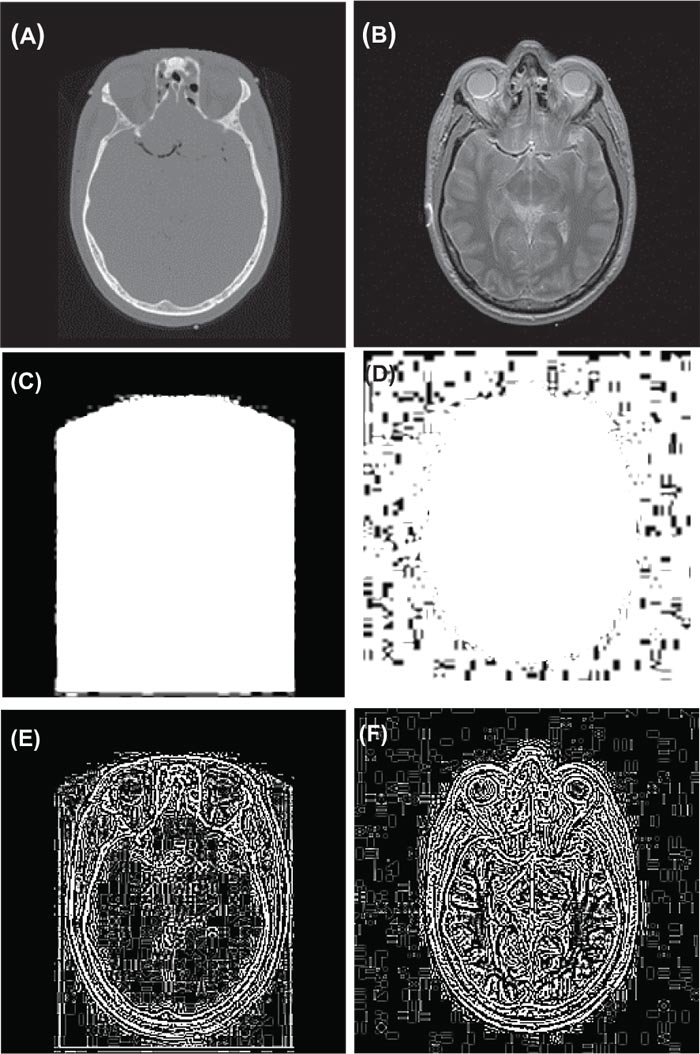
Here, the detailed images retrieved after subtracting cross bilateral filter output from the respective source images, for image X and Y are given by XD= X-XCBF and YD= Y-YCBF, respectively. In the Fig. (2) represents stimulated input Dataset 3 images and corresponding Cross Bilateral Filter output along with detail images of the same.
3.2. Rolling Guidance Filter
The method involves two pivotal steps, i.e., small structure removal and edge recovery.
3.2.1. Small Structure Removal
The first step is to remove small structures. As mentioned, the Gaussian filter is related to structure scale determination. Therefore, we illustrate this operator in the weighted average form, which uses the input image as XD and YD and output image XRGF and YRGF. Let m and n are index pixel coordinates in the images and δs is the standard deviation. Then, we express the filters as:
 |
(3) |
 |
(4) |
 |
and N(m) is a set of the neighboring pixels of m. This filter removes the structures whose scale is less than the δs according to the scale space theory. It is implemented competently by separating kernels in the perpendicular directions.
3.2.2. Edge Recovery
The iterative edge recovery process forms the essential contribution in this method. Here, images IRGF and JRGF are iteratively updated. We represent  and
and  as the result in the t-th iteration. In the beginning,
  and
and  are set as XRGF and YRGF in equation (3) and (4) which is the outcome of the Gaussian filtering. The value of the IRGFt+1 and JRGFt+1 in the t-th iteration is retrieved in a joint bilateral filtering form given the source XD and YD and the value as per earlier iteration
  and
and  .
.
 |
(5) |
 |
(6) |
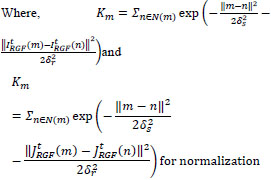 |
XD and YD are the same input images used in equation (3) and (4), δs and δr check the spatial and range weights accordingly. The expression can be understood as a filter that smoothes the source images XD and YD guided by the structure of XRGFt and YRGFt. The process differs in nature from how earlier methods engage a joint lateral filter that iteratively changes the guidance image and obtains illuminating effects.
3.3. PIXEL BASED FUSION RULE
The fusion rule proposed in the paper [38] is discussed here for completing the comparison of the performance of the proposed method. The weights are calculated by applying the statistical properties of a neighborhood of detail coefficients instead of wavelet coefficients [38]. The window of the size w x w around a detail coefficient XRGF(p,q) or YRGF(p,q) was observed as a neighborhood to calculate its weight. The neighborhood is represented as matrix S. Each row of the matrix S is considered as an observation and column as a variable to calculate unbiased estimate Chp,q of its covariance matrix [39], here p & q are spatial coordinates of the detail coefficientsXRGF(p,q) or YRGF(p,q)
 |
(7) |
 |
(8) |
Where ak is the kth observation of w dimension variable and  is the mean of the observations. It observed that the diagonal of matrix Chp,q gives the vector of variances for each column of matrix S. The eigenvalue of matrix Chp,q is calculated and the number of the eigenvalues directly depends on the size of Chp,q. The sum of these eigenvalues is directly equivalent to the horizontal detail strength of the neighborhood and is represented as HdetailStrength. Likewise, the non-biased covariance Cvp,q is calculated by treating each column of S as an observation and row as a variable (opposite of that of Chp,q), and the sum of eigenvalues of Cvp,q gives vertical detail strength VdetailStrength.
It is described as:
 |
Where eigenk is the kth eigenvalue of the unbiased estimate of the covariance matrix. The weight assigned to a particular detail coefficient is calculated by adding these two details strengths. Hence, the weight depends only on the strength of the details and not on the actual intensity values:
 |
After calculating the weights for all detail coefficients relating to both source images, the weighted average of the source images will represent in the fused image.
Here, WTx and WTy are the weights of detail coefficients XRGF and YRGF which belong to the respective input images X and Y, then the weighted average of both is calculated in the fused image using Equation 9.
 |
(9) |
4. PARAMETERS FOR EVALUATION OF THE FUSION PERFORMANCE
Evaluation of image fusion performance is a difficult task since it does not possess any ground truth for comparison. In literature, numerous parameters have been presented to measure the performance of the image fusion. Some of the parameters are considered to evaluate the performance of our study. They are as follows [22, 38]:
1.
Average pixel intensity (API) or mean ( ) measure an index of contrast and is represented by:
 |
(10) |
Where f(a,b) is the pixel intensity at (a,b) and pxq is the size of the image
2. Standard Deviation is the square root of the variance, which considers the spread in data and is, given by:
 |
(11) |
3. Average Gradient estimates a degree of clarity and sharpness and is represented by:
 |
(12) |
4. Entropy measures the amount of information constitute in the image and represented by:
 |
(13) |
where Zk is the probability of the intensity k in an 8-bit image.
5. Mutual Information quantifies the overall mutual information between original images to the fused image, which is represented by:
 |
Where  is the mutual information between input image X and fused image Z
And  is the mutual information between the input image Y and fuse image Z.
6. Fusion Symmetry or Information Symmetry (FS or IS) represents how much symmetric the fused image with regards to input images and is represented by:
 |
(14) |
7. Correlation Coefficient (CC) calculates the relevance of the fused image to input images and is represented by:
 |
(15) |
where 
And 
8. Spatial Frequency calculates the entire information level in the areas of an image and is calculated as:
 |
(16) |
where 
And 
In addition, object fusion of image performance characteristics [18, 40] based on gradient information is taken into consideration. This gives an in-depth analysis of fusion performance by total fusion performance, fusion loss, and the fusion artifacts or artificial details [18, 40], and the symbolic representation is given as:
QXY/Z= information transferred from original images to the fused image
LXY/Z=losses of information and
NXY/Z=artifacts or noise added in the fused image during the fusion procedures. Here, the QXY/Z, LXY/Z and NXY/Z are complementary and the sum of the above three parameters should be unity [26, 40]
 |
(17) |
In most of the cases, it observed that the addition of these parameters may not lead to unity. Hence, these parameters are revised and the modification has been proposed for calculating the fusion artifacts [26]. The equation is given as follows for completeness:
 |
(18) |
Where  indicates positions of fusion artifacts in which fused gradients are stronger than input.
gXa,b, gYa,b and gZa,b are the edge strength of X, Y, and Z, respectively,
QXZa,b&QYZa,b are the gradient details preservation estimates of input images X and Y,
wXa,b&wYa,b are the perceptual weight of input images X & Y, respectively
With this newly efusion artifacts measure NmXY/Z, equation 17 can be written as:
 |
(19) |
5. RESULTS AND DISCUSSION
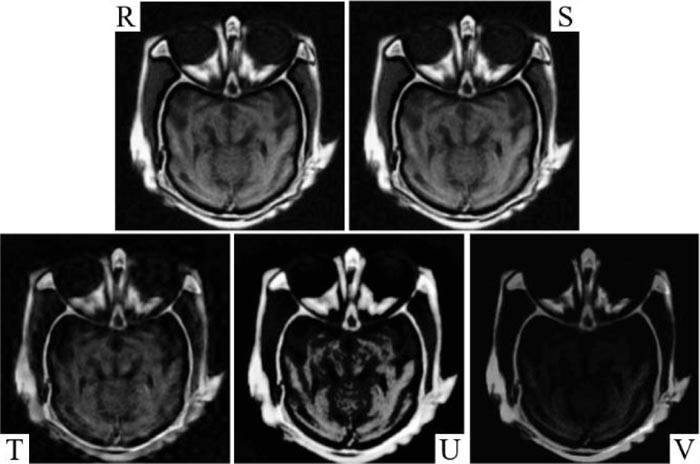
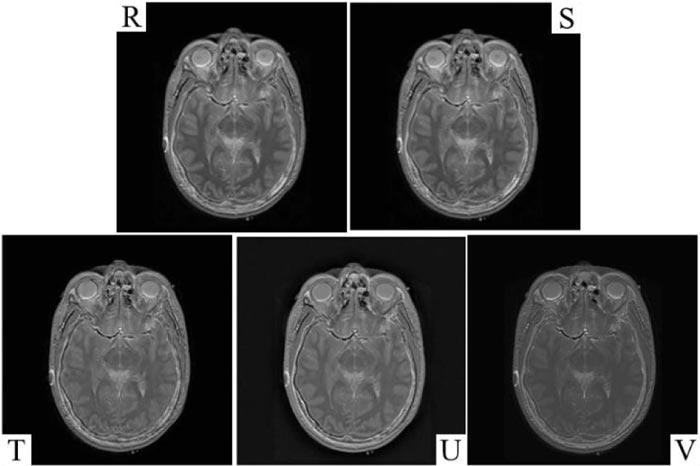
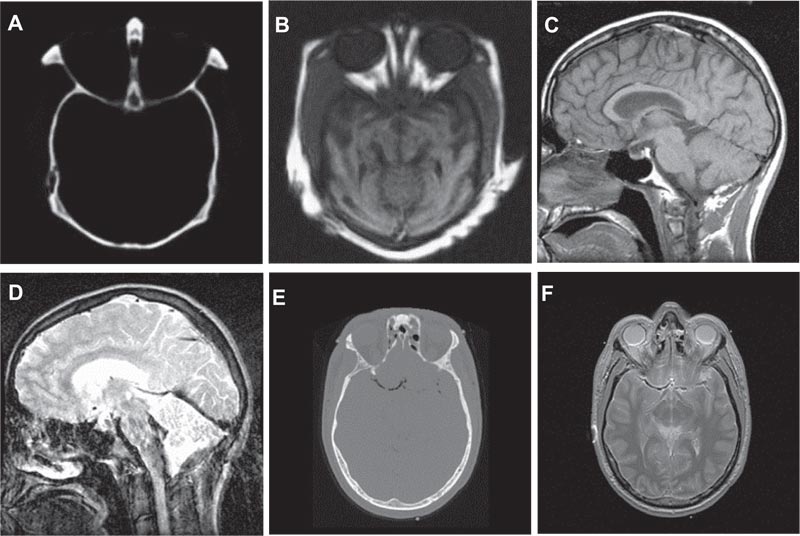
The experiments were carried out on a different set of medical images [43, 44]. In this paper, image fusion performance analysis and comparison are executed for three standard test pairs of medical images namely medical (Dataset 1), medical (Dataset 2), and medical (Dataset 3). A fused image of the proposed method is compared with different methodologies discussed [5, 6, 41, 42] with the simulation parameters specified in the respective techniques. The parameters applied for the proposed method are δs = 1.8, δr =4, and kernel size=7. The conventional performance parameters as follows: API, AG, CC, SF, Entropy H, FS, MI, and SD are shown in Table 1, and the objective performance parameters QXY/Z, LXY/Z, NXY/Zand NmXY/Z along with their respective sum are presented in Table 2. The quality of the fused image is better in case of the higher QXY/Z factor and lower values for LXY/Z, NXY/Zand NmXY/Z for better performance. Since the aim of image fusion is to transfer maximum information from source to the fused image for better performance and enhance accurate, stable, and comprehensive details such that the fused image is more suitable for human perception, visual analysis and qualitative analysis. The competent image fusion techniques should possess the following three characteristics for better visual analysis; (1) It must transfer the basic or adequate information from the primary image to the fused image. (2) It must not lose the information of the primary image during the process of image fusion. (3) It must not produce any noise or artifacts to the fused image. In order to compute the performance visually, the fused images of Dataset 1, Dataset 2, and Dataset 3 are shown in Figs. (3-8). Fig. (3) represents the source images, output image represented by the proposed method in R, and images of other methods presented in the S [5], T [6], U [41], and V [42], respectively.
| Technique | Average Pixel Intensity | Standard Deviation | Average Gradient | Entropy | Mutual information | Fusion Symmetry | Correlation Coefficient | Spatial Frequency | |||
|---|---|---|---|---|---|---|---|---|---|---|---|
| Original image | Dataset 1 | ||||||||||
| Proposed | 53.7099 | 58.2383 | 11.5412 | 6.7468 | 5.5207 | 1.6346 | 0.6496 | 21.1974 | |||
| [5] | 54.3565 | 57.0601 | 11.1486 | 6.7247 | 5.1658 | 1.6137 | 0.6549 | 20.1200 | |||
| [6] | 38.6518 | 44.0615 | 08.4393 | 6.5876 | 2.1038 | 1.7258 | 0.6746 | 14.8591 | |||
| [41] | 31.9071 | 57.4591 | 10.5860 | 6.6321 | 2.7837 | 1.9653 | 0.6393 | 19.1669 | |||
| [42] | 39.2256 | 33.4267 | 10.3878 | 7.6412 | 3.7778 | 2.0000 | 0.8367 | 10.1533 | |||
| Original image | Dataset 2 | ||||||||||
| Proposed | 99.0411 | 72.6332 | 22.5867 | 7.7793 | 3.7950 | 1.8887 | 0.9009 | 30.5356 | |||
| [5] | 98.7951 | 72.2662 | 22.3566 | 7.7682 | 3.7435 | 1.8952 | 0.9015 | 30.3204 | |||
| [6] | 97.4055 | 70.9792 | 19.8201 | 7.6549 | 3.3815 | 1.9361 | 0.9046 | 27.5323 | |||
| [41] | 98.1618 | 86.8215 | 25.6987 | 7.6412 | 3.7728 | 2.0000 | 0.5994 | 36.1384 | |||
| [42] | 79.9874 | 65.8786 | 20.8754 | 6.6321 | 3.7545 | 1.9826 | 0.6633 | 26.9591 | |||
| Original image | Dataset 3 | ||||||||||
| Proposed | 44.2451 | 54.3015 | 9.7293 | 5.2673 | 5.1884 | 1.8943 | 0.9808 | 20.2744 | |||
| [5] | 44.5308 | 54.4084 | 9.5458 | 5.2361 | 4.8581 | 1.9016 | 0.9807 | 19.6976 | |||
| [6] | 44.0552 | 53.1290 | 5.5701 | 5.1863 | 3.2153 | 1.9606 | 0.9812 | 11.1950 | |||
| [41] | 43.8129 | 60.2809 | 8.6618 | 4.5256 | 3.4774 | 1.8899 | 0.7220 | 18.2341 | |||
| [42] | 42.8754 | 61.8664 | 7.8765 | 4.5271 | 3.7746 | 1.8973 | 0.9294 | 13.8754 | |||
| Measure | QXY/Z | LXY/Z | NXY/Z | Sum | NmXY/Z |
|---|---|---|---|---|---|
| Original Image | |||||
| Proposed | 0.9096 | 0.0753 | 0.1017 | 1.0866 | 0.0151 |
| [5] | 0.9041 | 0.0849 | 0.1070 | 1.0900 | 0.0110 |
| [6] | 0.8258 | 0.1704 | 0.0297 | 1.0259 | 0.0037 |
| [41] | 0.5057 | 0.4091 | 0.2445 | 1.1593 | 0.0915 |
| [42] | 0.4587 | 0.5694 | 0.0908 | 1.0591 | 0.0234 |
| Original Image | |||||
| Proposed | 0.8001 | 0.1829 | 0.0568 | 1.0398 | 0.0170 |
| [5] | 0.7993 | 0.1843 | 0.0543 | 1.0379 | 0.0164 |
| [6] | 0.7850 | 0.2097 | 0.0190 | 1.0137 | 0.0053 |
| [41] | 0.5771 | 0.2549 | 0.2509 | 1.0829 | 0.0526 |
| [42] | 0.3156 | 0.6673 | 0.0755 | 1.0584 | 0.0345 |
| Original Image | |||||
| Proposed | 0.7934 | 0.1876 | 0.0678 | 1.0488 | 0.0189 |
| [5] | 0.7842 | 0.2003 | 0.0642 | 1.0487 | 0.0155 |
| [6] | 0.7541 | 0.2494 | 0.0261 | 1.0296 | 0.0039 |
| [41] | 0.4042 | 0.5514 | 0.1419 | 1.0975 | 0.0536 |
| [42] | 0.3020 | 0.6870 | 0.0403 | 1.0293 | 0.0227 |
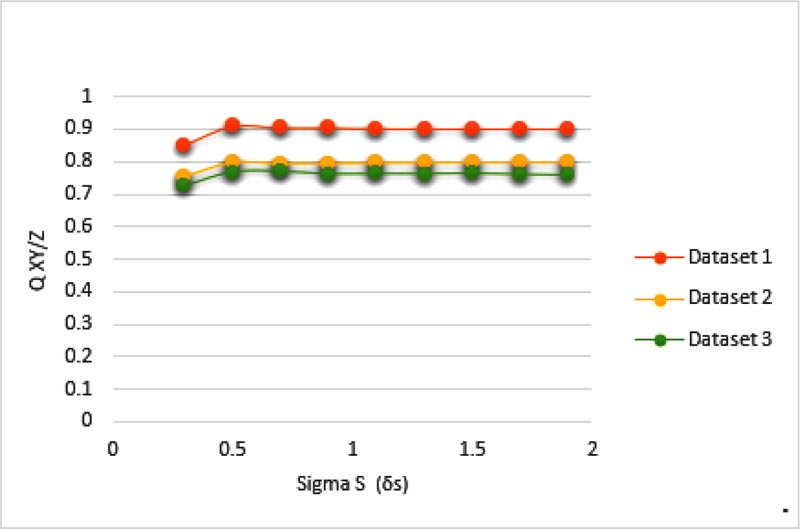
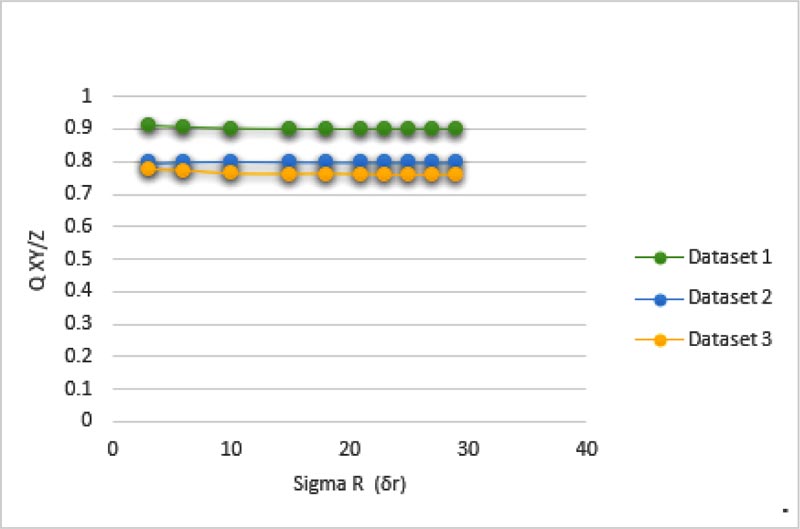
From Tables 1 and 2 it can be observed that the image quality of the proposed method outperformed other methods due to less losses of information and good visual performance. The proposed method was able to extract more appropriate information from source images to the fused image as compared to other methods. Tables 1 and 2 indicate that the method [5] is better compared to other methods but the proposed method is distinctly better than the method [5]. The proposed fused image has shown better performance in the case of FS, CC, NXY/Z and NmXY/Z. Our method has high QXY/Z (appropriate contents transferred from original images) and low LXY/Z (loss of information is less) and also the results were verified by the visual perception of the fused images.
Figs. (6, 7 and 8) show the actual visual images of the medical images compared with different methodologies. It was observed that the fused images obtained through the proposed method are comparatively better than the fused images of T [6], U [41], and V [42]. It was also observed that the image quality of the fused images of S [5]and proposed method R shows more similarities and the visual as well as the experimental information obtained from both shows more similarities, but the proposed method has shown improvements in all the factors necessary for quality and transfers of the information from source images to the fused images. Images of fusion results of S [5], T [6], and U [41] depict the loss of information and faded edge detail. At the same time, it shows that NXY/Z and NmXY/Z sharply decrease in the proposed method. However, mere artifacts can be observed in the images at the top corner of the fused images. S [5], T [6], U [41] and V [42] introduce artifacts during the fusion process and the values of the NXY/Z and NmXY/Z in creases simultaneously. Hence, it shows that the performance of the proposed method in terms of the NXY/Z and NmXY/Z is better than the other previous methods. It was also observed that our proposed method performed better in terms of visual and technical performance. The computational output values are high in terms of Average Pixel Intensity, Standard Deviation, Average Gradient, Entropy, Mutual Information, Fusion Symmetry, Correlation Coefficient, and Spatial Frequency factors. It was observed that visibility is reduced in other methods along with less values of Average Pixel Intensity, Standard Deviation, Average Gradient, Entropy, Mutual Information, Fusion Symmetry, Correlation Coefficient, and Spatial Frequency factors, which are most important factors to determine the fusion performance of the images. In Tables 1 and 2, we can observe that the proposed method comparatively performed better than the existing method in terms of the QXY/Z factor. In the case of all the medical images, LXY/Z and NXY/Z factors of the proposed method were comparatively less than the other previous method, which is good for the performance of image fusion. It is clear from the image fusion visual qualities, simulations and experimental results that the proposed method performs well as compared to other methods in terms of the qualities and quantities parameters.
CONCLUSION
In this manuscript, source images are processed with cross bilateral filter and detailed images are obtained after subtracting the cross bilateral output images from source images. The detailed images so obtained are input to the rolling guidance filter for scale aware edge preservation operation. This filtering process removes the small-scale structures while preserving the textures of the image and recovers the edges of the detailed images. The output of the rolling guidance filter is used for the computation of the weights. The weights are computed by measuring the strength of horizontal and vertical information in the source images. The computed weights are multiplied with the source images followed by weight normalization to obtained a fused image. A pair of multi-sensor medical images was tested in the proposed method to see the performance of the proposed as well as existing image fusion methods. It was observed that the proposed method performed better in almost all objective parameters compared to other methods. The application of the other type of filters instead of applying cross bilateral filter for obtaining the detail layers as well as rolling guidance filter for performing scale aware operation can be the potential future scope of the research work.
ETHICS APPROVAL AND CONSENT TO PARTICIPATE
Not applicable.
HUMAN AND ANIMAL RIGHTS
No human and animals were used in this study.
CONSENT FOR PUBLICATION
Not applicable.
AVAILABILITY OF DATA AND MATERIALS
Not applicable.
FUNDING
None.
CONFLICTS OF INTEREST
The authors declare no conflict of interest, financial or otherwise.
ACKNOWLEDGEMENTS
Few segments of experimentation work were done in UIET, Panjab University.

