All published articles of this journal are available on ScienceDirect.

Analysis of Brain Structure and Neural Organization in Dystrophin-Deficient Model Mice with Magnetic Resonance Imaging at 7 T
Authors Info & Affiliations
Abstract
Background:
Dystrophin strengthens muscle cells; however, in muscular dystrophy, dystrophin is deficient due to an abnormal sugar chain. This abnormality occurs in skeletal muscle and in brain tissue.
Objective:
This study aimed to non-invasively analyze the neural organization of the brain in muscular dystrophy. We used a mouse model of muscular dystrophy to study whether changes in brain structure and neurodegeneration following dystrophin deficiency can be assessed by 7T magnetic resonance imaging.
Methods:
C57BL/10-mdx (X chromosome-linked muscular dystrophy) mice were used as the dystrophic mouse model and healthy mice were used as controls. Ventricular enlargement is one of the most common brain malformations in dystrophin-deficient patients. Therefore, we examined whether ventricular enlargement was observed in C57BL/10-mdx using transverse-relaxation weighted images. Brain parenchyma analysis was performed using diffusion MRI with diffusion tensor images and neurite orientation dispersion and density imaging. Parenchymal degeneration was assessed in terms of directional diffusion, nerve fiber diffusion, and dendritic scattering density.
Results:
For the volume of brain ventricles analyzed by T2WI, the average size was 1.5 times larger in mdx mice compared to control mice. In the brain parenchyma, a significant difference (p < 0.05) was observed in parameters indicating disturbances in the direction of nerve fibers and dendritic scattering density in the white matter region.
Conclusion:
Our results show that changes in brain structure due to dystrophin deficiency can be assessed in detail without tissue destruction by combining diffusion tensor images and neurite orientation dispersion and density imaging analyses.
1. INTRODUCTION
The dystrophin gene has both mechanical and non-mechanical roles, such as binding to the intracellular actin network to connect the cytoskeleton and basement membrane to muscle cells, stabilizing the muscle sheath, and protecting muscle cells from contractile damage. Thus, dystrophin is both a component of muscle and a protector of muscle [1]. In muscular dystrophy, the dystrophin that strengthens muscle cells is deficient due to an abnormal sugar chain. Consequently, membrane disruption, the influx of extracellular fluid, abnormal muscle contraction, and increased proteolysis occur [2, 3]. Skeletal muscle abnormalities and congenital brain formation abnormalities may also occur.
Mice that selectively exclude dystroglycan from Schwann cells show incomplete axonal structures and villi, resulting in neurological damage [4]. Additionally, the choroid plexus epithelium, including the villi that make up the ventricles, has the structure and properties of a leaky epithelium capable of transporting iso-osmotic fluid [5]. When ependyma, which constitutes the basis of villi, becomes abnormal, the cerebral ventricles become enlarged and hydrocephalus is more likely to occur [6, 7]. Destruction and degeneration of the periventricular white matter were observed in mice artificially induced by kaolin injection to cause severe hydrocephalus [8]. Thus, indirect effects, such as the development of hydrocephalus due to dystrophin deficiency, and direct effects on neurons have been revealed. Recent studies have shown that glycosylation defects reduce the ability of dystroglycan to affect morphogenesis, early development, and synaptogenesis in many tissues, including the brain, peripheral nerves, and epithelium [9]. Thus, the effects of a defective dystrophin gene on the brain are substantial. It is thus important to explore the mechanism of brain degeneration in muscular dystrophy.
It should be noted that all of these studies are invasive pathological studies, since a noninvasive method of analyzing brain parenchymal degeneration by MRI has not yet been established. In this study, we hypothesized that the effects of dystrophin deficiency on brain cells could be assessed by diffusion MRI which allows the examination of the microstructure of the brain [10]. We focused on diffusion tensor imaging (DTI), which allows us to visualize the structure of white matter nerves in the brain [11]. DTI, which was established in 1994 [12], takes advantage of the macroscopic geometrical arrangement of white matter bundles that become apparent through diffusion MRI measurements. DTI is a method used to analyze the anisotropy and isotropy of diffusion from diffusion information obtained by applying motion probing gradient (MPG) pulses in multiple directions. Many previously published studies have used DTI to evaluate neuronal white matter degeneration associated with tissue damage caused by diseases [13-15]. We hypothesized that DTI analysis, which can analyze anisotropic diffusion along with white matter, would allow us to study the neurodegeneration caused by dystrophin deficiency [4].
Additionally, recently proposed neurite orientation dispersion and density imaging (NODDI) analysis can use different intensity diffusion gradients to analyze more neural tissue microstructures than DTI [16]. NODDI analysis is a multicomponent model that uses MR diffusion data to capture the morphology of dendrites and axons. Neurodevelopmental and neurodegeneration analysis methods for various disease models have been reported [17, 18]. It has also been reported that the combination of NODDI and DTI analysis can identify differences in white matter fibers involved in edema, glioma, and axonal degeneration more clearly [19, 20]. By incorporating NODDI analysis, we considered that the degeneration of nerve structures could be analyzed in more detail from the viewpoint of nerve fiber diffusion and dendritic scattering density. In NODDI, the model assumes that the signals measured originate from a combination of intra-neurite (i.e., intracellular pool, which is modeled as restricted sticks, or hard cylinders with zero radius), extra-neurite (i.e., the extracellular pool, or anisotropically hindered diffusion), and free water (i.e., areas containing cerebrospinal fluid, modeled as isotropic diffusion) compartments, each of which produces a unique dependence of signal to diffusion-sensitizing setting in a pulse sequence. This allows compartment-specific measures of microstructural properties to be determined, such as the intra-neurite fraction and orientation dispersion index [16].
This study was the first step of brain image analysis in a muscular dystrophy mouse model. The purpose of this study was to explore the usefulness of NODDI and DTI analyses to evaluate a muscular dystrophy mouse model and to evaluate the effects of dystrophin deficiency on the brain using noninvasive image analysis.
2. MATERIALS AND METHODS
2.1. Animal Preparation
This experiment was approved by the animal ethics committee of the Central Institute for Experimental Animals (approval number: 19061). C57BL/10-mdx mice (mdx mice) were used as a dystrophic model and C57BL/10 mice (Wild Type (WT) control mice) as a comparison. C57BL/10 J is a sub-strain of C57BL and is of the same origin as C57BL/6J (Stock No. 000664), which is one of the most widely used inbred strains.
In these mice, there is a defect in the dystrophin-dystroglycan-laminin network due to mutation or knockout of one of the sarcoglycan complex genes (alpha, beta, gamma, or delta). Thus, the functional properties of muscles in these mice are altered [21]. Four male mice, each with muscular dystrophy and four without muscular dystrophy, were used. MRI measurements were initiated when the mice were 5 weeks old, and the time-series longitudinal measurements were performed from the age of 5 to 11 weeks. In all individuals, the weight from the beginning to the end of measurement was around 19–23 g. The C57BL/10-mdx model was generated at the Central Institute for Experimental Animals, which maintains and breeds mouse strains [22]. The mdx mouse model is a congenital mouse strain commonly used in studies of various muscles, including skeletal and cardiac muscles [23-25]. In brain studies, it has been reported that the number of neurons decreased by 50% in the cerebral cortex and brain stem in this strain [26], although few previous studies have targeted the brain in C57BL/10-mdx mice. Thus, C57BL/10-mdx with brain degeneration was the target for establishing a new mouse model of muscular dystrophy.
MRI was performed every week (except at 9 weeks of age). Thus, there was a total of six time points for all individuals. The duration of the experiment was approximately 2 h 30 min, and isoflurane (Isoflurane Inhalation Solution 250 mL, 205KOA, Pfizer Inc., New York, NY, USA) was used during the experiment. Isoflurane was used as anesthesia in this experiment for several reasons. First, it is easier to adjust the depth of inhalation anesthesia based on the experiment lengthcompared to injectable anesthesia, such as pentobarbitone or diethyl ether. Furthermore, it is safe and commonly used in clinical practice and animal experiments because the patients or subjects can be awakened in a short time [27]. Typical inhalation anesthetics include isoflurane and sevoflurane. There is a transient but significant effect on white matter microstructure in sevoflurane, so it has been suggested that these results should be considered in MRI studies of anesthetized animals [28]. Therefore, isoflurane was used in this experiment.
Before MRI, the isoflurane concentration was set to 3% and mixed with oxygen. During imaging, the isoflurane concentration was adjusted from 1.2% to 1.7% (mixed with oxygen to maintain a respiratory rate of 40–100 breaths per minute). The oxygen flow rate was set to 0.3 L/min. The rectal temperature was maintained at 35°C–36°C using a warm air blower (UNION ELECTRIC Co., Ltd.). A plastic bag was placed over the nozzle of the warm air nozzle to adjust the direction of the warm air so that it did not directly hit the mouse’s body.
2.2. MRI Equipment and Pulse Sequence
To maintain a high signal-to-noise ratio (S/N) [29], we used a 7.0 T Biospec 70/16 MRI (Bruker BioSpin, Ettlingen, Germany), which is a high field MRI system for animals, and a cryogenic quadrature radiofrequency surface probe (CryoProbe, Bruker, BioSpin AG, Fällanden, Switzerland). The cryoprobe can suppress thermal motion of the atoms and electrons of the metals that make up the circuit by cooling the detection circuit, including the detection coil, to a cryogenic temperature. The S/N of MRI is proportional to the inverse of the temperature of the coil and proportional to the Q value, which increases as electrical resistance decreases. Thus, S/N can be improved by suppressing electrical resistance and thermal noise. It has been reported that the use of a cryoprobe rather than a volume coil improves the S/N of mouse brain imaging approximately three-fold [30, 31]. Furthermore, cryoprobes can improve the quality of structural MRI, such as diffusion tensor images, and have been extensively used in previous studies [32, 33].
The orientation at the time of imaging was based on the coronal cross-section. During imaging, the mouse was immobilized on the MRI bed with ear bars and a support ring for the upper incisors to reduce movement artifacts [34]. In all cases, the mouse’s head surface was horizontal to the bed. We obtained coronal views by setting the imaging plane perpendicular to the midline and the parietal surface. Anatomical T2WI was performed with a rapid acquisition with refocused echoes (RARE) sequence (repetition time (TR) = 4500 ms, effective echo time (TE) = 24 ms, number of averages = 6, RARE factor = 8, scan time = 5 min 24 ms, field-of-view (FOV) = 14 mm × 14 mm, resolution = 140 μm × 140 μm, matrix = 100 × 100, and slice thickness = 280 μm) and transaxial orientations were used for evaluation of brain lesion.
The pulsed-gradient spin-echo echo planar imaging (PGSE–EPI) acquisition parameters were as follows: TR = 2000 ms, TE = 21.5 ms, number of averages = 2, b values = 1000 and 2000 s/mm2, number of B0 = 2, Δ/δ = 10/5.5, diffusion directions (axis) 30, FOV = 16 mm × 16 mm, resolution = 200 μm × 200 μm, matrix = 80 × 80, and slice thickness = 800 μm.
2.3. Image Analysis
To measure the volume of the brain ventricles, we produced the whole brain and ventricular mask images using T2WI. We used BrainSuite 19a (Shattuck et al., Biomedical Imaging Group, 2002) [35] to manually determine the mask image based on the coronal cross-section. BrainSuite provides an automatic and manual sequence to extract brain volume [36]. We manually created a mask for the entire brain and carefully included all cerebral structures from the cerebrum to the cerebellum. To construct a mask of the ventricular area, we manually selected only the part that exhibited abnormally high signal intensities compared with water within the entire brain mask area. The T2WI and mask images were then superposed, and the brain volume was measured with ITK-SNAP, www.itksnap.org [37] ITK-SNAP has been used in many studies as a tool for segmenting anatomical structures in 3D images, both manually and semi-automatically [38, 39].
For brain parenchymal analysis, we performed diffusion tensor analysis using the Diffusion Toolkit [40]. The b values of the DWI for calculating DTI were 0 and 2000 s/mm2. The NODDI images were calculated using NODDI (MATLAB Toolbox, http://www.nitrc.org/projects/noddi_toolbox, NITRC) from three shell DWIs with b values of 0, 1000, and 2000 s/mm2, respectively. Among all NODDI image parameters, we used the orientation dispersion index (ODI), intracellular volume fraction (ICVF), and kappa coefficient (KAPPA) to evaluate the brain parenchyma. ODI is a parameter that indicates the variance of orientation, while ICVF is an index of neural density. KAPPA is a Watson's distribution parameter that determines the ODI estimate [41]. KAPPA relates to ODI by the following equation: ODI = (2/π) arctan (1/kappa) [42].
We defined regions-of-interest (ROIs) in five brain parenchyma locations in white matter and gray matter (Fig. 1). CC and cerebral peduncle (CP) were selected as the white matter ROIs: CC is responsible for communication between the left and right hemispheres of the brain, while CP is responsible for transmitting the axons of the primary motor pathways that descend from the cerebral cortex to the spinal cord [43].
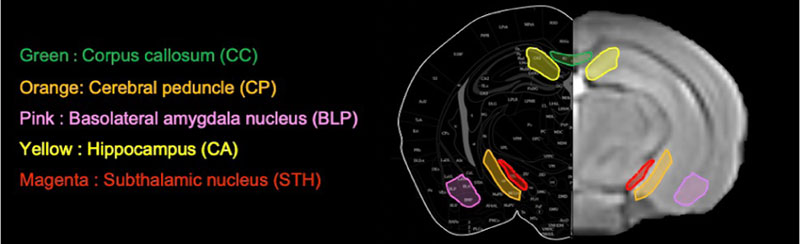
As a gray matter-rich region, we also analyzed STH, which is a component of the indirect tracts of the basal ganglia. CA and BLP were also extracted from gray matter regions. The amygdala (BL) is divided into three nuclei; in this study, we extracted the posterior part of the basolateral nucleus of the amygdala (BLP). BL plays an important role in reward, and BL lesions have significantly impaired reward-related behavior [44]. The BLP and CA act synergistically to form a circuit that influences long-term memory, spatial memory, and emotional memory. Gray matter ROIs were set in these two regions to examine the effects of dystrophin deficiency on areas controlling memory. ROIs for each brain region were created manually using ITK-SNAP and for brain volume analysis. The ITK-SNAP application is used to segment and quantify neuroimaging data, such as structural MRI [45]. We carefully set the five brain ROIs for each individual, referring to the atlas [46] based on the T2WI captured in this study. Subsequently, we analyzed the brain parenchyma by superimposing the created ROIs on each image. For the results of ROI analysis, we confirmed whether they were homoscedastic or unequal based on F-tests. Based on the t-test results of two homoscedastic samples or two non-homoscedastic samples, we assessed whether there were significant differences.
3. RESULTS
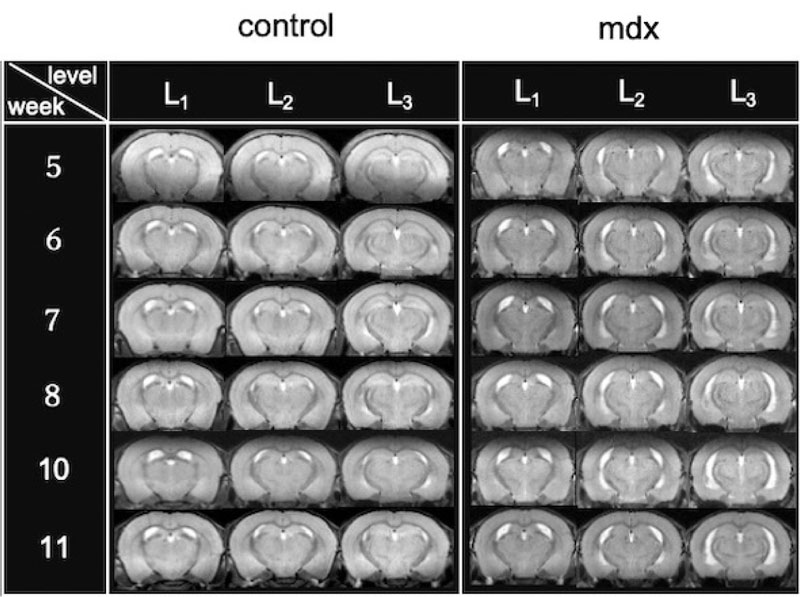
Dystrophin deficiency owing to muscular dystrophy can cause ventricular enlargement. Fig. (2) presents the coronal T2WI of control and mdx mice to assess whether ventricular hypertrophy can be observed.
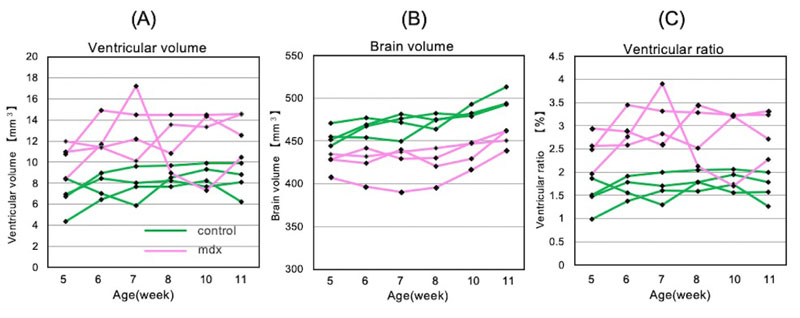
Experiments were conducted using control and the mdx mice. Fig. (2) shows images obtained by longitudinal measurements of one individual in each group. Cross-sections 2 and 3 of the mdx mice showed that the lateral brain ventricles were enlarged. Comparing the cross-sectional views of mdx mice from the 1st to 6th week, ventricular enlargement did not improve even when the mice grew up. Additionally, time-series longitudinal measurements were performed for these three measurements: ventricular volume, brain volume, and ventricular proportion (Fig. 3). As shown in Fig. (3A), mdx mice had, on average, 1.5 times larger brain ventricles than control mice. The proportion of brain ventricles was also higher in mdx mice, as shown in Fig. (3C-C). The proportion of the ventricles did not change significantly with growth, except for one individual. As shown in Fig. (2), ventricular enlargement in the mdx mouse group did not improve.
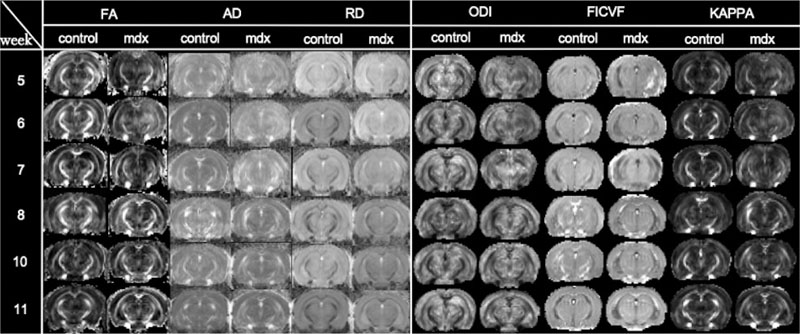
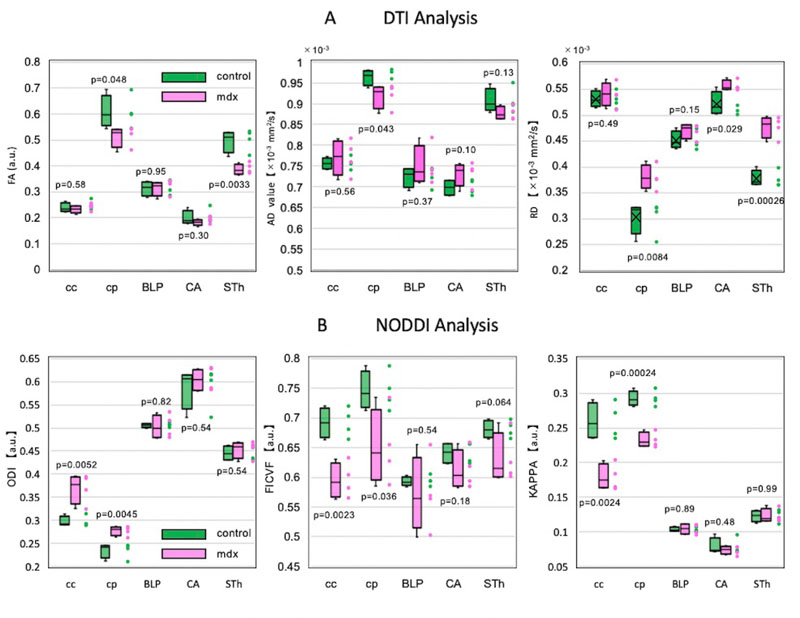
Regarding the results of brain parenchymal analysis, the images in Fig. (4) show DTI and NODDI images of cross-section 2 of the same individual in Fig. (2). There was no significant difference between control and mdx mice in terms of the change in the signal value on the images. The averages of all image parameters for all individuals in the control and mdx groups are shown in Fig. (5). As shown in Fig. (5A), the DTI results indicated a significant difference in the CP of white matter (p < 0.05). In contrast, no significant difference was found for CC, which is in the same white matter area. However, the results did show a significant difference in STH in the gray matter area. In the NODDI analysis, the CC and CP results showed a significant difference (p < 0.05) between the control and mdx groups for all parameters, as shown in Fig. (5B). Notably, most of the parameters in the NODDI results were more statistically significant (p < 0.001) than the DTI results. NODDI analysis did not show any significant difference in the gray matter area. In this study, the NODDI analysis was more consistent than the DTI analysis.
The total mean of the control and mdx groups by diffusion tensor image (DTI) analysis (A) and the total mean (B) of each group by neurite orientation dispersion and density imaging (NODDI) analysis are shown. The t-test results are presented near each boxplot as p-values (in this study, a significant difference was considered to be present when p value was < 0.05). For axial diffusivity (AD) and radial diffusivity (RD), the vertical axis represents the diffusion rate. Fractional anisotropy (FA), orientation dispersion index (ODI), intracellular volume fraction (ICVF), and KAPPA coefficient (KAPPA) are reported using arbitrary units (a.u.). Control and mdx mice are represented by the green and pink boxplots, respectively. The vertical axis represents each parameter value. The horizontal axis represents the five ROIs used in this study: corpus callosum (CC) and cerebral peduncle (CP) are white matter areas, whereas basolateral nucleus of the amygdala (BLP), hippocampus (CA), and subthalamic nucleus (STH) are gray matter areas (Fig. 5).
For CA and BLP, which are the regions associated with memory, no significant differences were found for the DTI and NODDI parameters, except for radial diffusivity for DTI parameters in CA.
4. DISCUSSION
In this study, we measured the volume of the brain ventricles and analyzed the severity of ventricular enlargement due to muscle dystrophy. Furthermore, the qualitative degeneration of the brain parenchyma was evaluated by DTI and NODDI analysis. Ventriculomegaly is one of the brain malformations caused by dystrophin deficiency [6, 7]. We also discussed the severity of ventricular degeneration obtained in this study.
4.1. Muscular Dystrophy and the Ventricles
As shown in Fig. (3C), mdx clearly had a higher proportion of brain ventricles overall. Previous studies have reported that hydrocephalus occurs due to ventricular enlargement attributed to dystrophin deficiency [47]. Thus, we inferred that dystrophin deficiency enlarged the brain ventricles of mdx mice. Conversely, the brain ventricular volume temporarily decreased in one mdx mice. In cases of increased cerebrospinal fluid volume and medulla oblongata edema, the ventricles may spontaneously rupture and hydrocephalus may improve; however, brain edema does not necessarily improve cerebral edema because of pressure gradients (ventricle to subarachnoid space) [48]. In this study, similar phenomena could explain the improved rapid ventricular enlargement in the studied mdx mice. In either case, we consider that the C57BL/10-mdx mice could reproduce the pathophysiology of muscular dystrophy from a morphological point of view.
4.2. DTI Analysis of Brain Parenchyma
DTI is a single ellipsoidal value that expresses the degree and direction of water’s permeability. A representative example is fractional anisotropy (FA), which indicates the degree of diffusion anisotropy with values that range from zero to one. Diffusion associated with increased degrees of freedom (i.e., water) yields FA values that approach zero. The FA value approaches unity when water diffusion is restricted by axons and myelin. In this way, DTI analysis can achieve visualization of the fine structure of the tissue in vivo [49, 50]. As shown by the results of this study, mice in which dystroglycan has been selectively removed from Schwann cells may develop neurological disorders due to incomplete myelin (axonal structure) and villi [4]. Thus, the FA results in CP show that the irregular axonal configuration allows for a high degree of freedom in diffusion.
The CC in white matter areas consists of commissural fibers that connect both hemispheres of the cerebrum [51]. The fibers connecting the prefrontal cortex and motor cortex cross at the middle region of the CC, while the fibers connecting the parietal cortex cross at the posterior region of CC [52]. As mentioned above, the crossed fibers in the CC may have caused crossing fibers [53, 54], which is a drawback of DTI analysis and may have affected the experimental results. Although DTI is convenient and simple, it has been reported that DTI has low-spatial resolution and is associated with large approximation error [55]. It has also been suggested that acquisition factors, such as the b-value and voxel size, affect the quantification of DTI parameters in the analysis of the CC [52]. The reason for the lack of a significant difference in CC in the DTI analysis in this study could relate to the disadvantages of DTI.
The results for CA and BLP in gray matter areas were not significantly different for most of the image parameters. Previous studies [56] have reported a decline in cognitive function and attention in patients with muscular dystrophy. Other studies have shown a decrease in brain-derived neurotrophic factor levels, which are important for brain tissue neuron growth and long-term memory in mdx mice [57, 58]. It has also been suggested that brain-derived neurotrophic factor levels interfere with synaptic connections by increasing leukocyte infiltration in the brain with increased levels of myeloperoxidase activity [59]. Research suggests that cognitive impairment in muscular dystrophy may be caused by alterations in neuromodulatory immune molecules in skeletal muscle and brain, as well as hypometabolism of glucose in the brain [60, 61]. These could be some reasons why no significant differences were found in those regions when we analyzed the degeneration of neurons in the brain by structural MRI.
A previous study pointed out that diffusion parameters may change when an unrelated region enters the analysis region [62]. In this study, unlike the NODDI analysis, the DTI analysis yielded a significant difference in the subthalamic nucleus (STH). STH has a stronger relationship with white matter than other cerebral cortex regions [63]. Thus, not only do we set the ROI carefully, but we should take measures to analyze with a thin slice image in the area where the gray matter and white matter are intricate.
4.3. NODDI Analysis of Brain Parenchyma
In NODDI, ICVF is an index of nerve density which tends to show a negative correlation with ODI, which indicates the orientation dispersion [64]. As expected, this study also showed high ICVF and low ODI in the CC and CP, which are WM regions surrounded by myelin sheaths and are thus highly cohesive. The NODDI parameter trends that appeared in WM were in close agreement with those of other researchers [16, 65]. Additionally, there was a significant difference between the mdx group and control group in CC and CP (p < 0.05). As mentioned above, mice in which dystroglycans are selectively removed from Schwann cells have incomplete myelin (axonal structures) and villi and may develop neuropathy [4]. There are reports that ODI increases with decreases in nerve cell density [66, 67]. Irregular axon composition leads to an increase in the ODI value in white matter regions. In this study, we speculated that the white matter tissue composition of mdx mice had changed.
Of the factors that may be directly affected by dystrophin deficiency in white matter, we consider the degeneration of astrocytes. The mdx mice of the same model in this study have a low expression level of astrocytes, which is one of the tissue structures of white matter [68]. Astrocytes are intricately linked to myelin in the white matter and serve as mediators of dystrophin-bearing vascular endothelial cells and neurons [69, 70]. It has been reported that AQP4 is decreased in the brains of mdx mice, which slows the drainage of water from the brain and causes astrocyte swelling and cellular brain edema [71, 72]. It is also possible that dystrophin-induced degeneration of astrocytes and other cells may have had specific effects on white matter in this study. Even if the white matter does not denature, hydrocephalus can indirectly affect the white matter. In rats with kaolin-induced hydrocephalus, ventricular enlargement causes edema in the white matter, thus causing mild cerebral ischemia and changes in brain energy metabolism according to nuclear magnetic resonance analyses [73]. This report suggested that the brain parenchyma has degenerated because of the indirect effect of increased intracranial pressure due to ventricular enlargement.
4.4. Limitations and Future Prospects
We could examine the degeneration of nerve tissue under dystrophin deficiency by diffusion MRI analysis in this study. However, it was difficult to judge whether the reasons for degenerating nerve tissue were attributed to direct neurodegeneration owing to the dystrophin deficiency or indirect degeneration caused by ventricular enlargement. Even in the same brain region, we needed to analyze parts closer to the brain ventricles and parts farther from them to confirm if there were any differences in the results. In this study, the NODDI analysis results were more consistent than the DTI analysis results. NODDI analysis enabled us to quantify the variation in the neural tissue and quality of fibers by modeling not only the anisotropy of fibers but also the information inside and outside axonal nerve cells. NODDI analysis is specific to neurons and is unaffected by neuronal extracellular space, such as glial cell density [74]. Relative to NODDI (i.e., multi-shell), a distinctive feature of DTI is that despite a small amount of data (i.e., single shell), the sensitivity is high [75]. There are reports recommending the use of NODDI to complement DTI analysis [76-78].
This study showed that it is possible to evaluate cranial nerve degeneration in muscular dystrophy model mice using structural MRI analysis. Combining DTI and NODDI can analyze changes in neural structure in a more multifaceted manner. This innovative MRI technique can be used to evaluate neurodegeneration in the brain without brain sections. We anticipate that diffusion MRI will enable new prospects for the exploration of the brain.
CONCLUSION
In this study, we were able to analyze the enlarged ventricles in muscular dystrophy model mice using imaging methods. The findings indicate that dystrophin deficiency causes degeneration in the ventricles of the brain. In addition, structural MRI showed characteristic results in white matter and gray matter. The results are consistent with previous studies from a cytological point of view that dystrophin deficiency has an impact on the brain. Furthermore, by combining NODDI and DTI analysis, it was possible to evaluate neurodegeneration of the brain parenchyma from multiple perspectives. Overall, our results support that diffusion MRI can be used as a noninvasive imaging tool to assess brain neurodegeneration.
LIST OF ABBREVIATIONS
| AD | = Axial Diffusivity |
| BLP | = Posterior Basolateral Amygdala Nucleus |
| CA | = Cornu Ammonis |
| CC | = Corpus Callosum |
| CP | = Cerebral Peduncle |
| CSF | = Cerebrospinal fluid |
| DTI | = Diffusion Tensor Image |
| DWI | = Diffusion Weighted Image |
| EPI | = Echo Planar Imaging |
| FA | = Fractional Anisotropy |
| FOV | = Field-Of-View |
| ICVF | = Intracellular Volume Fraction |
| MDX | = X-chromosome-linked muscular dystrophy mouse |
| MPG | = Motion Probing Gradient |
| MRI | = Magnetic Resonance Imaging |
| NODDI | = Neurite Orientation Dispersion and Density Imaging |
| ODI | = Orientation Dispersion Index |
| PGSE | = Pulsed-Gradient Spin-Echo |
| RARE | = Rapid Acquisition with Refocused Echoes |
| RD | = Radial Diffusivity |
| ROI | = Region-Of-Interest |
| SPO2 | = Saturation of Percutaneous Oxygen |
| STh | = Subthalamic Nucleus |
| TE | = Echo Time |
| TR | = Repetition Time |
| T2WI | = T2-Weighted Images |
| WM | = White Matter |
| WT | = Wild Type |
ETHICS APPROVAL AND CONSENT TO PARTICIPATE
This experiment was conducted with the approval of the animal ethics committee of the Central Institute for Experimental Animals, Japan (approval number: 19061).
HUMAN AND ANIMAL RIGHTS
This article does not contain any studies involving human participants. This research was conducted in accordance with the provisions of the “Standards for the Care and Custody of Laboratory Animals and the Alleviation of Pain and Suffering” (Ministry of the Environment Notification No. 88, April 2006) established in accordance with the “Animal Welfare and Management Act".
CONSENT FOR PUBLICATION
Not applicable.
AVAILABILITY OF DATA AND MATERIALS
Not applicable.
FUNDING
This study was funded by JSPS KAKENHI (Grant Number JP20H03630 to J.H.) by MRI platform “(Grant Number JPMXS0450400621 to J.H., Y.K. and F.S.)” as a program of Project for Promoting Public Utilization of Advanced Research Infrastructure of the Ministry of Education, Culture, Sports, Science and Technology (MEXT), Japan.
CONFLICT OF INTEREST
The authors declare no conflict of interest, financial or otherwise.
ACKNOWLEDGEMENTS
We thank Dr. Masahiko Yasuda, Dr. Takuma Mizusawa, and Dr. Riichi Takahashi (Central Institute for Experimental Animals) for the preparation and supply of disease model animals.

