All published articles of this journal are available on ScienceDirect.

Divergences Between Resting State Networks and Meta-Analytic Maps Of Task-Evoked Brain Activity
Abstract
Background:
Spontaneous human neural activity is organized into resting state networks, complex patterns of synchronized activity that account for the major part of brain metabolism. The correspondence between these patterns and those elicited by the performance of cognitive tasks would suggest that spontaneous brain activity originates from the stream of ongoing cognitive processing.
Objective:
To investigate a large number of meta-analytic activation maps obtained from Neurosynth (www.neurosynth.org), establishing the extent of task-rest similarity in large-scale human brain activity.
Methods:
We applied a hierarchical module detection algorithm to the Neurosynth activation map similarity network, and then compared the average activation maps for each module with a set of resting state networks by means of spatial correlations.
Results:
We found that the correspondence between resting state networks and task-evoked activity tended to hold only for the largest spatial scales. We also established that this correspondence could be biased by the inclusion of maps related to neuroanatomical terms in the database (e.g. “parietal”, “occipital”, “cingulate”, etc.).
Conclusion:
Our results establish divergences between brain activity patterns related to spontaneous cognition and the spatial configuration of RSN, suggesting that anatomically-constrained homeostatic processes could play an important role in the inception and shaping of human resting state activity fluctuations.
1. INTRODUCTION
Brain metabolism consumes near 20% of the daily energy intake and this demand increases only 4% during cognitive effort, indicating that most of the energetic cost of brain activity is related to the spontaneous baseline fluctuations measured during rest, i.e., in the absence of sensory stimulation and task performance [1]. Due to this high metabolic cost, it has been conjectured that spontaneous brain activity is evolutionarily advantageous, playing a central role in the support of cerebral function [2].
Resting-state neuroimaging has been extensively explored to address this conjecture, with the objective of characterizing the properties of spontaneous brain activity in healthy and diseased participants, as well as during different levels of arousal and responsiveness [3]. The study of blood oxygen level-dependent coordinated functional magnetic resonance imaging (BOLD) (fMRI) signals have evolved considerably after the pioneering study of Biswal and colleagues, who demonstrated significant synchronization (i.e., functional connectivity) of spontaneous brain activity measured at anatomically-distant brain regions [4]. This study demonstrated that resting-state BOLD signal fluctuations should not be dismissed as measurement noise, since their spatial organization reflects the underlying architecture of the cerebral cortex [5]. Moreover, the statistical properties of spontaneous BOLD signal time series in the time and frequency domains are characteristic of other biological systems capable of complex information processing, further suggesting a neurobiological origin for resting-state brain activity [6-8].
The non-trivial spatiotemporal organization of resting-state activity was investigated using data-driven methods, such as independent component analysis (ICA), revealing large-scale brain-wide patterns of synchronized spontaneous activity [9]. These patterns, which are frequently known as resting-state networks (RSN), outline well-known functional systems of the brain, such as the medial and lateral visual cortices, the auditory and sensorimotor cortices, and temporal-frontal-parietal networks linked to spontaneous conscious mentation (default mode network), executive control, and attention [9, 10]. RSN can be reproduced robustly across species [11, 12] and human subjects [10], can be obtained from single-subject fMRI recordings [13], present idiosyncratic alterations in several neurological and psychiatric conditions [14], and are correlated with simultaneous electrophysiological measurements of brain activity [15, 16]. Taken together, these results underscore the significance of RSN and the relevance of understanding their origin and their functional role.
It has been proposed that RSN could originate from the spontaneous and unconstrained cognitive processes that take place during conscious wakefulness (e.g. mind-wandering) [17]. This hypothesis is compatible with the small increase in metabolism seen during mentally effortful tasks since the level of baseline spontaneous brain activity would already reflect the demands of ongoing cognitive processes; furthermore, it is also consistent with studies showing that resting-state activity can be used to decode mental states [18, 19], as well as to predict performance in motor and perceptual tasks [20-24]. Adding further support to this hypothesis, a seminal study by Smith and colleagues demonstrated a direct correspondence between the spatial configuration of RSN and task-evoked activity patterns, obtained by applying ICA to a large database of brain activation maps (www.brainmap.org) [25]. The authors were capable of matching all major RSN to the independent components extracted from this database, resulting in the data-driven assignment of a functional role to each network, thus favoring the hypothesis of RSN as the byproduct of ongoing spontaneous cognition.
The findings of Smith et al. have been corroborated using other methods and databases [26-30], in particular, using the Neurosynth platform [31], which combines natural language processing and machine learning to mine activation coordinates from a very large set of published articles (>15.000 articles at the time the present analyses were conducted). The similarity between spontaneous and resting-state activity patterns informs the theoretical perspective of a dynamic baseline, where spontaneous brain activity can be understood as a trajectory unfolding in the proximity of attractors representing different task-related brain configurations, thus being capable of rapidly transitioning towards these configurations as a response to environmental threats and demands [32] (in this context, “similarity” indicates the spatially correlated distribution of values across maps, usually corresponding to z scores or other voxel-wise test statistics). While theoretically attractive, this account is challenged by the persistence of RSN during deeply unconscious states (and presumably lacking cognitive processing), such as slow-wave sleep, general anesthesia, and unresponsive wakefulness syndrome in brain-injured patients [33-35]. These observations are consistent with the alternative hypothesis of RSN originating from homeostatic processes constrained by brain anatomy, especially by long-range structural connections between cortical and subcortical regions [5], which limit the disintegration of RSN during unresponsiveness [36, 37].
Here, we review the correspondence between evoked and spontaneous brain activity, establishing that it could be inflated by two sources of bias that failed to be considered in most previous studies. Instead of focusing on task-rest similarity at the coarsest spatial resolution by default, we performed hierarchical clustering of the Neurosynth activation maps and showed that this similarity held only for the largest spatial scales. We also showed that this correspondence could be biased by the inclusion of maps related to anatomical terms (e.g. “parietal”, “occipital”, “cingulate”, etc.), resulting in clusters that more closely resemble the outline of major RSN. Taken together, these results constitute a challenge to ongoing cognition as the only source of spontaneous brain activity and suggest that anatomically-constrained homeostatic processes could also represent an important contributing factor.
2. MATERIALS AND METHODS
2.1. Neurosynth Association Test Maps
Neurosynth is an automated framework to extract activation coordinates and synthesize association and uniformity test maps based on text-mining and machine learning techniques. Each of these maps is linked to a term that is frequently found in the neuroimaging literature, e.g. “language”, “parietal”, and “motor”. The uniformity test map of a given term contains high z-score values in a brain region if the articles using that term consistently report activations in that region. The association test map of a given term is similar, except that it also considers the likelihood of the region being reported as activated in articles that do not include the term, thus controlling for the base rate occurrence of the terms and increasing the specificity of the resulting activation maps (For more information, see www.neurosynth.org or the original publication by Yarkoni and colleagues) [31].
A total of 3072 association test maps were downloaded from Neurosynth, each corresponding to an individual term in the database. Repeated or redundant terms were discarded after manually verifying that their associated maps presented a high degree of overlap with maps already included in the analysis. The resulting terms were divided into a set that referenced cognitive processes (e.g. “vision”, “language”, “emotion”, “decision making”; N=400) and another that contained neuroanatomical terms (e.g. “occipital”, “parietal”, “temporal”, “pre-frontal”; N=409). The terms that did not fit into either category (e.g. names of neuropsychiatric diseases) were discarded from further analysis.
2.2. Map Similarity Network
Two weighted undirected networks were constructed from the association test maps linked to cognitive and neuroanatomical terms, respectively. In these networks, nodes corresponded to activation maps, and the edge weights reflected the degree of spatial similarity between the connected maps. To estimate this similarity, each map was first thresholded using a false discovery rate (FDR) criterion of 0.01 (i.e. 1% false positives) and then downsampled from 2 x 2 x 2 mm to 4 x 4 x 4 mm. This step was performed to reduce the computational costs of obtaining and storing in memory the 3072 x 3072 adjacency matrix of the graph similarity network (considering the spatially homogeneous downsampling and the typical number of voxels in each activation map, this step is unlikely to distort the similarity metric between maps). Given maps Mi and Mj (corresponding to the i-th and j-th nodes of the network), their similarity was computed using the Jaccard index, i.e. Wij = |Mi∩ Mj|/|Mi ∪ Mj|, where Wij represents the weighted adjacency matrix of the network.
2.3. Hierarchical modular decomposition of map similarity networks
An algorithm based on the spectral decomposition of the weighted adjacency matrix [38] was employed to obtain modules at different spatial scales. This algorithm explores partitions into modules with the purpose of maximizing the generalized definition of Newman’s modularity, given by  . In this equation, m is the total number of edges in the network, Wij is the weighted adjacency matrix, ki is the sum of weights attached to the i-th node, and
  if nodes i-th and j-th belong to the same module in the partition, and 0 otherwise (here gi indexes the module containing node i). The parameter
  determines the resolution of the modular decomposition, i.e., the characteristic size of the resulting modules. By increasing the value of , the algorithm yields progressively smaller modules that are hierarchically contained into those obtained using smaller values. A diagram outlining this procedure is shown in Fig. (1).
For each value of , the modularity maximization algorithm grouped nodes (i.e., activation maps) into disjoint sets according to their pairwise spatial similarity. Each module was summarized by computing the average of all maps it contained. Afterward, the Pearson’s linear correlation coefficient between the average map and each of the individual maps was computed, and a word cloud representation of the associated terms was constructed using the correlation coefficient to determine the size of each term in the cloud.
To guarantee robust partitions, the modularity maximization procedure was applied 1000 times, and the partition corresponding to the highest modularity was identified with the optimal modular decomposition.
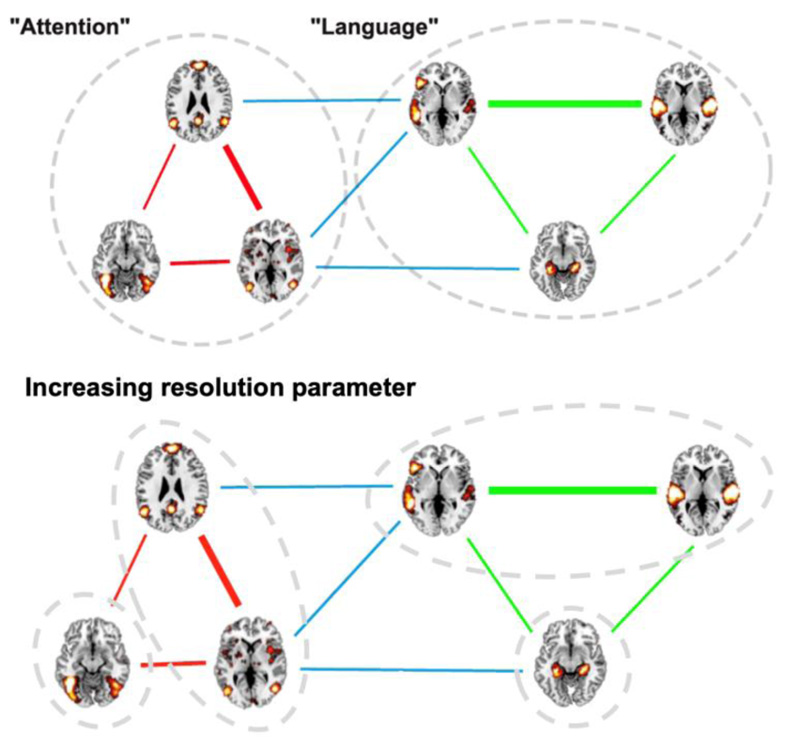 , the algorithm yields progressively smaller modules that are hierarchically contained into those obtained using smaller values, as illustrated in the bottom panel.
2.4. Similarity to RSN
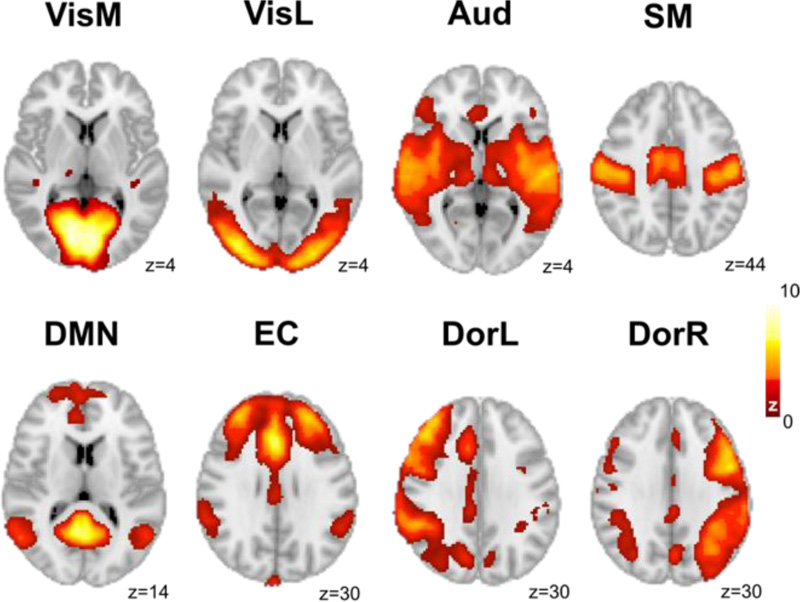
The average map obtained from each module was compared to the original set of 8 RSN published by Beckmann and colleagues [39], as shown in Fig. (2). The average maps were characterized by their linear correlation coefficient with the following RSN: medial visual (VisM), medial-lateral (VisL), auditory (Aud), sensorimotor (SM), default mode (DM), executive control (EC), dorsal right (DorR), and dorsal left (DorL). A threshold of R = ±0.3 was used to report the correlations; all correlations within this range were statistically significant with p<0.05, Bonferroni corrected for multiple comparisons.
An additional metric of statistical significance for the correlations was introduced, based on a spatial randomization procedure [40]. For this purpose, for each map 500 new instances were introduced by randomizing its phase on frequency space, i.e., applying a Fast Fourier Transform to the 3D volume of the map, randomizing the phases, and then back-transforming to the spatial domain. Next, the correlation coefficients between the RSN and the 500 randomized instances were computed, leading to p-values obtained by counting the number of instances, where the correlation with the spatially randomized maps was higher than the correlation computed using the unshuffled maps, divided by the total number of instances (500). The main advantage of this procedure is that significance is assigned relative to the correlations obtained for a null model consisting of maps with preserved first-order statistics (including spatial extent), but the randomized spatial distribution.
3. RESULTS
The main results of our analysis are summarized in Fig. (3) (for the terms related to cognitive functions) and Fig. (4) (for the neuroanatomical terms). Each figure represents a hierarchical set of modules obtained by progressively increasing the resolution parameter (the parameter values used to obtain each module are given in the figure captions). Each module is summarized by the average of all its activation maps, by the word cloud indicating the relative importance of its terms, and by the similarity (i.e., linear correlation coefficient) between its average map and the RSN defined by Beckmann and colleagues [39]. As increases, the modules can unfold into smaller sub-modules; in Figs. (3 and 4), this process is represented by a colored outline that contains both the “parent” and “children” modules.
3.1. Terms linked to cognitive functions
Association test maps corresponding to terms linked to cognitive functions were first divided into two modules: emotion/reward and memory/speech/language (Fig. 3, red hierarchy). The first of these two contains the amygdala and nucleus accumbens, and is related to terms, such as “emotion”, “happy”, “anxiety”, “reward”, “anticipation” and “prediction”. As increased, this module unfolded into one module specific to emotion-related terms (map 2, including the amygdala) and another specific to reward-related terms (map 3, including the nucleus accumbens). None of the maps in this hierarchy presented significant similarities to any of the RSN.
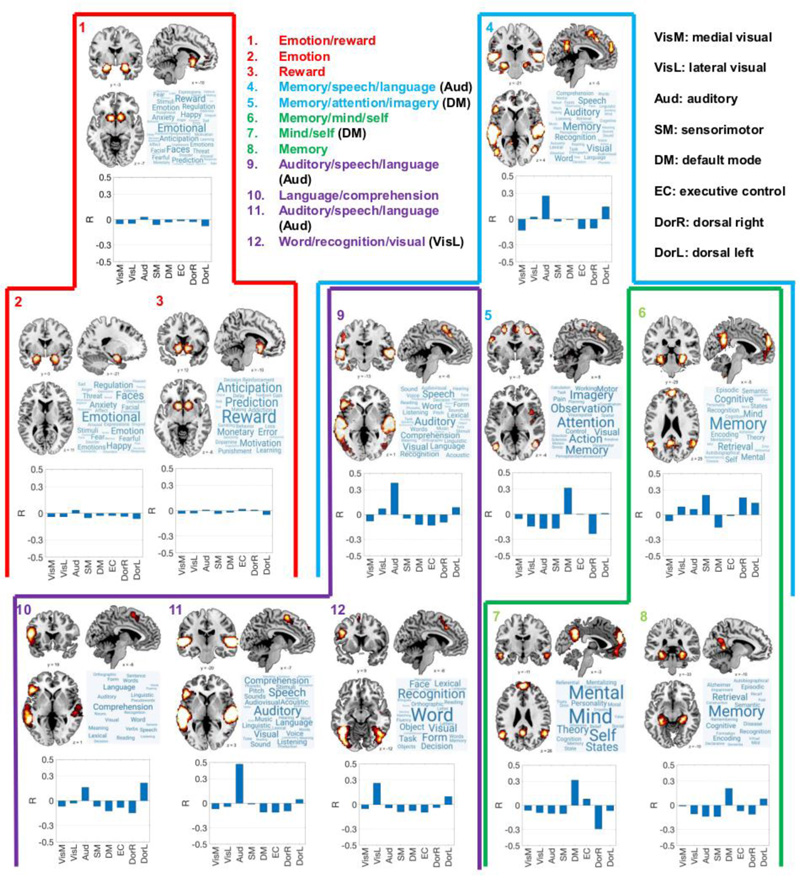 was increased; map 4 into maps 9, 5, and 6; map 9 into maps 10, 11, and 12; map 6 into maps 7 and 8. Insets contain the name of each module as inferred from the word clouds. The abbreviated names of RSN present significant (|R| 0.3) correlations with the average map appear next to the module name. The values used to obtain this hierarchical modular decomposition were 0.1 (maps 1 and 4), 0.6 (maps 2, 5, 6, 9), 1.2 (map 11), and 2 (maps 3, 7, 8, 10,12).
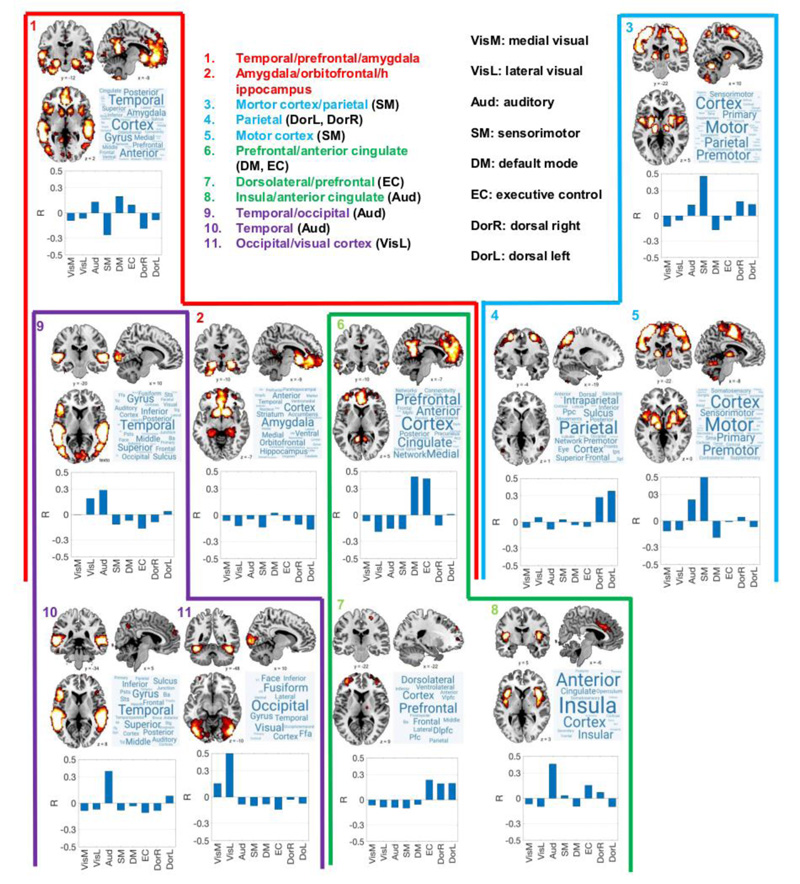 was increased; map 3 into maps 4 and 5; map 9 into maps 10 and 11; map 6 into maps 7 and 8. Insets contain the name of each module as inferred from the word clouds. The abbreviated names of RSN present significant (|R| 0.3) correlations with the average map appear next to the module name. The values used to obtain this hierarchical modular decomposition were 0.3 (maps 1 and 3), 0.4 (map 9), 0.9 (maps 4, 5, 10, 11), 1.2 (maps 2, 6), and 1.4 (map 7, 8).
The module related to memory/speech/language presented a significant overlap with the auditory RSN and also included voxels within parietal, cingulate, and hippocampal regions (Fig. 3, blue hierarchy). This module unfolded into three maps: one related to speech and language (map 9), another related to memory, attention, and imagery (map 5), and a third map related to memory and self-processing (map 6). Map 9 presents a significant overlap with the auditory RSN and contains the temporal lobes, but excluded the bilateral hippocampus (hence the term “memory” is absent from its word cloud). Map 5 is related to cortical regions involved with memory, imagery, and attention, and presents a significant overlap with the DMN. Map 6 contains the bilateral hippocampi and related regions, consistently with the words represented in its word cloud (“memory”, “encoding”, “retrieval”, “episodic”, etc.); however, this module did not present a significant correlation with any of the RSN.
Maps 9 and 6 could be further subdivided by increasing the resolution parameter (Fig. 3, purple and green hierarchies). The auditory/speech/language module (map 9) was divided into a module specific to language comprehension (map 10), another specific to auditory perception (map 11, presenting a high overlap with the auditory RSN), and a map linked to visual object recognition, including terms, such as “visual”, “word”, “form”, “face”, “recognition”, “object”, and others (map 12, overlapping with the lateral visual RSN).
Finally, map 6 (memory/mind/self) unfolded into map 7 (cortical regions related to self-consciousness and the theory of mind, overlapping with the DMN) and map 8 (hippocampal and related regions, related to memory encoding and retrieval).
When determined using the non-parametric spatial randomization procedure described in Section 2.4, only map 11 presented a significant (p<0.05) correlation with an RSN (Aud network).
3.2. Neuroanatomical Terms
The network of activation maps linked to neuroanatomical terms (Fig. 4) was first divided into two modules, roughly representing temporal, frontal, and pre-frontal and certain subcortical structures (map 1) and another representing motor and sensory areas in the prefrontal and parietal lobe, respectively (map 3, with significant overlap with the sensorimotor RSN).
The first of these two modules (Fig. 4, red hierarchy) unfolded into a map outlining the temporal and occipital lobes (map 9, overlapping with the temporal RSN), another representing the amygdala/orbitofrontal cortex/hippocampus (map 2), and a third module including the prefrontal cortex and the anterior cingulate (overlapping with the default mode and executive control RSN).
The second of the two initial modules, the motor cortex/parietal module (Fig. 4, blue hierarchy), unfolded into a module including parietal regions (map 4, overlapping with left and right dorsal attention RSN) and another outlining motor and prefrontal areas (map 5, overlapping with the sensorimotor RSN).
Map 9 (Fig. 4, purple hierarchy) was further subdivided into a module specific to the temporal lobe (map 10, overlapping with the auditory RSN) and an occipital module, including the fusiform gyrus (map 11, correlated with the lateral visual RSN). Map 6 (Fig. 4, green hierarchy) unfolded into a prefrontal/dorsolateral map overlapping with the executive control RSN (map 7) and another map containing the insula and the anterior cingulate cortex (map 8), which correlated with the auditory RSN.
In summary, all except two of the modules obtained from neuroanatomical terms presented significant overlap with at least one RSN. When determined using the non-parametric spatial randomization procedure described in Section 2.4, several maps presented significant correlations with RSN (map 3 with SM network, map 6 with DMN and EC networks, map 5 with SM network, map 11 with VisL network, and map 8 with Aud network).
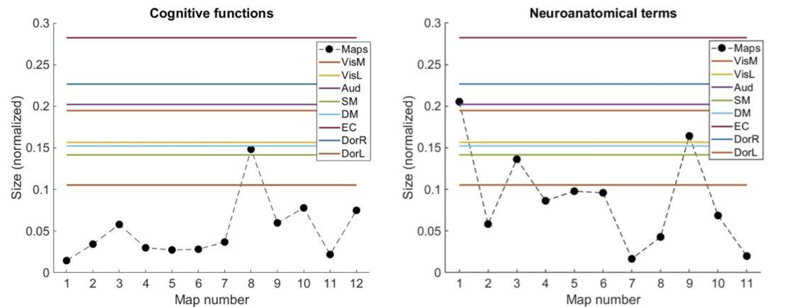
Finally, we investigated whether these results could be related to systematic differences in the spatial extent of the average activation maps, as shown in Figs. (3-5) shows the size (in voxels, normalized by the total amount of grey matter voxels) of all the maps. Clearly, the extent of the averaged activation maps was systematically smaller compared to the RSN; however, this was observed for both sets of maps, except for the maps 1, 3, and 9 associated with neuroanatomical terms (Fig. 5, right panel). Interestingly, only two of these maps (1 and 3) presented significant overlap with an RSN, and several maps with a small spatial extent showed significant correlations with RSN, suggesting that the normalized number of voxels does not directly predict the similarity between RSN and averaged activation maps. It should be noted that the procedure introduced in Section 2.4. to estimate the statistical significance of the overlap between maps is not biased by their size.
4. DISCUSSION
The origin and function of spontaneous brain activity remain two of the most outstanding unsolved problems in human neuroimaging. Early studies investigated whether RSN could be dismissed as artefacts resulting from brain vasculature and physiological noise related to respiration [41-43]; however, the neural origin of these fluctuations was amply supported by multimodal imaging studies conducted in humans and animal models [15, 16, 44, 45]. In particular, the hypothesis of unconstrained cognitive processing as the principal source of coordinated spontaneous activity fluctuations gained acceptance after a seminal study proved that RSN could be put in correspondence with the independent components obtained from a large number of meta-analytic task activation maps [25]. This result received further support from the study on task co-activation networks, as well as from studies that directly compared independent components obtained during task performance versus those obtained during rest [26-30].
The hypothesis of spontaneous cognitive processing as the origin of RSN is very attractive from a theoretical viewpoint. As a self-organized non-equilibrium dynamical system, the human brain continuously transverses different large-scale activity patterns [46]; in turn, the proximity of these patterns to those observed during cognitive processing ensures rapid reactivity upon environmental threats and demands [32]. This transient proximity can be realized by different dynamical mechanisms; for instance, an attractor ruins that drive the configuration of brain activity towards patterns reflecting different activation maps [47]. One problem with this hypothesis is that other factors seem to play an important role in resting-state activity fluctuations, even during brain states characterized by diminished or absent conscious cognition. For instance, resting-state activity fluctuations are constrained by large-scale anatomical connectivity [5] and local gene expression profiles [48], suggesting the presence of background homeostatic processes unfolding independently of task-evoked activity.
We attempted to replicate the meta-analytic results published by Smith and colleagues using a different method applied to a newer database of brain activations [31]. The main distinctive features of our study comprised the independent analysis of maps related to cognitive and neuroanatomical terms and the hierarchical clustering of overlapping activation maps. This analysis revealed that patterns similar to RSN tend to appear in the set of maps linked to neuroanatomical terms and that the similarities between RSN and proper cognitive activation maps are scale-dependent, i.e., at finer scales, the meta-analytic maps reflect activations localized at specific neuroanatomical structures (e.g. amygdala, hippocampus) that diverge from the distributed nature of RSN. As shown in Fig. (5), activation maps tended to be smaller (in terms of their normalized number of voxels) and more localized.
We highlight that our analyses can only question the strict correspondence between RSN and task-related maps derived from large meta-analytic databases. Other studies (including replication of Smith et al., 2008 [30]) found similarities between resting-state activity and activity patterns elicited by experimental tasks in a group of participants (i.e., without resorting to the analysis of BrainMap or Neurosynth), while others found significant modulations of resting-state activity by cognitive tasks [49]. A limitation of these analyses is the restricted number of tasks that could be examined, complicating the direct comparison with our results, especially considering that some of these studies also found discrepancies between resting state and evoked brain activity [50, 51].
It is important to note that spontaneous brain activity fluctuations could simultaneously emerge from unconstrained cognition and background homeostatic processes that are also present in states of deep unconsciousness (presumably lacking cognitive processing). Thus, the similarity between spontaneous and task-evoked activity could be time-dependent or even subject-dependent, depending on the extent of mind-wandering and other individual traits. Future studies should replicate these analyses in resting-state fMRI data combined with psychometric questionnaires or other instruments to assess the level of spontaneous cognition of the participants [17].
The hierarchical organization of brain structure and function has been repeatedly demonstrated in humans and other animal models by means of an ample spectrum of experimental techniques [52-54]. Our clustering of the Neurosynth database was consistent with the following observation: by increasing the resolution parameter of the module detection algorithm, we were able to unfold larger modules (i.e., clusters) into sub-modules, which progressively reflected specialized cognitive functions restricted to more precise neuroanatomical boundaries. For example, a DMN-like map linked to self-consciousness, social cognition, and memory was subdivided into a cortical frontoparietal network of regions strongly resembling the DMN (bilateral precuneus, temporoparietal junction, and orbitofrontal cortex) linked to the first two aforementioned functions, and another network restricted to regions within the medial temporal lobe (i.e., hippocampus, parahippocampus). The task-positive network comprising sensory, motor, executive, and attentional regions, was also subdivided as expected, with terminal clusters reflecting specific functions, such as auditory perception, object recognition (secondary visual areas), and language production and comprehension. In contrast, hierarchical clustering of resting-state brain activity yields distributed spatial patterns, which are very similar to RSN (or parts of RSN) and cannot be easily put in correspondence with the more specific maps, as presented in Fig. (3) [48, 55, 56].
CONCLUSION
In conclusion, we showed that the hierarchical grouping of Neurosynth activation maps associated with different cognitive functions departs from the RSN patterns that are robustly reproduced in humans. This observation does not eliminate the possibility of task-evoked activity patterns being similar to spontaneous activity fluctuations; however, this should be validated by experiments designed for this purpose, ideally gathering resting-state and task-evoked activity from the same sample of participants and characterizing the extent of spontaneous cognition and mind-wandering. Since both spontaneous cognition and baseline physiological processes constrained by neuroanatomy are likely to play a role in the origin of RSN, these contributions could be disentangled by factoring individual anatomical connectivity into the analyses, as well as by manipulating the level and content of unconstrained cognition.
ETHICS APPROVAL AND CONSENT TO PARTICIPATE
Not applicable.
HUMAN AND ANIMAL RIGHTS
Not applicable.
CONSENT FOR PUBLICATION
Not applicable.
AVAILABILITY OF DATA AND MATERIALS
Not applicable.
FUNDING
This work was supported by funding from the Agencia Nacional De Promocion Cientifica y Tecnologica (Argentina), and grant PICT-2018-03103.ANID/FONDECYT Regular 850 1220995 (Chile).
CONFLICT OF INTEREST
The authors declare no conflict of interest.
ACKNOWLEDGEMENTS
The authors would like to acknowledge the Agencia Nacional De Promocion Cientifica y Tecnologica (Argentina) for its financial support.

