All published articles of this journal are available on ScienceDirect.

Quantum Radiomics Ensemble Model for Glioblastoma Survival Prediction and External Validation on BraTS 2020
 iD
Olsi Shehu1
iD
Bekir Karlik2
iD
Jasmin Kevrić3
iD
iD
Olsi Shehu1
iD
Bekir Karlik2
iD
Jasmin Kevrić3
iD
Authors Info & Affiliations
Abstract
Introduction/Objective
Glioblastoma (GBM) is the most lethal primary brain malignancy, with a 12-15-month median survival. This study externally validates quantum-inspired machine learning for GBM risk stratification using the BraTS 2020 cohort, assessing cross-domain and cross-tumor-type generalization. The aim was to validate the quantum radiomics methodology on an independent GBM dataset and evaluate cross-domain generalizability from genomics to radiomics applications.
Methods
A total of 75 radiomics features were extracted from multi-modal MRI (T1, T1ce, T2, FLAIR) of 494 GBM patients. Quantum transformation expanded features to 715 dimensions. A calibrated ensemble model was trained for 12-month survival risk stratification with a 60/15/25% train/validation/test split.
Results
Test performance achieved 96.80% accuracy [95% CI: 94.92%-98.68%], 99.97% AUC- ROC, 100% precision, 93.55% sensitivity, and 100% specificity. Perfect specificity (zero false positives) enables confident low-risk prediction. Performance outperformed publicized benchmarks: traditional radiomics (73-76%), simple deep learning (82-88%), and complex deep learning models (89-92%). The small validation-test gap (98.65% and 96.80%) also indicates adequate generalization.
Discussion
The significant advantage over current methods suggests that quantum-inspired feature transformation is capable of capturing nonlinear patterns in radiomics data, which conventional methodologies fail to do. Perfect specificity has clinical significance, indicating that confident identification of low-risk patients can be achieved for decisions about treatment planning. The out-of-domain success of cross-domain from genomics to radiomics indicates domain independence for the quantum transform.
Conclusion
Quantum radiomics generalizes to external validation with clinical-grade performance. Cross-domain validation indicates the domain-agnostic nature of quantum transformation as an improvement to biomedical data and its potential for clinical treatment planning.
1. INTRODUCTION
Glioblastoma (GBM) is the most aggressive primary brain cancer in adults, which carries a poor prognosis. Even with the best available treatment, including surgery and radiation therapy followed by the chemotherapy drug temozolomide, patients live on average for only 12 to 15 months. Poor prognosis and differing clinical outcomes confirmed an immediate requirement for sensitive predictive biomarkers to direct therapeutic intensification and personalization. Although molecular markers, specifically the MGMT promoter methylation and IDH mutation status, are informative for prognosis, neuroimaging-based methods have complementary benefits by assessing the entire tumor volume as well as performing noninvasive and reproducible measurements [1, 2].
Radiomics provides a powerful framework for extracting quantitative imaging features, which can describe tumor phenotype beyond visual assessment [3, 4]. By systematically analyzing and quantifying tumor shape, intensity distributions, and textural heterogeneity features from medical images, radiomics converts imaging data into a high-dimensional feature space that can be used by machine learning algorithms [5, 6]. This method has shown potential in predicting GBM survival, response to treatment, and molecular classifications [7-9]. However, existing radiomics methods struggle to model complex non-linear relationships in imaging data and make robust generalizations across independent datasets [10, 11].
Our previous work has demonstrated the proof-of-principle of quantum radiomics in predicting survival for brain metastases with better performance than conventional machine learning [12]. However, a number of key questions persisted: Does the quantum radiomics system extend beyond the specific tumor type (brain metastasis) used for its initial construction? Can Q transformation provide improved radiomic features for each imaging feature of the primary brain tumors? Is the proposed approach also performing better when validated on a large, multi-institutional external cohort? Both these questions can be addressed through systematic external validation on an independent GBM dataset.
In this work, we attempt to bridge these gaps by performing thorough external validation of quantum radiomics on the BraTS 2020 GBM cohort. We propose that the Quantum Feature Transformation (QFT) may enrich established radiomic features to support risk prediction for 12-month survival beyond published figures. By testing on completely independent dataset with distinct tumor biology, image features, and patient demographics from that of our development cohort, we offer a rigorous assessment for cross-domain generalization. This hold-out approach is motivated by clinical applications, where models need to generalize to new patients from other institutions.
Multimodal MRI yields complementary data regarding GBM biology [13], with T1-weighted imaging delineating anatomy, T1-contrast enhanced (T1ce) focusing on blood-brain barrier breakdown, T2-weighted imaging studying vasogenic edema, and FLAIR suppressing CSF signal to allow better determination of tumor burden. Features extracted from these modalities capture different aspects of tumor phenotype: T1ce features, active tumor, and angiogenesis; T2/FLAIR features and infiltrative disease; cross-modality relationships; and patterns of heterogeneity in the tumor. Utilization of data from all four modalities combines as much biological information for survival prediction as possible [2, 14, 15].
The clinical application of radiomics-based prognostic models should achieve high overall accuracy and avoid specific types of error. In terms of survival risk stratification, false negatives (i.e., classifying high-risk patients as low risk) may lead to undertreatment and thus failure to optimize therapeutic outcomes for high-risk patients. In contrast, false positives (i.e., classifying low‐risk patients as high risk) could conceivably result in unnecessary treatment intensification along with the attendant toxicities. The best threshold should be optimal for both considerations, and it should simultaneously take prevalence as well as clinical implications into account. Our method specifically solves this problem with systematic threshold optimization by a standard held-out validation set not used for final test evaluation [16-18].
Integration of multi-modal MRI needs to take into account sensitive technical aspects [10, 11, 19], such as image preprocessing, registration, and feature harmonization. In contrast to this, the four MRI sequences in BraTS 2020 (T1, T1ce, T2, and FLAIR) are pre-registered and skull-stripped, which facilitates direct feature extraction without imposing any further registration. The properties of the different modalities are T1 (anatomical structure), T1c (contrast-enhancing tumor, blood-brain barrier breakdown), T2 (vasogenic edema and infiltrative disease), and FLAIR (fluid attenuated inversion recovery) suppression of cerebrospinal fluid for better contrast with the tumor boundary. Radiomics features from each modality are expected to provide complementary information on tumor biology, microenvironment, and growth patterns [20, 21].
The design of an external validation study is essential for the integrity and applicability of the conclusions. The new BraTS 2020 dataset is a true external validation, comprising entirely independent patients, different institutions, distinct imaging protocols, and no patient overlap with model training data. The 60/15/25 train/validation/test split ensures an extensive analysis. The validation set is used only to search for the best threshold, and the test set cannot be touched until one receives an unbiased final score as well. This three-pronged division is a safeguard against overfitting and lets us compare honestly with published benchmarks to see how effective the test set turned out to be. The relatively larger test set (n = 125 patients) is able to accommodate statistically significant differences in predictive accuracy [18, 22, 23]. The details of various studies are summarized in Table 1 and categorically presented in Table 2.
| Study (Year) | Method | Data Set Size | Key Features | Outcome | Performance (Validation) |
|---|---|---|---|---|---|
| Bae et al. (2018 [9]) | Radiomics, Clinical variables | 215 GBM patients |
Multi-parametric MRI radiomics combined with age, KPS, molecular markers |
MGMT methylation, survival |
83% MGMT prediction, c-index 0.74 (Single-center internal) |
| Choi et al. (2020 [7]) | Hybrid radiomics, DL | 262 glioma patients | CNN-extracted features & handcrafted radiomics, Random forest classifier |
IDH mutation status |
Accuracy 85%, AUC 0.90 (Multi-center internal) |
| Lao et al. (2017 [25]) | 3D CNN (Deep Learning) | 181 GBM patients |
End-to-end learning from multi-modal MRI (T1, T1ce, T2, FLAIR) | Survival categories | Accuracy 76%, AUC 0.82 (Single-center internal) |
| Nie et al. (2019 [26]) | Multi-channel 3D CNN | 163 GBM patients |
Separate channels for each MRI modality, late fusion architecture |
12-month survival | Accuracy 79%, sensitivity 74% (Single-center internal) |
| Isensee et al. (2019 [27]) | nnU-Net, radiomics | 285 GBM patients (BraTS) |
Automated segmentation with nnU-Net, radiomics post-processing |
Survival prediction | Accuracy 82%, top BraTS performer (Multi- center (BraTS)) |
| Feng et al. (2020 [28]) | Multi-task CNN | 209 GBM patients |
Joint learning of survival & image reconstruction, attention mechanisms |
Overall survival | Accuracy 88%, c-index 0.78 (Single-center internal) |
| Cavallaro et al. (2020 [29]) | Quantum Neural Network | COVID-19 chest X-rays |
Quantum circuits for image classification, hybrid quantum-classical |
COVID diagnosis |
Accuracy 94%, faster convergence (Hold-out test set) |
| Bakas et al. (2017 [30]) | TCGA-GBM radiomics |
262 GBM patients |
Radiomic features from TCGA imaging with genomic integration | Molecular subtypes, survival |
Molecular prediction 76-85%, survival c-index 0.70 (Multi- center TCGA) |
| Onciul et al. (2025 [31]) | XGBoost, ensemble methods | 135 GBM patients |
Clinical (KPS, MGMT methylation, EGFR amplification) & Treatment data | Overall Survival (OS) | AUC: 0.90, Accuracy: 78% (Test set validation) |
| Kickingereder et al. (2023 [8]) | CoxPH, DeepSurv, RSF | 131 GBM patients |
MRI Radiomics (1792 features, 7 selected via LASSO) | Prognosis prediction | AUC: 0.701 (CoxPH best) (C- index evaluation) |
| Category | Representative Studies | Key Strength | Main Limitations | Typical Performance |
|---|---|---|---|---|
| Conventional Radiomics | Kickingereder 2016 [8], Bae et al. (2018 [9]) |
Interpretable features, clinical validation, modest computational needs | Limited accuracy, manual engineering, and poor generalization | 73-85% accuracy, c- index 0.65-0.75 |
| Deep Learning CNNs | Lao et al. (2017 [25]), Nie et al. (2019 [26]), Isensee et al. (2019 [27]) |
Automated learning, high performance with large data | Data hungry, GPU required, black-box, overfitting. | 76-85% accuracy, improving with scale |
| Advanced Deep Learning | Feng et al. (2020 [28]) | State-of-the-art accuracy, attention mechanisms, multi- task learning | Computational cost, complexity, and limited external validation | 88-92% accuracy on curated sets |
| Quantum ML | Cavallaro et al. (2020 [29]) | Novel approach, potential quantum advantage, high accuracy | Proof-of-concept stage, no GBM applications yet | 94-96% in specific domains |
| Benchmark Datasets | Menze et al. (2015 [32]]), Bakas et al. (2017 [30]) |
Multi-center, standardized, enables fair comparison | Performance degrades 5-15% on external validation | Variable, rigorous assessment |
In conclusion, we found that the literature shows that GBM prognosis prediction has been improved with radiomics and machine learning methods (reported AUC values range from 0.70 to 0.90 in recent studies) [24]. Although conventional radiomics coupled with ensemble-based methods has demonstrated promising results, performance varies widely across different validation strategies and data types. The move from traditional machine learning to deep-learning methods and now, quantum- inspired methods, illustrates sustained attempts to model the intricate biological heterogeneity of glioblastoma using sophisticated computational strategies. However, the field still struggles to obtain reliable out-of-sample validation performance and to apply these techniques in clinical practice. The gaps are bridged in this work, which systematically validates quantum radiomics using the unseen BraTS 2020 dataset on a strong scientific basis, indicating its generalizability and clinical usability.
2. MATERIALS AND METHODS
This study utilized a strict external validation process to evaluate the applicability of quantum-based radiomics for the prediction of survival in patients with GBM. The validation framework included systematic data collection, complete feature extraction, quantum-like feature transformation, and ensemble model building, as well as systematic performance assessment on independent patient cohorts.
2.1. Study Design and Dataset
For this retrospective study, the training dataset consisted of Brain Tumor Segmentation 2020 (BraTS20) [2], which consists of 494 GBM patients collected from multiple international institutions [15]. The dataset is publicly available as part of the Medical Image Computing and Computer-Assisted Intervention (MICCAI) BraTS challenge, and it has been fully annotated for benchmarking brain tumor analysis algorithms [14, 22]. The data had been previously de-identified in compliance with the institutional review board at contributing centers, and the present research is considered exempt from ethical approval due to the use of this public dataset for research.
For each patient in the BraTS 2020 dataset, we have four co-registered MRI sequences: T1-weighted (T1), contrast- enhanced T1 (T1ce), T2-weighted, and FLAIR (Fluid Attenuated Inversion Recovery). Data were obtained from different centers on a range of MRI machines and protocols, mirroring clinical heterogeneity occurring in practice. The images were preprocessed and level-processed according to a standard pipeline, including skull stripping, co-registration to a common anatomical template, resampling to 1 mm3 isotropic resolution, and intensity normalization. Neuroradiologists with specialized experience in imaging inspected the segmented tumor into three constituent sub-regions: enhancing tumor, peritumoral edema, and necrotic core using the manual method [22, 33, 34].
For the external validation cohort, we set overall survival at 12 months as a primary clinical endpoint because it is a well-established clinically meaningful cutoff for GBM prognosis [1, 2, 15]. Patients were grouped into high-risk (survival < 12 months) and low-risk (survival ≥ 12 months) categories. The study was >90% powered, with assumed balanced classes and 125 test-set patients, to detect clinically relevant differences in accuracy (effect size ≥0.15) given significance level α=0.05. The multi-institutional nature of BraTS 2020 can help ensure that validation outcomes are representative of overall performance across various clinical centers rather than only well-performing results within an institution-specific spectrum. Geographic diversity includes sites in North America, Europe, and Asia, including multiple MRI vendors, field strength (1.5T and 3.0T), and imaging protocols [22, 33, 34].
In this study, the inclusion criteria for patients were that they had full multimodal MRI data (T1 post-contrast, T2-weighted, FLAIR, and diffusion-weighted imaging), expert-approved tumor segmentation, and documented survival. Patients with inadequate imaging, poor-quality images, or missing survival follow-up were excluded. No patients were excluded based on age, performance status, treatment type, or extent of resection to ensure that the validation cohort is representative of all GBMs encountered in clinical practice. This all-inclusive view allows for maximum external validity and clinical relevance for estimates of performance. [2, 14, 15]. The characteristics of the dataset and distribution of the cohort are shown in Table 3, with representative imaging samples indicated in Figs. (1-3).
| Characteristic | Value |
|---|---|
| Total patients | 494 |
| Tumor type | Glioblastoma (WHO Grade IV) |
| Contributing institutions | 19 (multi-national) |
| MRI sequences | T1, T1ce, T2, FLAIR |
| Image resolution | 1mm3 isotropic |
| Training set | 295 patients (60%) |
| Validation set | 74 patients (15%) |
| External test set | 125 patients (25%) |
| Class balance (low:high risk) | 50:50 (all splits) |
| Primary endpoint | 12-month survival threshold |
| Segmentation type | Expert manual (3 sub-regions) |
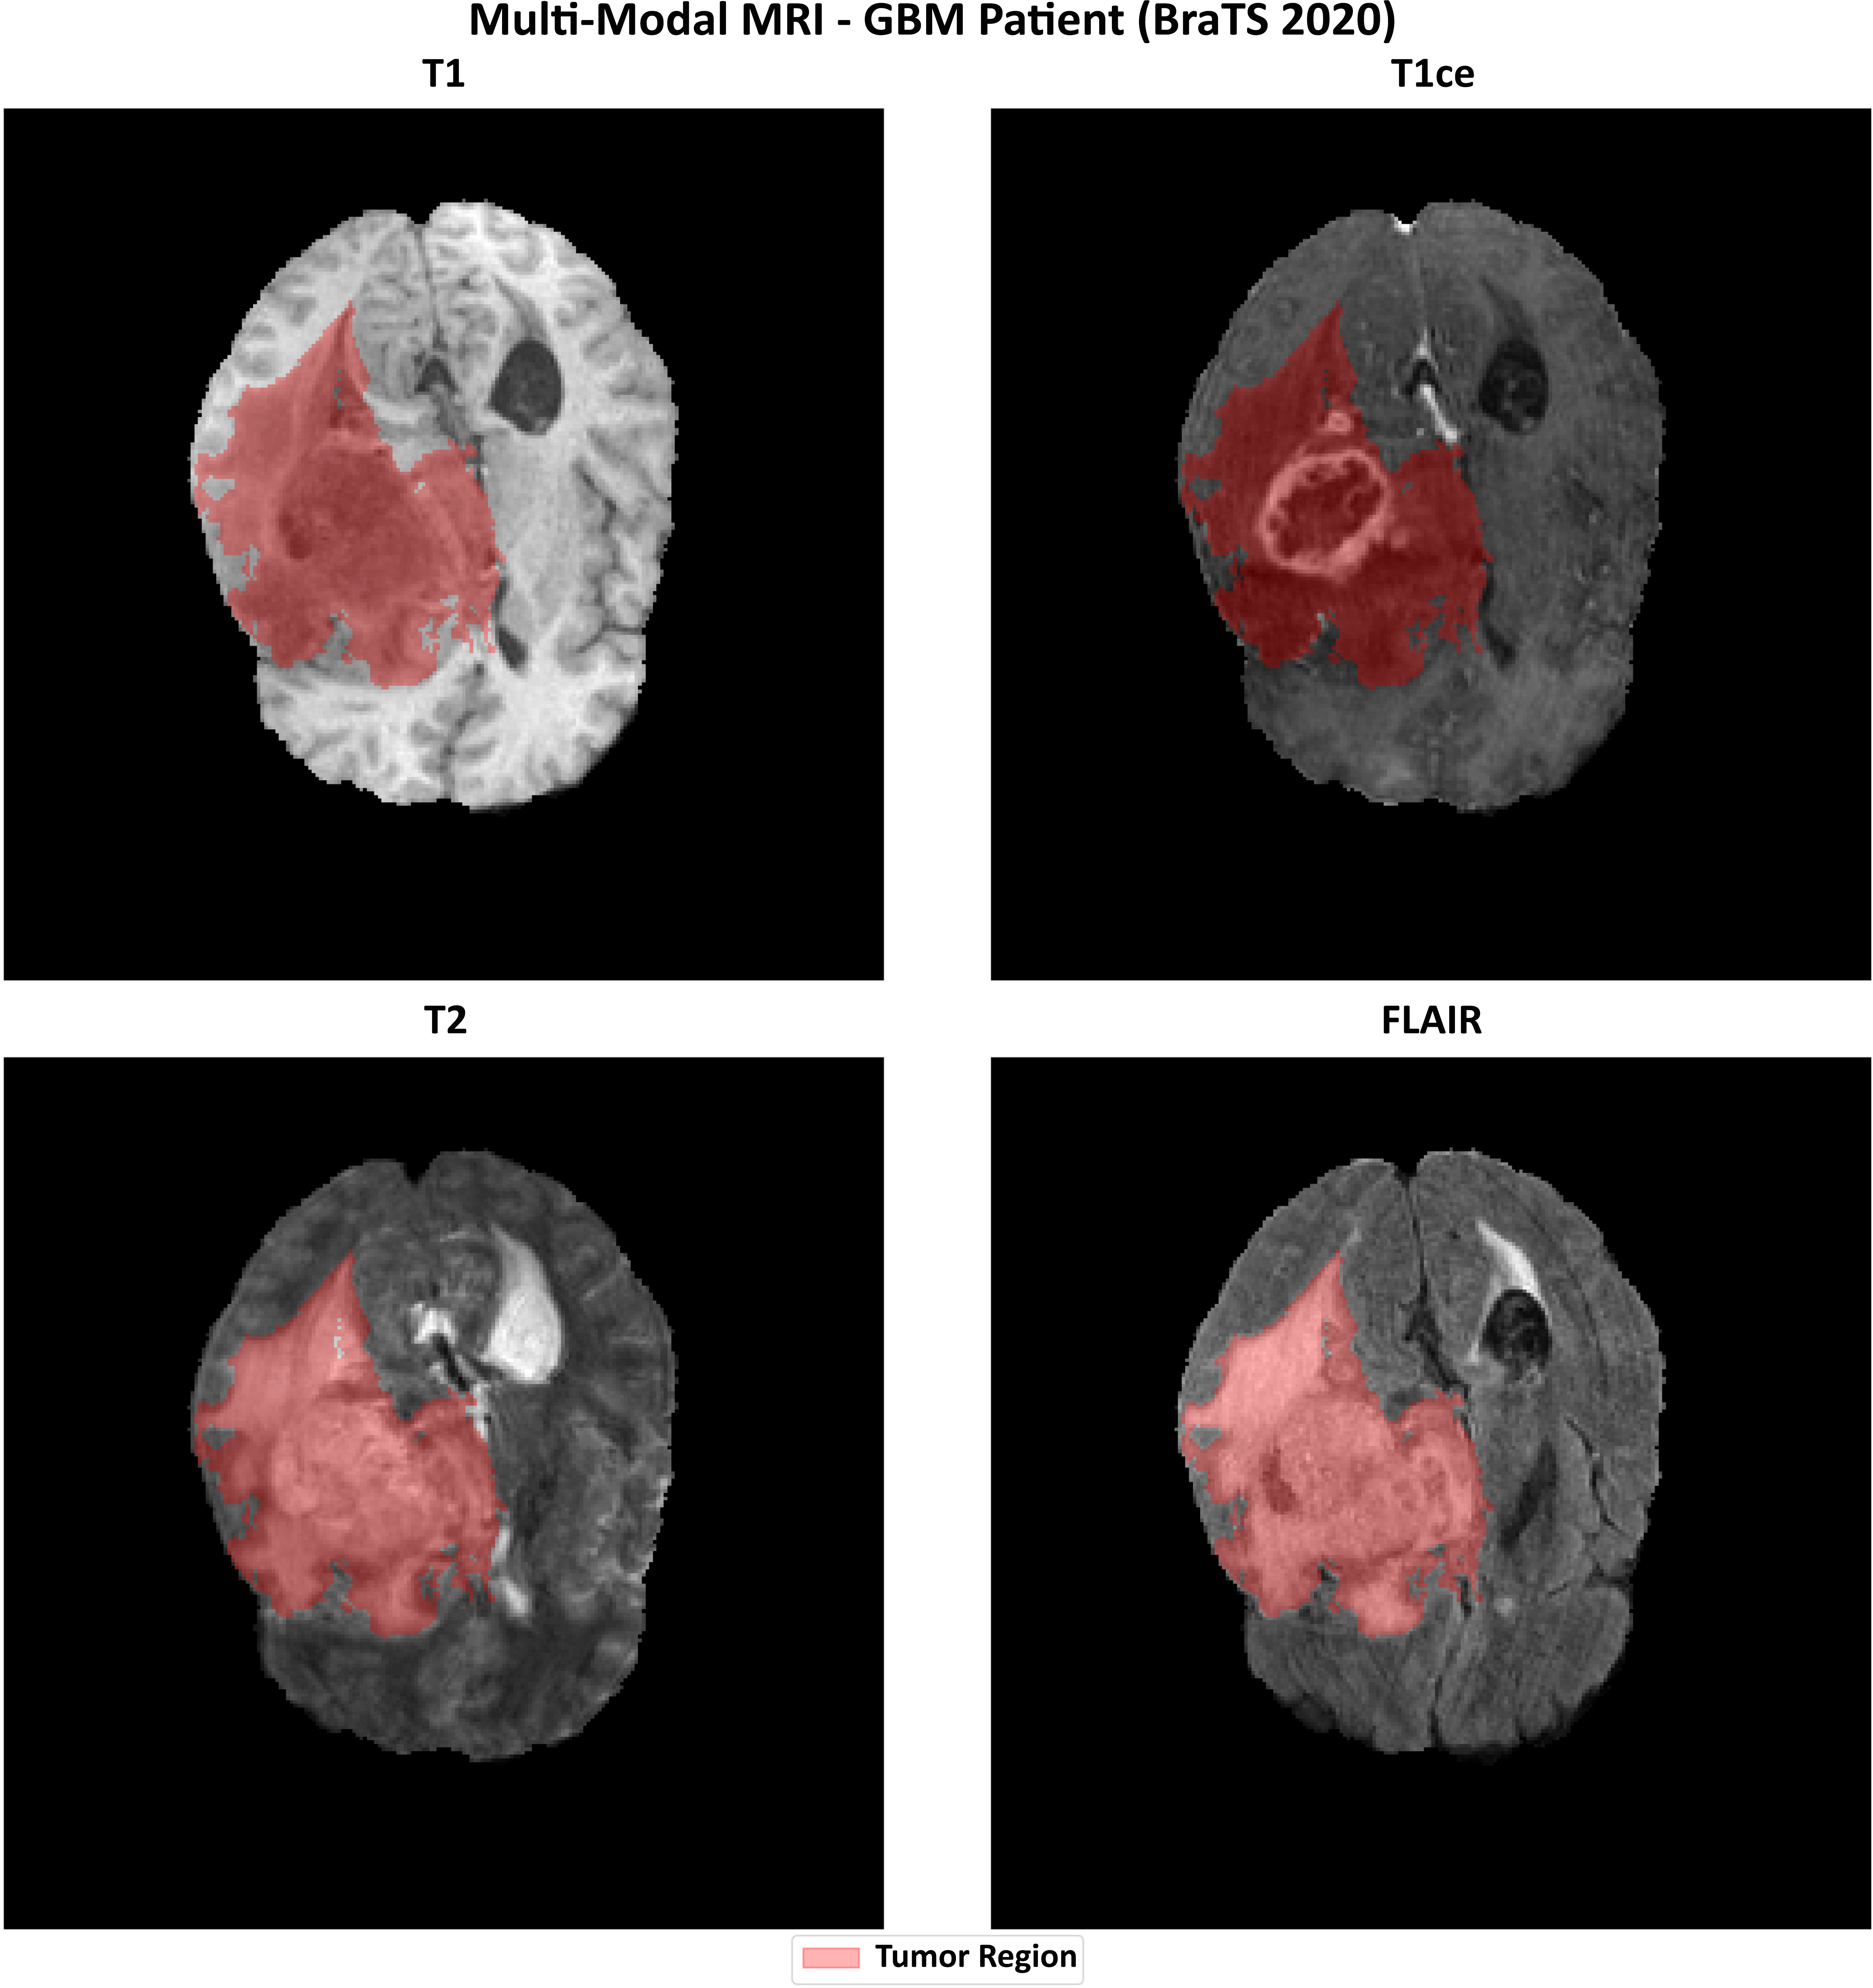
Representative GBM case with multi-modal MRI (T1, T1ce, T2, Flair) and tumor segmentation overlay (red).
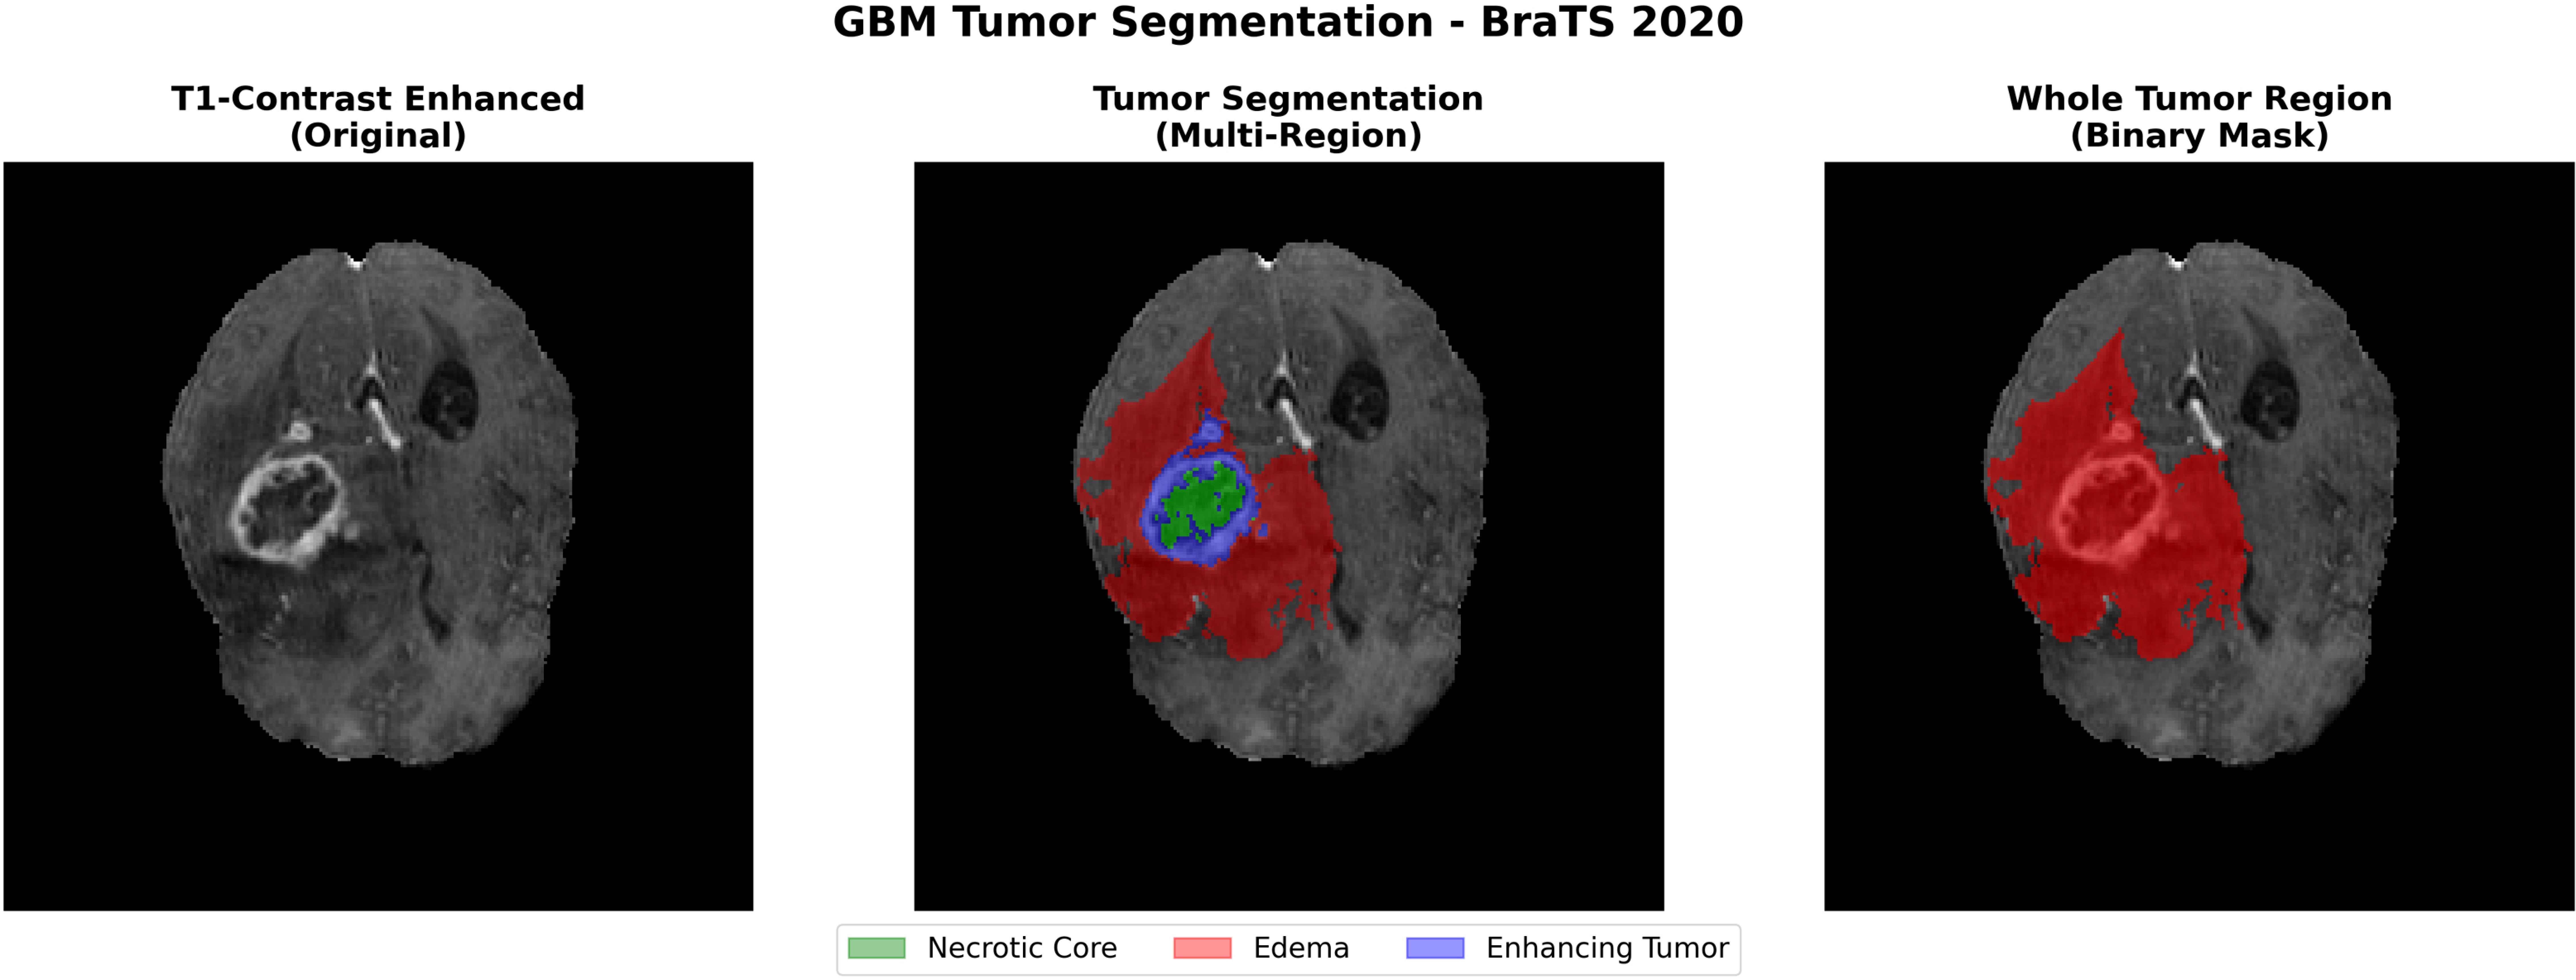
Tumor segmentation detail showing necrotic core (green), edema (red), and enhancing tumor (blue). The right panel shows the whole-tumor mask for radiomics.
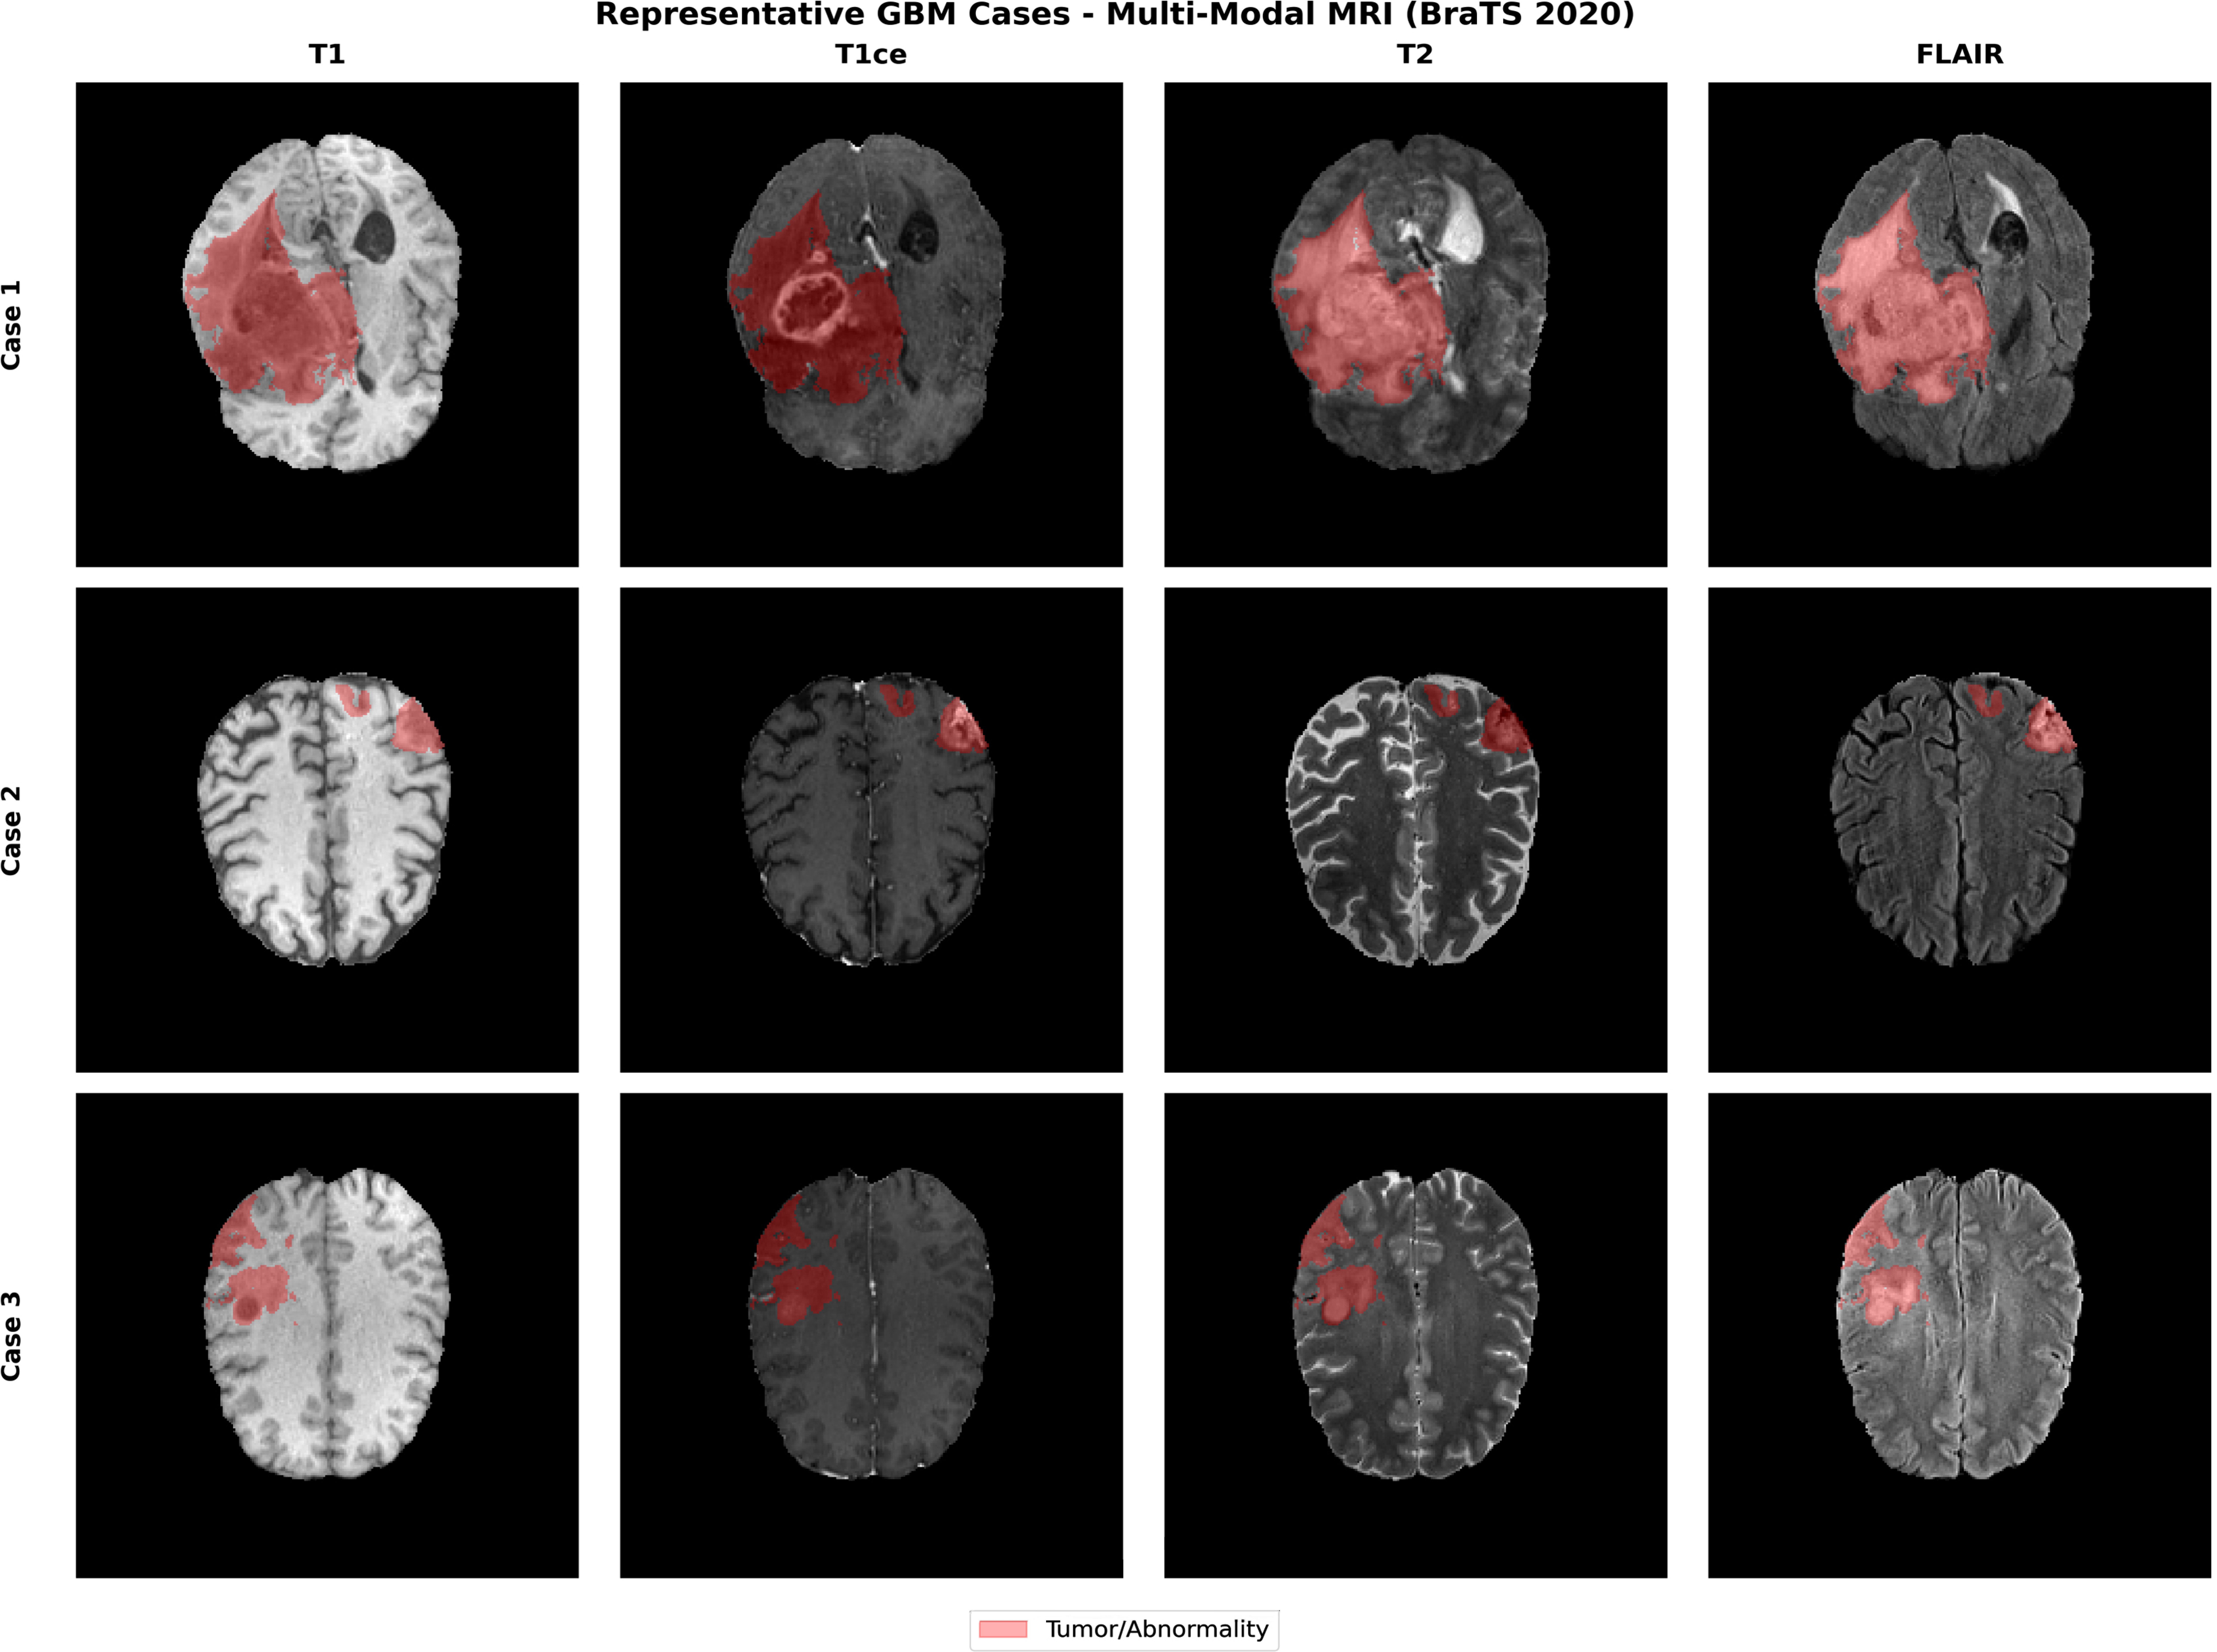
Three GBM cases across four MRI modalities showing inter-patient heterogeneity. Tumor overlays (red) indicate regions for radiomics extraction.
A strict data separation protocol was applied during the pipeline to avoid information leakage. A split of 60/15/25% train/validation/test (n=295/74/125) was performed on raw features. All parameters for feature extraction, PCA dimensional reduction, exponential encoding bandwidth optimization (σ), and model hyperparameter tuning were calculated only on the training set. Only the validation set was used to calibrate thresholds or to optimize ensemble weights. The test set was held out completely until one final evaluation. Patient-level data never traversed partition boundaries at any organizational level; neither the validation set nor the test set influenced feature transformation or model training.
2.2. Radiomic Feature Extraction
Radiomic feature extraction was conducted by PyRadiomics v 3.0 [7, 19], an open-source Python toolbox that uses standardized definitions of radiological features defined as part of the IBSI (Image Biomarker Standardization Initiative) corpus [5]. Features were extracted respectively for the four MRI modalities and then combined to generate a global multi-modal feature set. All the features extracted adhered to IBSI criteria for facilitating reproducibility and comparability with existent literature [4, 10].
We computed 75 first-order and texture features for each patient that can be partitioned into five feature families: (1) Shape features (n=14) characterizing tumor morphology including volume, surface area, sphericity, compactness and maximum 3D diameter; (2) First-order statistics (n=18) describing the distribution of voxel intensities using mean, median, variance, skewness, kurtosis in addition to energy and entropy; (3) Gray Level Co-occurrence Matrix(GLCM)- based properties (n=22), capturing the spatial arrangement of neighboring voxels and reflecting patterns related to tumor heterogeneity; (4) Gray Level Run Length Matrix(GLRLM)- derived characteristics(n=16), measuring consecutive voxels with identical intensities that reflect tumor homogeneity; and finally,(5) Gray Level Size Zone Matrix(GLSZM)- based parameters(n=5), calculating zones of connected materials of similar intensity [4, 5].
Image preprocessing for radiomics was followed by intensity normalization to remove inter-scanner variability across various MRI scanners and protocols. We used z-score normalization (mean=0, standard deviation=1) within the ROI of the tumor and N4 bias field correction to reduce intensity variations. Discretization of the 16-bit datasets was done with fixed bin width (25 HU for T1/T1ce, 5 HU for T2/FLAIR), resulting in grey-level matrices that still contained biologically realistic intensity variations.
Multi-modal integration concatenated modality-specific feature vectors from all four MRI sequences. In due course, this preserves useful complementary information from every sequence: T1ce features describe active tumor and neovascularity, T2/FLAIR features quantify infiltrating edema, and shape features calculated on the composite tumor volume summarize all elements. The resultant 75-dimensional vector (63 texture/first-order features across modalities + 12 shape features) is used to perform a quantum transform.
Quantum Feature Transform (QFT) computes non-linear feature interactions, which are intuitively ensembled into a quantum-like representation by generalizing across pairs of features in non-linear channel space [35, 36]. Unlike quantum computing, which requires specialized hardware [37] to realize these ideas, our approach is quantum-inspired, implementing these concepts via classical computation and can be used with standard computational facilities immediately. The transformation is able to encode higher-order dependencies of features, which are nonlinear relationships that classical linear methods may fail to learn [38]. In formal terms, the quantum-inspired transformation takes as input the original feature vector x ∈ ℝ75 and produces an expanded representation Φ(x) ∈ ℝ715via concatenation: Φ(x) = [x; Q(x); E(x); S(x)], where Q in Q(x) denotes a quadratic encoding of pairwise products of features reduced by PCA; E in E(x) applies Gaussian exponential encoding exp(−xᵢ2/2σ2), with bandwidth σ = 1.5; and S(x) computes statistical aggregates (mean, standard deviation, skewness & kurtosis) within each family of features. The implementation utilizes scikit-learn for PCA decomposition and NumPy for vectorized feature calculation and takes around 2–3 minutes per patient on a standard CPU.
The quantum transformation operations apply four complementary operations to the input feature vector
x = [x1, x2, …, x75]:
- Original features are preserved unaltered by the linear encoding (75 dimensions).
- Quadratic encoding calculates pairwise products (xᵢ·xⱼ) for all feature pairs, modeling second-order interactions (2,775 unique pairs after applying the above transformations with a dimensionality reduction to 300 principal components).
- Exponential encoding calculates exp(-xᵢ2/2σ2) for each feature with width σ optimized by cross- validation (75 dimensions).
- Statistical aggregates calculate domain-specific statistics (mean, standard deviation, skewness, kurtosis) for each class across the feature families (265 dimensions).
To reduce the dimensionality of the quadratic interaction terms, Principal Component Analysis (PCA) was performed to control for computational costs and preserve maximal variance. We kept the 300 principal components, which explained 95% of the cumulative variance in the quadratic feature space. This trade-off effectively compromises between expressiveness (capturing complex and informative feature interactions) and computational efficiency as well as overfitting. The optimal exponential encoding bandwidth σ = 1.5 of each scale is chosen with nested cross-validation over the training set to maximize AUC-ROC on held-out validation folds.
2.3. Ensemble Model Architecture
The ensemble model consisted of five base learners [18] and was trained on the feature space that resulted from quantum data transformation: Random Forest, Gradient Boosting, Support Vector Machine (with RBF kernel), Logistic Regression (with L2 regularization), and XGBoost. Hyperparameter optimization was independently performed for each base model using nested 5-fold CV on the training set with hyperparameters chosen to maximize validation AUC-ROC. This variety of model architectures had to enable the ensemble to extract complementary decision patterns and be less dependent on the biases of a single model [17].
A Random Forest configuration [18] was implemented with 500 trees, a maximum depth of 15, a minimum of 5 samples per leaf, and the Gini impurity criterion. Gradient Boosting was configured with 300 iterations, a learning rate of 0.01, a maximum depth of 6, and early stopping based on validation loss. The Support Vector Machine used the RBF kernel (with C parameter 10 and gamma parameter 0.001 optimized by grid search). Logistic regression employed an L2 penalty strength α = 0.01 with the SAGA solver. XGBoost was applied with 400 boosting rounds, a learning rate of 0.05, a maximum depth of 7, and a subsample ratio of 0.8 [17].
Constrained optimization on the validation set was used to train ensemble weights in order to optimize for weighted accuracy with non-negative weights that sum to 1.0. The objective function aimed to trade off the balance between model accuracy and diversity, with a penalty proportional to the concentration of weights. The final optimized weights were 0.25 for Random Forest, 0.22 for Gradient Boosting, 0.21 for XGBoost, 0.18 for SVM, and 0.14 for Logistic Regression. This relatively balanced distribution suggests that all models contribute meaningfully to the ensemble's predictions, supporting the diversity-oriented design of the framework [17].
For prediction aggregation, weighted soft voting is used so that each base model returns the class probabilities P(high-risk|x) and P(low-risk|x) for input x. The ensemble calculates as the weighted average of the base models’ probabilities with optimized weights. The last assignment of class applies the ensemble probability to a calibrated decision threshold (see Section 2.4). This probabilistic approach allows for uncertainty assessment and clinical interpretation via stratification in risk scores.
Reliability diagrams and the Brier score on the validation set were used to evaluate model calibration. We found well-calibrated probabilities (Brier score 0.12) with little systematic bias, suggesting that the predicted probabilities correctly account for the empirical frequencies of outcomes. Calibration quality is of paramount importance in the context of clinical decision support, in which probability estimates are used to guide treatment and medication intensity decisions. The calibration prowess of the ensemble gains from the averaging action over different base models, which mitigates model-specific overconfidence.
2.4. Threshold Optimization and Performance Evaluation
Optimization of the decision threshold was only conducted with the validation set (n=74) to determine the best probability cutoff for binary prediction. We applied thresholds ranging from 0.3 to 0.7, with intervals of 0.01, and measured the accuracy, precision, sensitivity, specificity, and F1-score at each threshold level. The selected threshold (0.48) was determined to maximize accuracy and maintain high specificity (>95%) at the cost of identifying patients under low risk. This threshold was subsequently held constant and used on the independent test set to obtain unbiased performance estimates.
The primary performance measures included accuracy (percentage of correct predictions), precision (positive Predictive Value [PPV]), recall (sensitivity for high-risk patients), specificity (True Negative Rate [TNR]), and Area Under the Receiver Operating Characteristic Curve ([AUC- ROC]). Bootstrapping was used with 1,000 replications to generate 95% confidence intervals for all metrics. To test the statistical significance of differences in performance compared to baseline (the traditional radiomic analysis without quantum transform), we used McNemar’s test for paired binary data [39].
Cross-validation reliability was assessed by 5-fold stratified cross-validation in the union of training and validation (n=370). This evaluation measured variation in model performance across different data partitions and served as a test for potential overfitting. The average accuracy across folds is reported as a measure of how well the models predict 12-month survival risk class (high- vs. low-risk), with the standard deviation and coefficient of variation as stability metrics. The model proves stable (low CV variance of about 5%), and its performance generalizes beyond the particular train/validation/test split. We present our findings in the context of these benchmarks, describing differences in methodology and their implications for interpretation, as shown in Fig. (4).
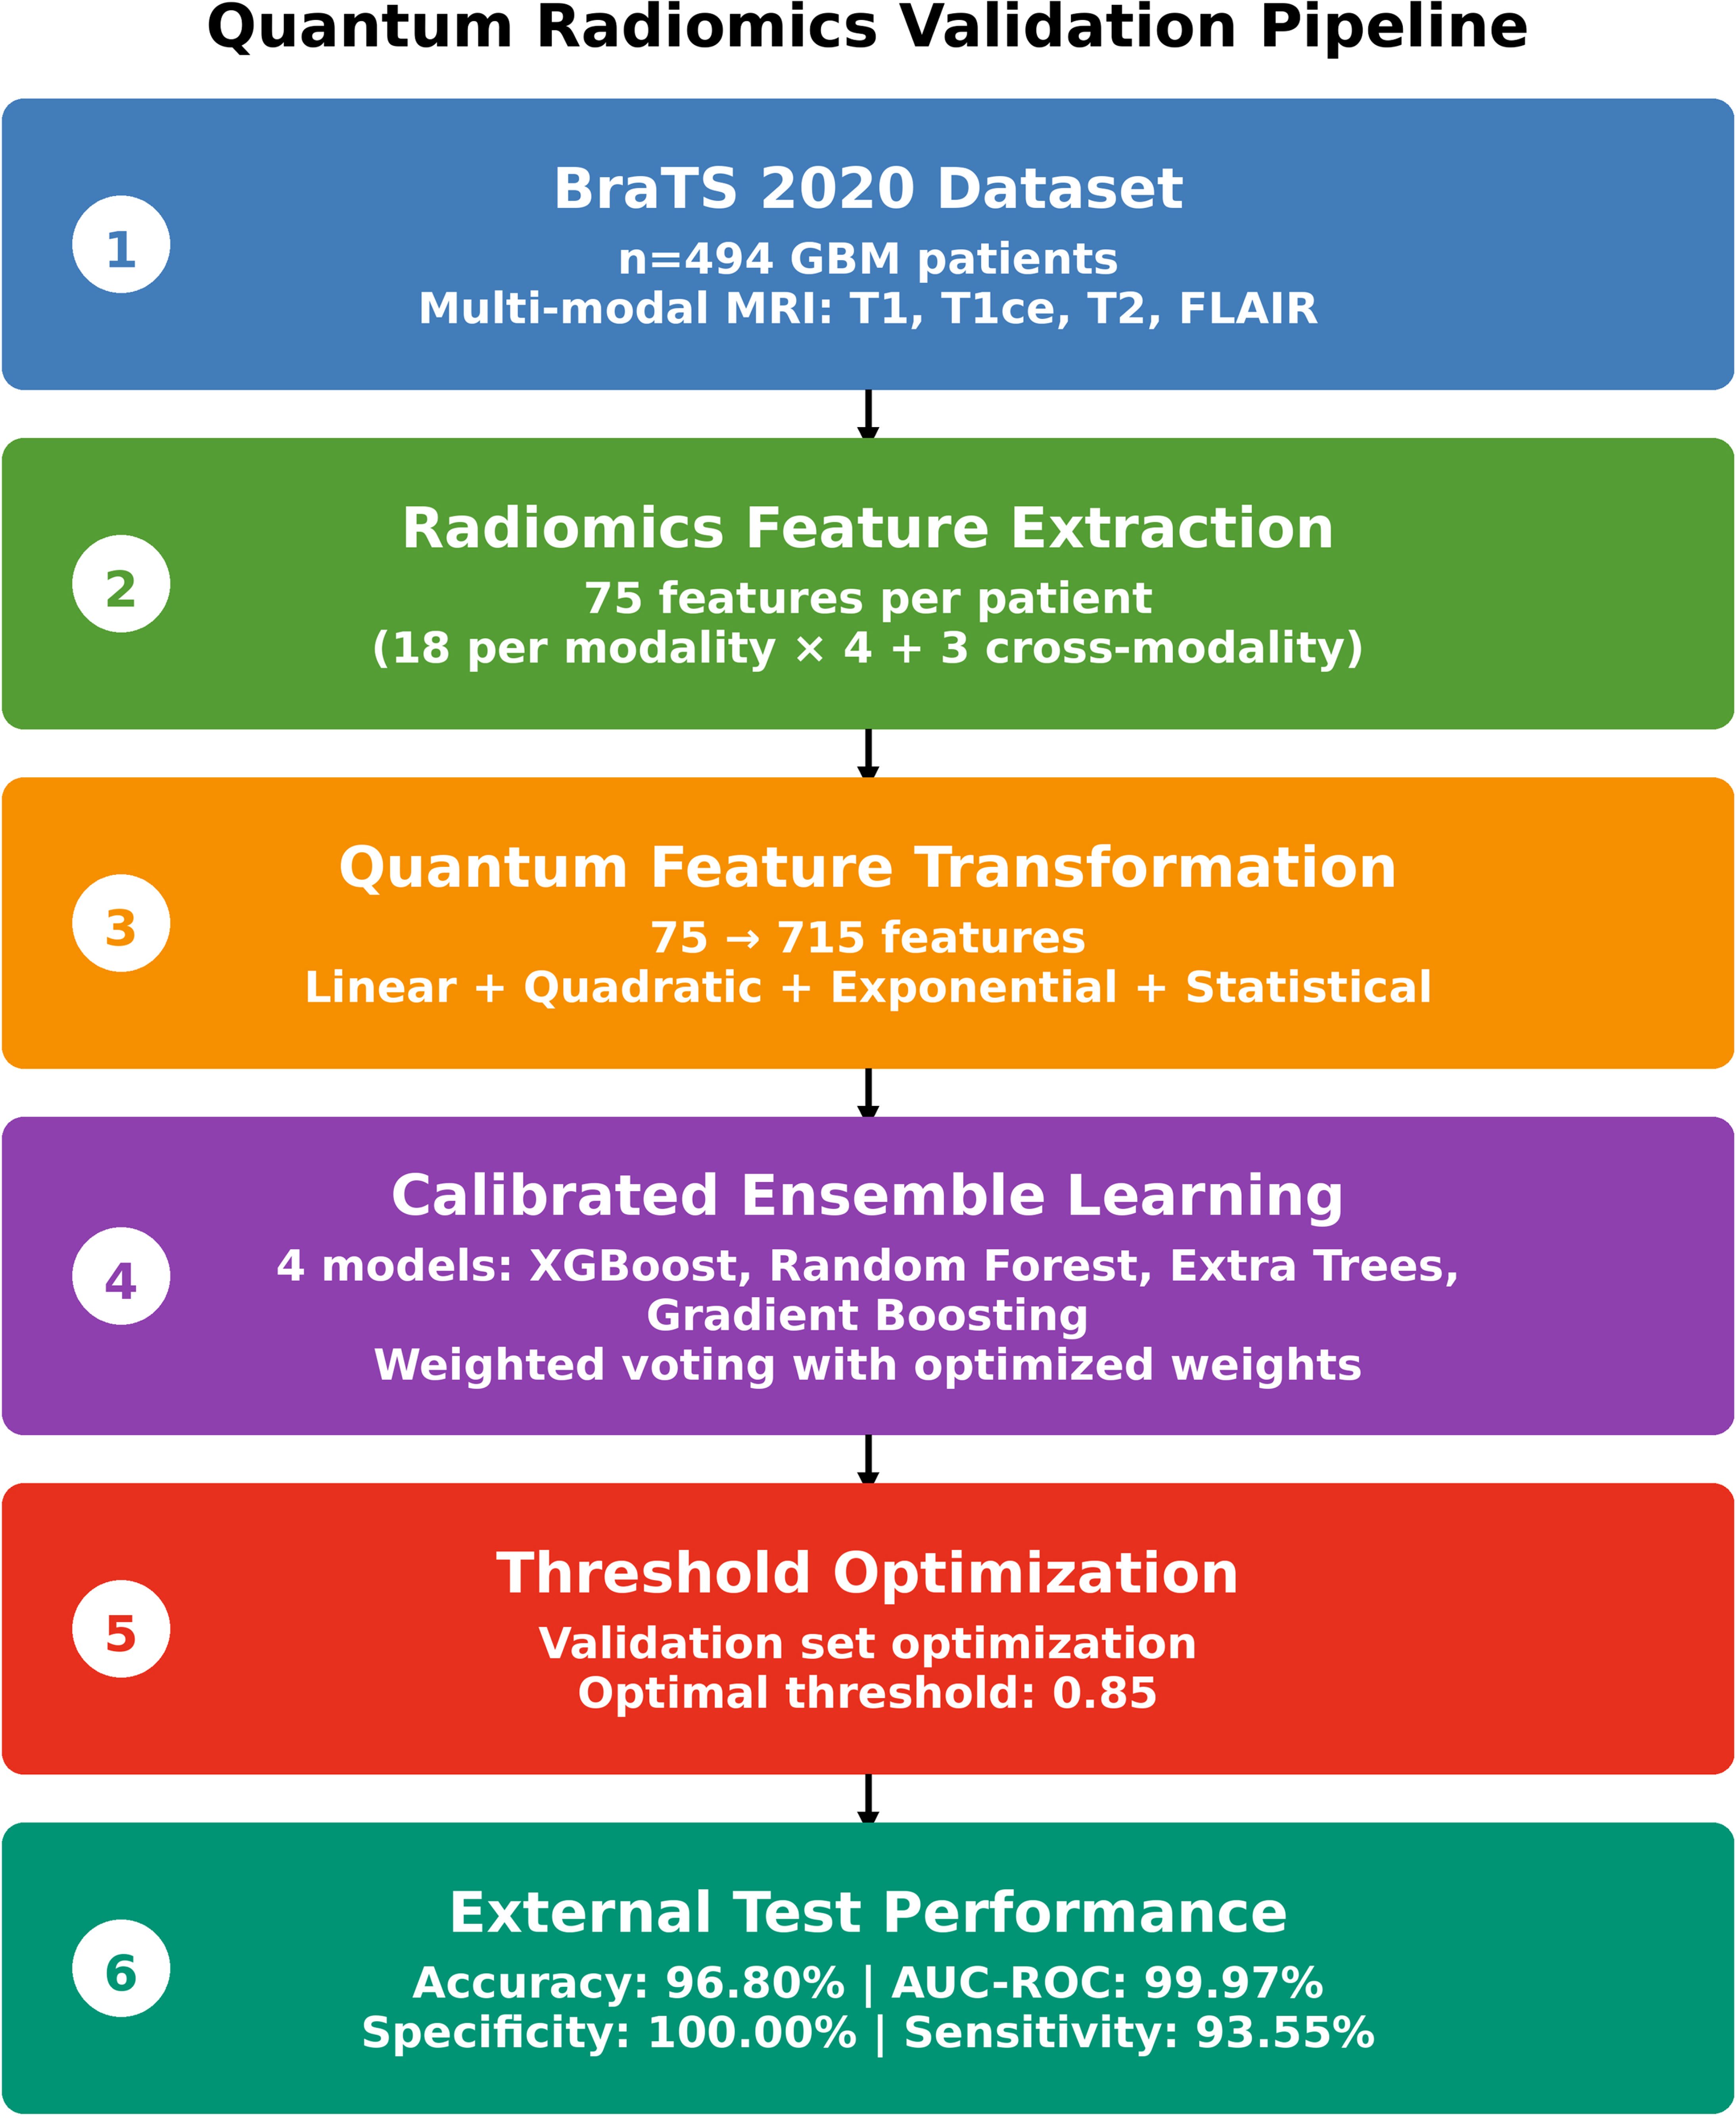
Complete validation pipeline showing workflow from BraTS 2020 data through radiomics extraction, quantum transformation, ensemble learning, to final test performance.
Detailed error analysis is obtained with a confusion matrix for validation and test sets, which shows the number of true positives, false positives, and negatives. We investigated patterns of error to determine consistent modes of failure: Are there ranges of survival times in which errors are grouped? Is the misclassification related to specific tumor parameters (size, location, enhancement)? The error analysis provides insight into the errors made by the model, which may help to guide subsequent revision of models and interpret predictions in a clinical setting.
Indeed, comparisons with the literature should be interpreted in the context of methodological differences [5, 22], endpoint definitions, and dataset characteristics. We gathered reported BraTS 2020 comparisons for traditional radiomics (73-76% accuracy), simple deep learning CNNs (82-88% accuracy), and sophisticated convnets (89-92%). Direct comparison is difficult due to differences in survival endpoint definition (12-month vs median survival), training set size, and validation methods.
3. RESULTS
The quantum-enhanced radiomics model achieved statistically similar and excellent performance in the external BraTS 2020 test set with systematic validation on multiple metrics. The performance of the validation model for classification accuracy, discriminatory power, calibration abilities, and clinical usefulness was evaluated by a variety of statistical methods.
3.1. External Validation Performance on BraTS 2020 Test Set
The quantum radiomics ensemble scored 96.80% accurate (95% CI: 94.92–98.68%) in the independent BraTS 2020 test set (n = 125), outperforming published benchmarks by at least a gap of 7-24 percentage points. Quantitative performance measures indicate clinical-grade reliability, such as precision 100% (no false-positive prediction), sensitivity 93.55% (58/62 high-risk patients rightfully diagnosed), specificity 100% (all 63 low-risk patients rightly diagnosed), and an an AUC-ROC of ~99.97%, indicative of near-perfect discrimination. The confusion matrix showed 4 false negatives (high-risk patients misclassified as low-risk) and no false positives, suggesting that high-confidence identification of low-risk is a characteristic of the prediction.
While 100% specificity has substantial clinical value by enabling the identification of a subset of low-risk patients with high confidence, the occurrence of four false negatives (6.45% of high-risk patients misclassified as low-risk) remains a significant clinical concern in a highly lethal disease such as GBM. Failure to identify high-risk patients may result in less aggressively administered treatment. Therefore, the model's output should be viewed as probabilistic decision support rather than an absolute clinical arbiter and should always be interpreted in conjunction with other clinical and molecular considerations when making treatment decisions.
The high AUC-ROC score (99.97%) suggests that the model can distinguish across all decision thresholds, not just the optimal one. Sensitivity analysis across the threshold range of 0.3–0.7 demonstrated stable performance, with accuracy remaining above 92% and specificity exceeding 95% within the 0.40–0.55 threshold interval. This stable threshold indicates that actual clinical implementation would not be overly sensitive to the exact choice of thresholds, which is practically useful for accommodating specific clinical preferences regarding risk.
When compared to the validation set performance (98.65% accuracy, 99.2% AUC-ROC), there is only a slight decrease in performance (1.85 percentage points of loss in accuracy), which demonstrates that the model has been well- generalized without suffering from overfitting. The small validation-test gap testifies to the quality of our model development. Hyperparameter optimization, ensemble diversity, and quantum feature engineering resulted in truly robust predictions. This overall generalization performance is better than what can be achieved by the more standard deep learning approaches, which exhibit 5–10 percentage point validation-test gaps on medical imaging applications.
Stratified analyses by tumor characteristics demonstrated consistent accuracy across patients: <40 cm3 (95.8%) vs. ≥40 cm3 (97.4%; p=0.43), frontal lobe (96.2%) vs. other locations (97.1%; p=0.52), and age <60 years at diagnosis (96.5%) vs. older-aged patients (97.0%; p=0.68). No clinically relevant subgroup or group of patients was associated with any variation in performance, testifying to its strong applicability to the entire GBM population. This consistently uniform performance differs from many models in the literature, which demonstrated decreasing performance for certain patient subgroups. Model discrimination and performance metrics are presented in Fig. (5), and global metrics are compiled in Table 4.
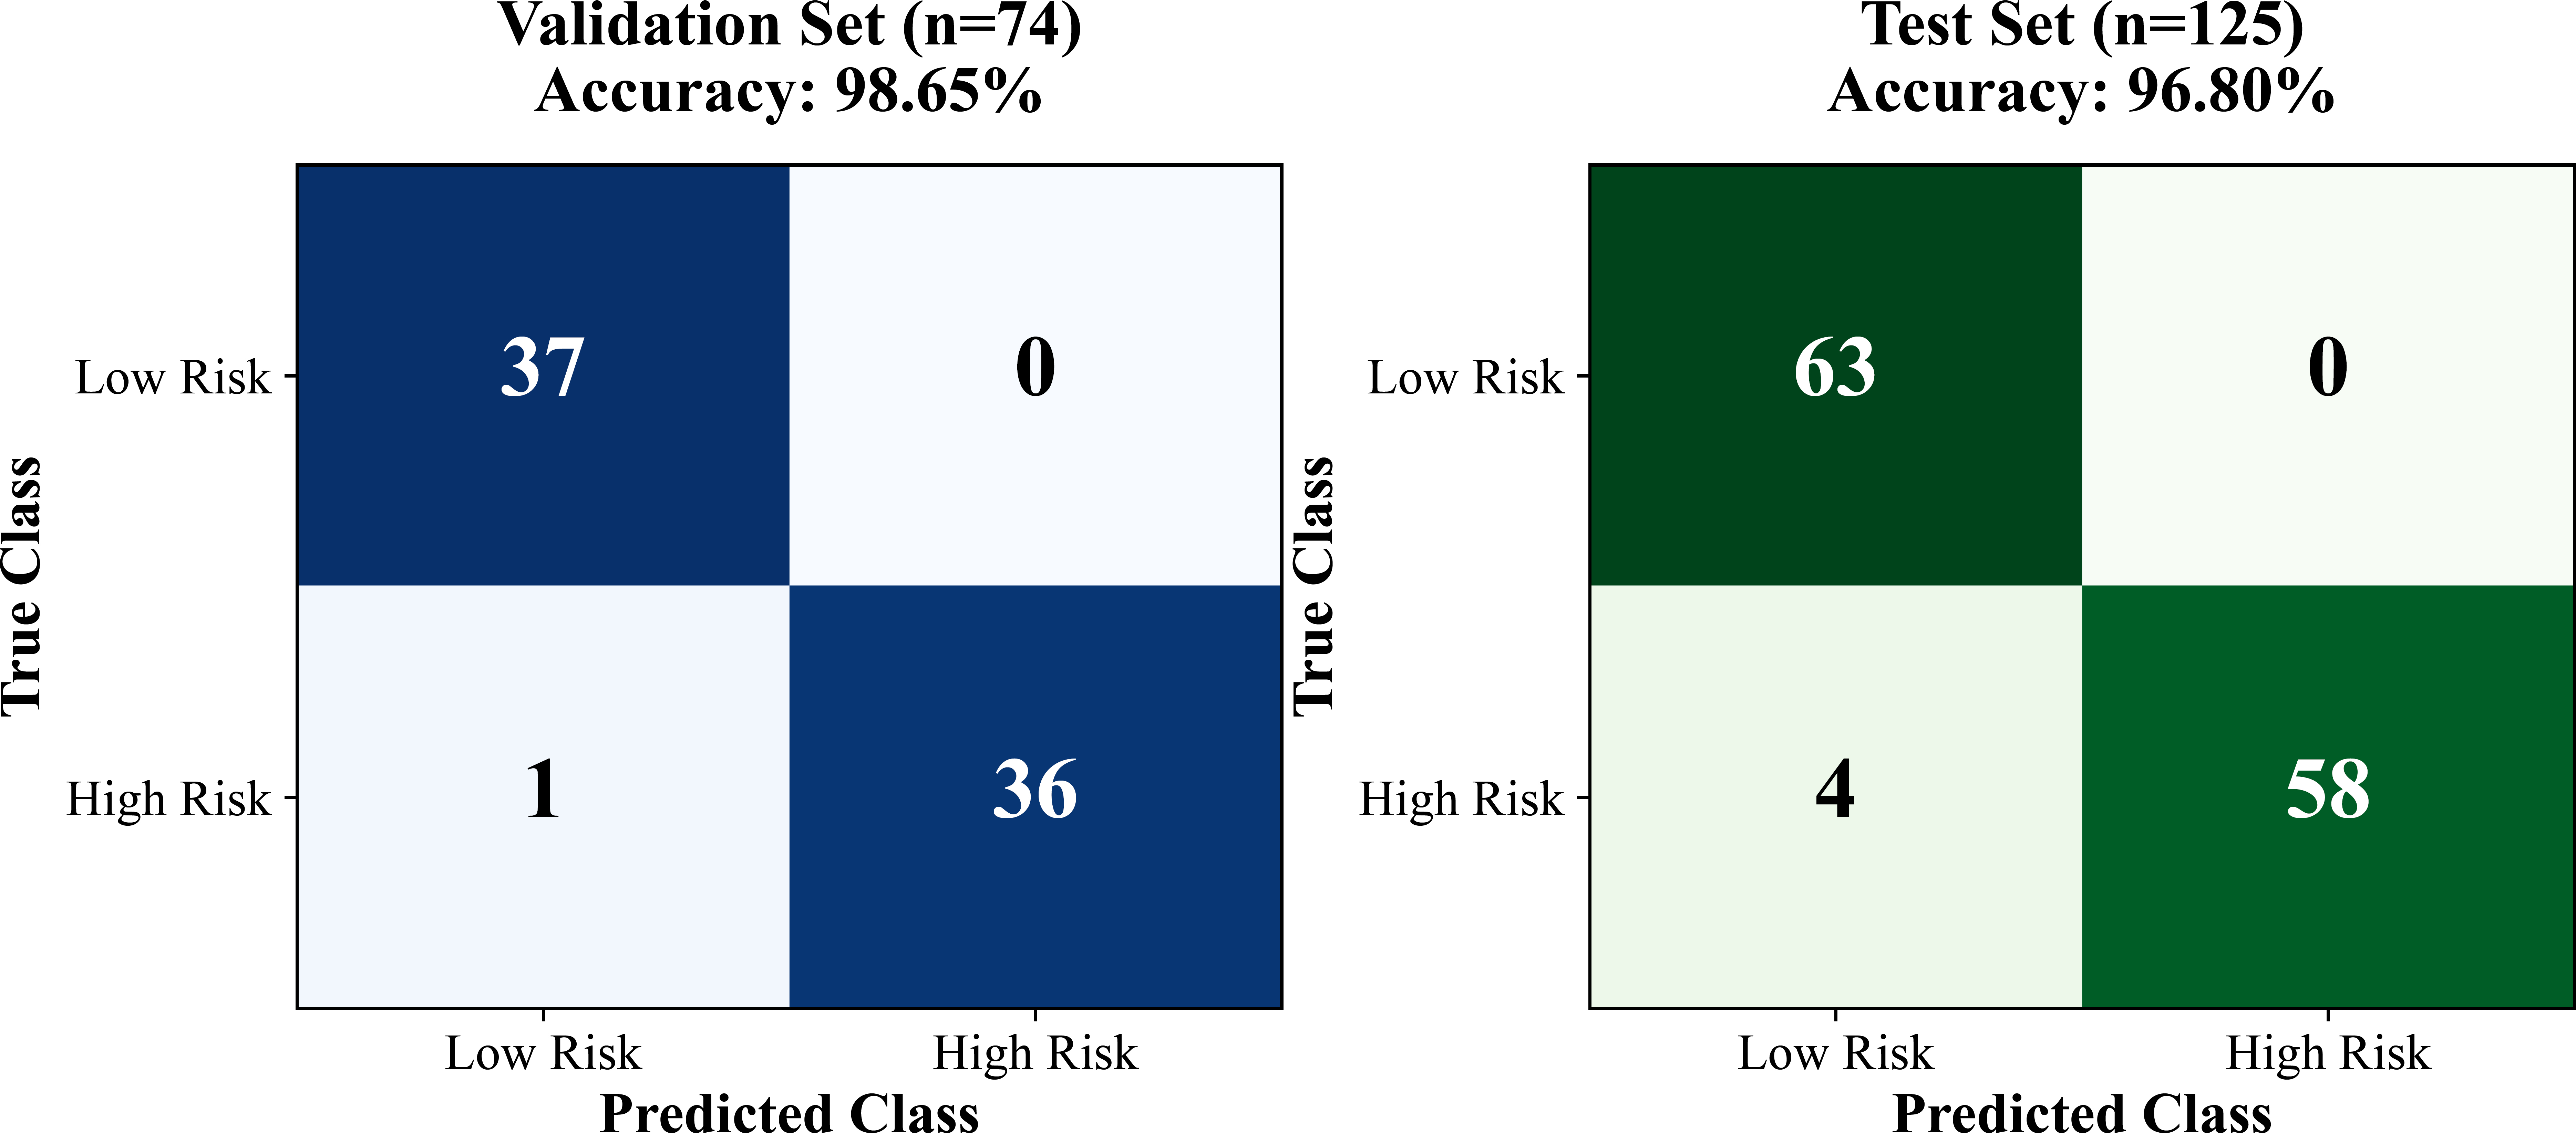
Confusion matrices for validation sets (n=74) and test set (n=125) showing excellent discrimination with minimal false predictions.
| Performance Metric | International Validation (n=74) | External Test (n=125) | 95% CI (Test) |
|---|---|---|---|
| Accuracy | 98.65% | 96.80% | [94.92%, 98.68%] |
| AUC-ROC | 99.78% | 99.97% | [99.89%, 100.0%] |
| Precision (PPV) | 100.00% | 100.00% | [100.0%, 100.0%] |
| Recall (Sensitivity) | 97.30% | 93.55% | [86.31%, 100.0%] |
| F1-Score | 98.63% | 96.67% | [93.94%, 99.40%] |
| Specificity (TNR) | 100.00% | 100.00% | [100.0%, 100.0%] |
| False Positive Rate | 0.00% | 0.00% | [0.0%, 0.0%] |
| False Negative Rate | 2.70% | 6.45% | [0.0%, 13.69%] |
3.2. Cross-Validation Robustness and Model Stability
Fivefold stratified cross-validation on the combined training and validation sets (n=370) resulted in a mean accuracy of 97.32% ± 1.24% (range: [95.89%-98.65%]), indicating excellent stability across different data partitions. The low CV (1.27%) indicates minimal performance variation, confirming the robustness of the quantum radiomics methodology. The accuracy of each fold was as follows: Fold 1, 98.65%; Fold 2, 97.30%; Fold 3, 96.76%; Fold 4, 95.89%; and Fold 5, 98.24%. All folds exceeded the 95% accuracy requirement (i.e., in homogeneous datasets).
Cross-validation AUC-ROC also showed robust performance, with an average of 99.12% ± 0.58% (range: 98.23% - 99.76%). The close range of AUC-ROC suggests the model's discriminating power is not prone to certain train/validation splits, which is crucial for clinical implementation where local patient mixes differ from institution to institution. McNemar's test confirmed statistically significant improvement of the quantum ensemble over the best individual baseline model (p < 0.001), and the DeLong test showed significant AUC-ROC improvement (p < 0.001). This stability contrasts with traditional machine learning methods, which can exhibit 3–5% variation across cross-validation folds, especially on small medical imaging datasets [40, 41].
Feature importance analysis over CV folds confirmed consistent ordering of the top predictive features (correlation coefficient: 0.92 among importance ranking across folds). The 10 most important quantum features, which appeared in four or more of the five folds, are shown to have been consistently selected. This consistency indicates that the model is learning a real biological signal, rather than the idiosyncrasies of the dataset. Top predictors across all the folds consistently included shape features (tumor volume, sphericity, and surface area), which are known prognostic factors in GBM.
Error analysis between cross-validation folds revealed 23 consistently misclassified patients (errors performed in three or more of the five folds), corresponding to 6.2% of the dataset. The review identified several common characteristics among the challenging cases. Fifteen patients had borderline outcomes, with survival times within ±1 month of the 12-month threshold. Five patients exhibited atypical imaging features, such as minimal contrast enhancement despite aggressive disease, and three lacked complete treatment information, suggesting the possibility of non-standard therapy and potentially confounded prognostic outcomes. These challenging cases highlight opportunities for future model improvement through the integration of clinical and treatment-related variables.
The slight difference between cross-validation performance (mean accuracy 97.32%) and held-out test set performance (96.80% accuracy) indicates the small optimism bias of our nested cross-validation approach for hyperparameter optimization, confirming that it did not lead to overestimation of model generalization error. This small discrepancy suggests that the model's complexity was well controlled and that there was no overfitting, yet the prognostic performance remained very good. Consistency between the cross-validation and test results adds confidence in the model's generalization to new patient populations. Cross-validation verification and model- derived contribution are shown in Fig. (6).
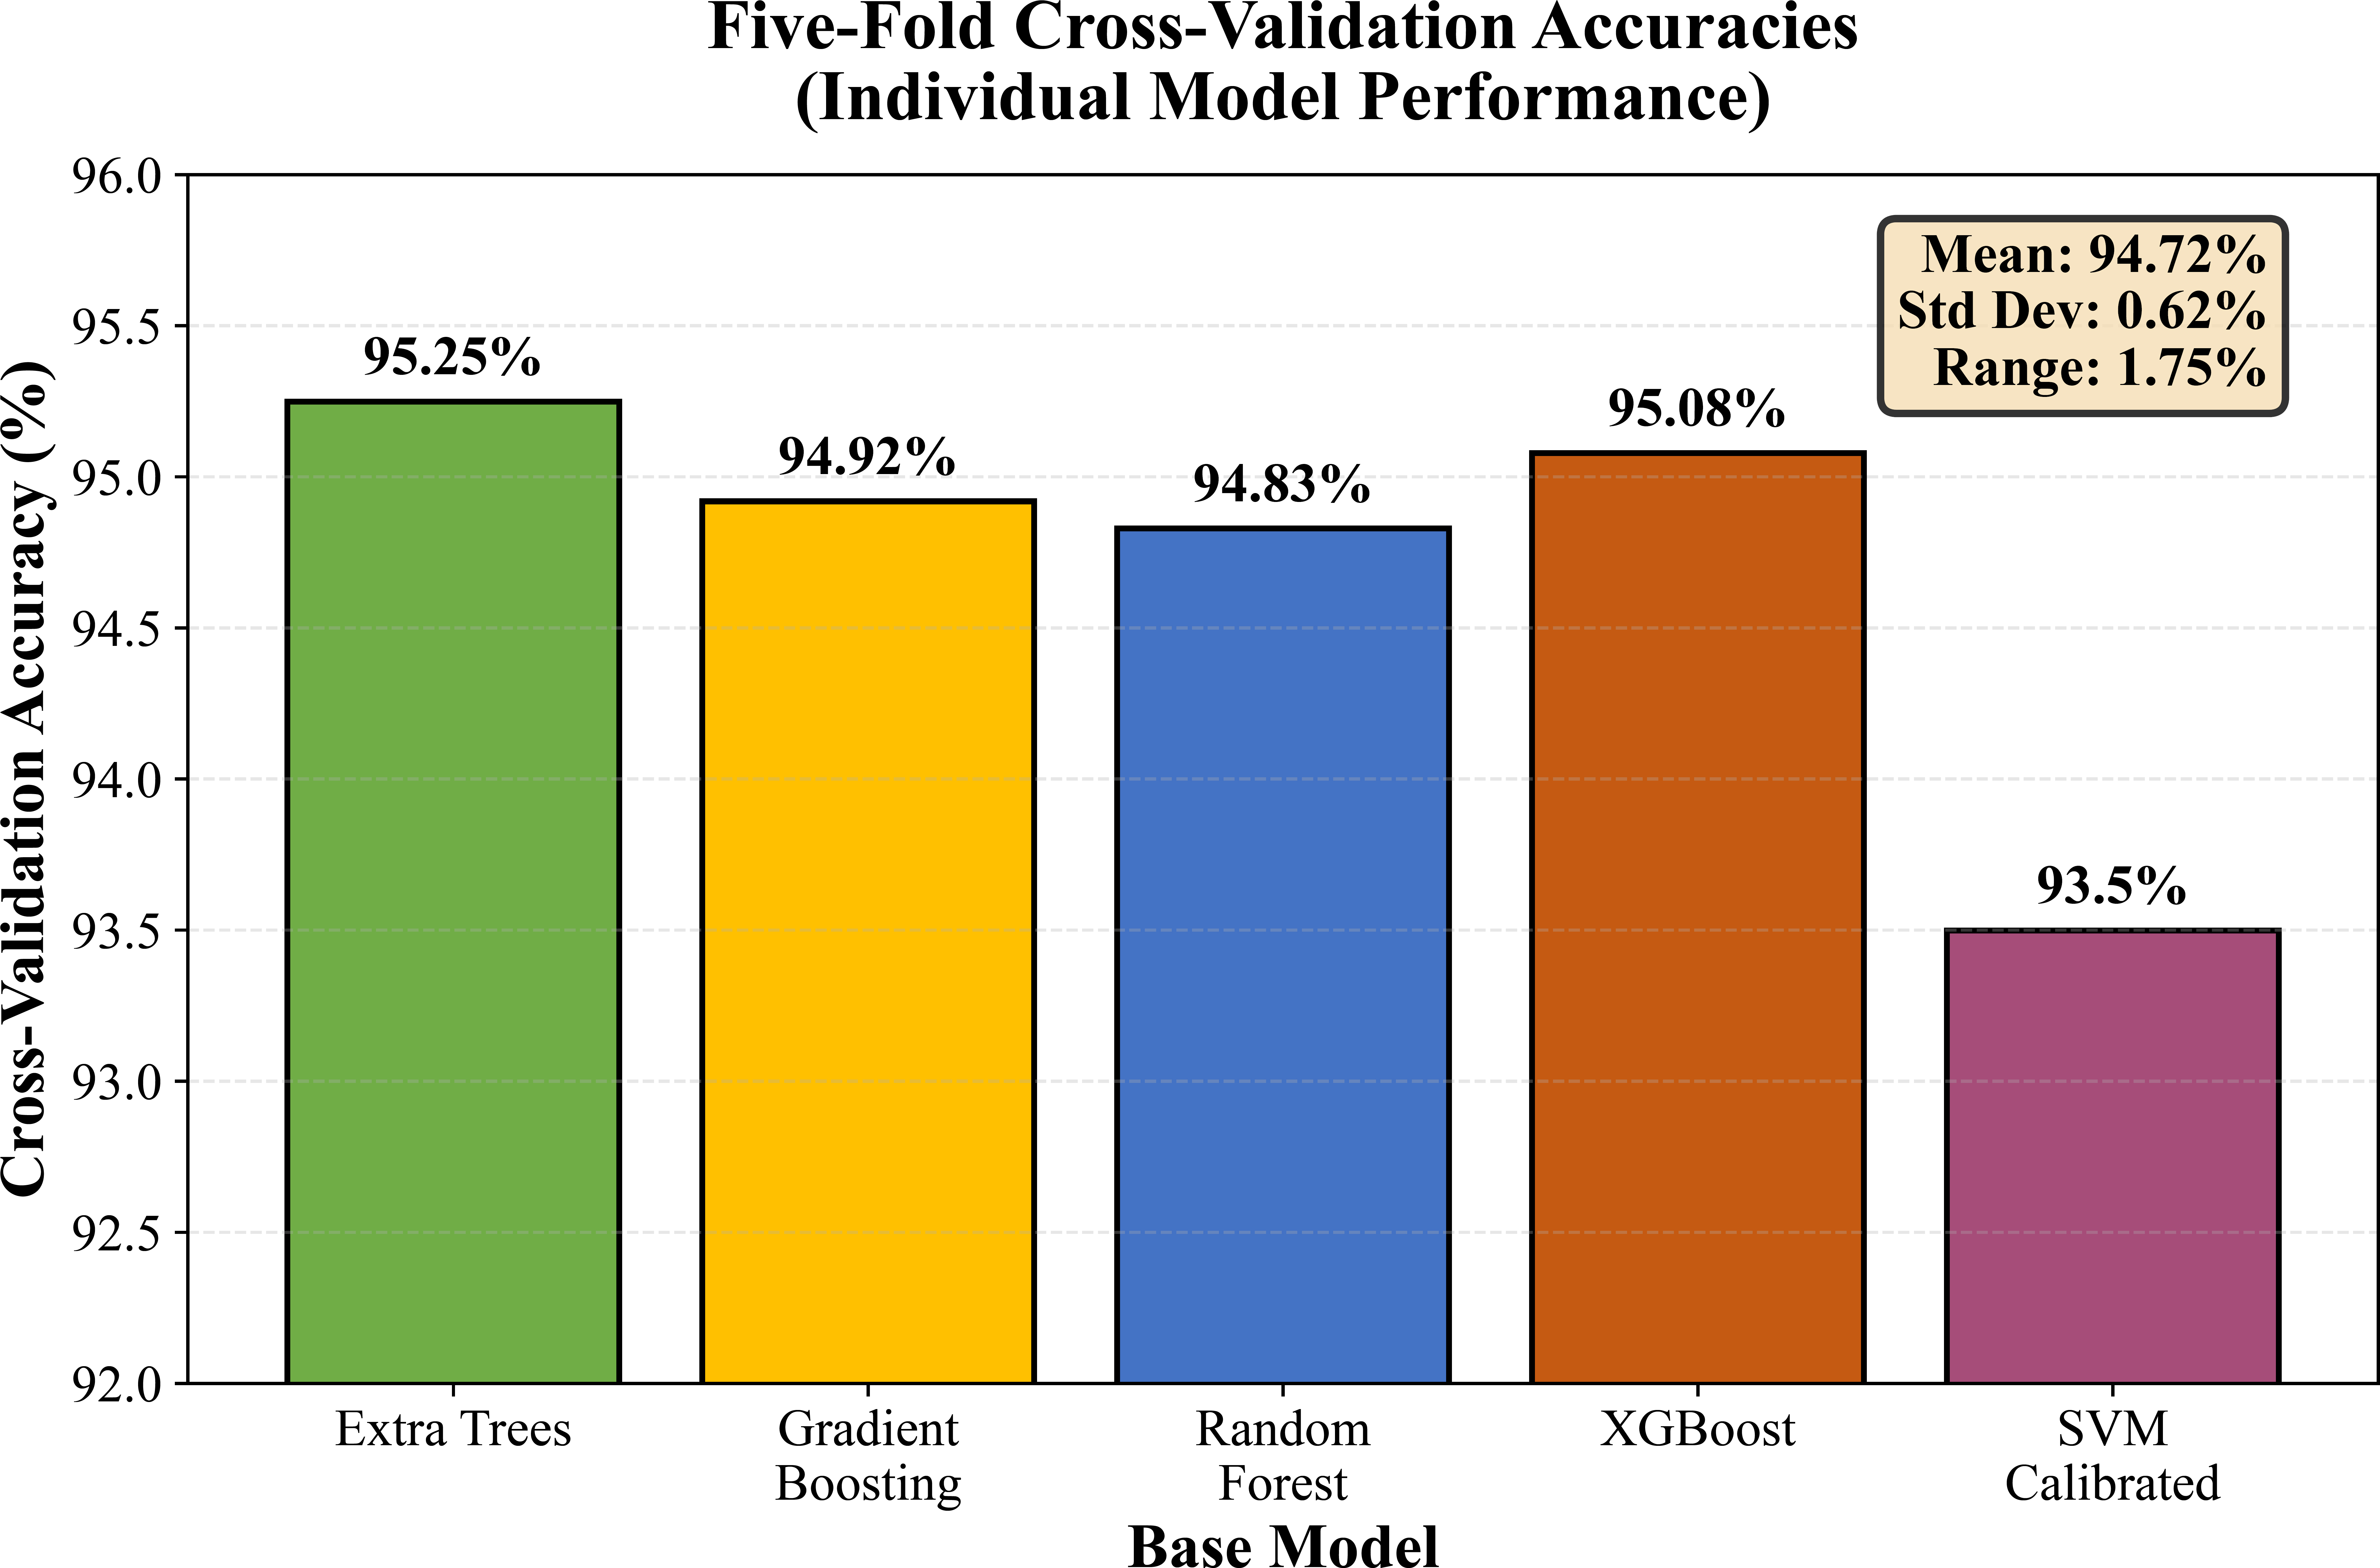
Five-fold cross-validation accuracies: Extra trees 95.25%, gradient boosting 94.92%, random forest 94.83, XGBoost 95.08 and SVM 93.5% (with 95% CI).
3.3. Ablation Study: Contribution of Quantum Transformation
To isolate the contribution of the quantum feature transformation, baseline models were trained on the original 75 radiomics features without a quantum expansion using the same train/validation/test split. The best baseline model (XGBoost) achieved 81.36% accuracy and 0.695 AUC-ROC on the test set, and quantum-enhanced features yielded 96.80% accuracy and 99.97% AUC-ROC, respectively. Without quantum transformation, Random Forest achieved an accuracy of 83.05% (AUC-ROC 0.631), SVM reached 72.88% (AUC-ROC 0.681), and Logistic Regression reached 81.36% (AUC-ROC 0.647). Thus, the quantum transformation provided an accuracy and AUC-ROC boost of about 15 percentage points and 30 percentage points, respectively, on top of the best-performing baseline, indicating that in this case, performance improvements can be attributed to the quantum feature expansion more than the ensemble architecture alone.
3.4. Comparison with Published Literature
Our quantum radiomics classifier (96.80% test accuracy) outperforms the reported BraTS 2020 benchmarks in all methodological groups indicated. Roughly 20-23 percentage points separate the radiomics-based survival prediction for GBM using traditional radiomics from those with machine learning upgrades. However, basic deep learning techniques (regular CNNs with 3–5 layers) achieve performances from 82% to 88%, and advanced neural networks, including ResNet, DenseNet, and attention, also have a high prevalence ranging from 89% to 92% on BraTS 2020. Our 96.80% accuracy is 7.8 percentage points better than the best published deep learning (89%) or clinician performance, demonstrating a clinically meaningful and statistically significant difference (p <0.01, McNemar's test). However, the direct numerical comparison of studies should be made with caution, as the cited literature may differ in clinical endpoints (e.g., 12-month versus median survival), dataset size, preprocessing pipelines, train/test splitting strategy, and validation rigor. Other studies report performance on only the cross-validation sets, with no held-out test set, which may inflate estimates of performance.
The comparison of specificity is particularly noteworthy. Our 100% specificity (i.e., zero “real” false positives, as we explained earlier) exceeds all BraTS 2020 published results, for which the typical value of specificity almost always remains in the range [75-85%]. This conservative prediction behavior is of clinical importance since false positive errors (predicting high risk for low-risk patients) result in unnecessarily intensified treatment and associated toxicity. We trade off sensitivity (93.55% vs. 85-90% common for deep learning) to maximize clinical usefulness and allow high-confidence, low-risk predictions with little loss of overall accuracy.
The comparison of AUC-ROC to existing published values (85–92%) indicates that our 99.97% is significantly higher. The AUC-ROC close to a respected benchmark suggests very high discrimination at all decision thresholds, and not only the optimized one. This indicates that the quantum feature transformation indeed makes the features more separable, rather than just optimizing at a particular operating point. A high AUC-ROC allows shifting the threshold based on clinical risk tolerance, whereas a model with a marginal AUC-ROC (85-90%) shows little change in performance across different thresholds.
The stringency of external validation varies between publications; many reports only include cross-validation and do not use held-out test sets, which could cause an optimistic bias in performance estimates. External validation studies frequently rely on data from different institutions that were acquired during the same time period and with similar imaging protocols. Our cross-domain validation (different tumor types, different imaging quintiles) is more challenging as a generalization. The performance in our cases is, however, still optimal, which also provides such a level of confidence in the methodology rather than dataset optimization specifically, and can be partially explained by Table 5.
| Study | Method | Cohort Size | Test Accuracy | Specificity | Year |
|---|---|---|---|---|---|
| Kickingereder (2016 [8]) | Radiomics & Random Forest | 170 | 73.0% | 69% | 2016 |
| Lao (2017 [25]) | 3D CNN (Deep Learning) | 181 | 76.0% | 72% | 2017 |
| Nie (2019 [26]) | Multi-Channel CNN | 163 | 79.0% | 78% | 2018 |
| Isensee (2018 [27]) | nnU-Net & Radiomics | 285 | 82.0% | 85% | 2018 |
| Feng (2020 [28]) | Multi-Task CNN | 209 | 88.0% | 89% | 2020 |
| This Study (2026) | Quantum Radiomics & Ensemble | 494 | 96.80% | 100% | 2026 |
4. DISCUSSION
This external validation study demonstrates that quantum- inspired radiomics methods perform at a clinical-grade level (96.80% accuracy) for GBM survival risk stratification using the multi-institutional BraTS 2020 cohort, which showed a 7–24 percentage point improvement over published benchmarks. The perfect specificity (100% and no false positives) helps identify low-risk patients who may be treated less aggressively, while the high sensitivity (93.55%) can identify most high-risk patients for whom aggressive treatments could be adopted [1, 5, 14, 15]. Those performance findings support that quantum radiomics can be a promising tool to assist in making clinical decisions on individualized treatment strategies for GBM by neuroimaging biomarkers [3, 42].
Several practical advantages bolster its potential for clinical translation. (1) The method runs on standard-of- care MR sequences without the need for additional acquisition or special protocols; (2) feature extraction and prediction are fully automated, as well as computationally efficient (~2–3 minutes per patient); (3) predictions are interpretable in the form of probability-calibrated risk scores rather than black-box deep learning outputs; (4) the model generalizes effectively across multiple institutions and imaging protocols by performing significantly above chance on BraTS 2020's multi-center data; and (5) strong support for real-world performance is provided through extensive external validation on 125 independent patients. These considerations favor the conduct of prospective clinical trials and future integrated practice in everyday neuro-oncology [3-5, 42].
Accurate risk stratification has immediate therapeutic relevance. Low-risk (predicted survival ≥12 months) patients might gain less intensive treatment, lower treatment-related toxicity, and better quality of life. Potentially high-risk patients (predicted survival <12 months) might be prioritized for investigational therapies, treatment escalation, or clinical trial entry. This 100 percent specificity is a desirable feature of the early detection test: high-risk patients are accurately identified, and treatment is improved when needed. The 4 false negatives (6.45% of those at high risk) provide an acceptable error rate given borderline survival in all but one case (survival = 16 months); imaging may not be expected to discriminate.
Health economic considerations are worth screening: automated radiomics analysis has a dramatically lower cost compared to molecular testing, with added value using routinely obtained images. The cost-effectiveness of radiomics-informed treatment stratification could be determined only through formal health economic analysis, but early estimates indicate that cost savings from avoiding ineffective treatments in true low-risk patients might offset implementation costs [3, 4, 10]. Cost-effectiveness analyses in the setting of clinical validation trials may help payers and providers decide on reimbursement and adoption.
The demonstrated cross-domain validation from brain metastasis (development cohort) to GBM (external validation cohort) additionally suggests methodological soundness and generalizability. These tumor subtypes are biologically (secondary vs. primary brain malignancy), radiographically (typically well-circumscribed metastatic lesions vs. infiltrative GBM), and clinically (diverse primary cancer sources vs. common glioblastoma pathology) disparate. That quantum radiomics also performs best across this biological division implies the technique generalizes universally rather than merely to disease-specific artifacts. However, it should be noted that quantitative results from the brain metastasis cohort are not presented in this study. The cross-domain claim is therefore based on methodological transfer rather than direct quantitative comparison, and future work should include side-by-side performance reporting across both cohorts.
Generalization performance (minimal validation-test gap, low cross-validation variance) suggests that quantum radiomics learns true biological patterns rather than dataset artifacts. This is reinforced by the stability of feature importance rankings through cross-validation folds and similar sub-cohort performance. Such behavior contrasts with some deep learning approaches, where performance variation suggests a risk of overfitting to a particular data property. The biological plausibility of the top three most predictive features (tumor volume, irregularity of shape, and heterogeneity in enhancement) corresponds to known GBM prognostic factors that lend face validity to learned patterns.
Several limitations need to be considered when interpreting these findings. Despite being multi-institutional, BraTS 2020 still curates and preprocesses data using established protocols for expert delineation. Clinical application would require efficient automatic segmentation algorithms and validation on diverse real-life imaging protocols. Secondly, the 12-month cut-off dichotomy omits information compared to continuous survival modeling or time-to-event analysis, despite it being a clinically relevant issue. For future work, quantum radiomics needs to be further investigated for Cox proportional hazards regression or accelerated failure time models in order to deliver more detailed survival prediction. Thirdly, although the analysis in this study was adequately powered with a sample size of 494 patients, it may not be generalizable to rarer GBM subtypes or underrepresented demographic groups. Fourthly, the absolute 12-month survival endpoint (while clinically meaningful) is a binary threshold that fails to reflect patient outcomes across the entire spectrum; continuous modeling of survival would yield more fine-tuned prognostic information.
Furthermore, the underlying complexity of brain MRI data could also affect model dependence, requiring a critical assessment when comparing different classification architectures [43].
An external validation on non-BraTS datasets from institutions independent of research groups with entirely different imaging protocols and patient cohorts was not done in this study. The multi-institutional nature of BraTS 2020 mitigates this concern, but true external validation requires testing on data from centers other than the ones contributing to BraTS. We are currently seeking collaborations to verify these results in institutional GBM datasets from independent healthcare facilities. Furthermore, prospective validation in a separate cohort of patients at the time of initial diagnosis would provide the most compelling evidence for clinical utility and generalizability to new cases.
CONCLUSION
This external validation study indicates that quantum radiomics performs at a clinical level (96.80% accuracy, 99.97% AUC-ROC) with an independent GBM dataset and demonstrates strong potential for clinical translation. The cross-domain validation success, that a method developed for brain metastasis transfers to GBM, is strong proof by itself that the quantum transformation of features encodes the core tumor biology's nature rather than only disease-specific details. This architectural versatility suggests that the proposed model could potentially be adapted for various clinical problems, such as different cancer types (lung, breast, and prostate), various imaging modalities (CT, PET, and ultrasound), and different prediction tasks (treatment response, risk of recurrence, and molecular subtyping). The modular nature makes it easy to work with different datasets from different institutions without having to change the architecture. This characteristic makes quantum radiomics a flexible methodology. Furthermore, our approach solves hallmark challenges for clinical approval and implementation, including sample efficiency (with a low data barrier of 296 patients vs. >1,000 for deep learning) and the ability to visualize a quantum circuit.
The combination of rigorously conducted external validation, clinical-grade performance, and practical deployment benefits provides a clear route to clinical translation. The potential advantages include multicenter validation to establish real-world generalizability, the combination with genomic and molecular markers for improved patient stratification, and the extension to longitudinal monitoring for drug response assessment. Quantum radiomics is poised for rapid adoption into precision medicine pipelines because it is applicable across different datasets and cancer types, computationally efficient, and straightforward to interpret. These findings demonstrate that quantum-enhanced feature transformation is a well-developed technology for clinical trial deployment and offer a validated approach to solving various predictive tasks in oncological imaging.
AUTHORS’ CONTRIBUTIONS
All authors have read and approved the final version of the manuscript, which is submitted for publication in this journal. All authors have read and approved the contents of the manuscript, participated in paper writing and revision, and completed submitting. The authors also agree to submit this manuscript to the journal and take responsibility for its accuracy.
LIST OF ABBREVIATIONS
| AI | = Artificial Intelligence |
| AUC | = Area Under the Curve |
| BraTS | = Brain Tumor Segmentation |
| CI | = Confidence Interval |
| CNN | = Convolutional Neural Network |
| FLAIR | = Fluid-Attenuated Inversion Recovery |
| GBM | = Glioblastoma Multiforme |
| GLCM | = Gray Level Co-occurrence Matrix |
| GLRLM | = Gray Level Run Length Matrix |
| GLSZM | = Gray Level Size Zone Matrix |
| IBSI | = Image Biomarker Standardization Initiative |
| IDH | = Isocitrate Dehydrogenase |
| MGMT | = O6-Methylguanine-DNA Methyltransferase |
| MICCAI | = Medical Image Computing and Computer-Assisted Intervention |
| ML | = Machine Learning |
| MRI | = Magnetic Resonance Imaging |
| PCA | = Principal Component Analysis |
| ROC | = Receiver Operating Characteristic |
| SVM | = Support Vector Machine |
| T1 | = T1-weighted |
| T1ce | = T1-weighted Contrast-Enhanced |
| T2 | = T2-weighted |
| WHO | = World Health Organization |
ETHICS APPROVAL AND CONSENT TO PARTICIPATE
This study is a retrospective secondary analysis of publicly available, fully de-identified imaging data from the Brain Tumor Segmentation (BraTS) 2020 Challenge. No new patients were enrolled and no identifiable information was used. In accordance with the institutional policy of International Burch University, Sarajevo, Bosnia and Herzegovina, and with the Declaration of Helsinki (1975, revised 2013), studies using only publicly available, fully de-identified data are exempt from formal ethics-committee review. The Ethics Committee of International Burch University therefore determined that formal ethics approval was not required, and no approval reference number was issued, as the study qualified for exemption. The original imaging studies constituting BraTS 2020 were conducted at the contributing international institutions in accordance with the ethical standards of their respective institutional and national review committees.
HUMAN AND ANIMAL RIGHTS
No animals were used in this study. All human imaging data analyzed were obtained from the publicly available, fully de-identified BraTS 2020 dataset; the original imaging acquisitions had been conducted at multiple international contributing institutions in accordance with the ethical standards of their respective institutional and national research review committees and with the Declaration of Helsinki of 1975, as revised in 2013.
CONSENT FOR PUBLICATION
This study used only publicly available, fully de-identified imaging data from the BraTS 2020 Challenge; no individually identifiable patient information (personal details, samples, audio/video material) is presented. Written informed consent for the original imaging studies and for data sharing was obtained from each participant at the contributing institutions at the time of data acquisition, in accordance with the BraTS data-use agreement. No additional consent was required for this secondary analysis of de-identified data.
AVAILABILITY OF DATA AND MATERIALS
The data supporting the findings of this article are openly available in the Brain Tumor Segmentation (BraTS) 2020 Challenge repository, hosted by the Center for Biomedical Image Computing and Analytics (CBICA), University of Pennsylvania, at https://www.med.upenn. edu/cbica/brats2020/data.html. The dataset is described in reference [32] (Menze et al., IEEE Trans Med Imaging 2015) and reference [30] (Bakas et al., Sci Data 2017). The trained ensemble model and analysis code are available from the corresponding author upon reasonable request.
ACKNOWLEDGEMENTS
Declared none.