All published articles of this journal are available on ScienceDirect.

Antero-Posterior EEG Spectral Power Gradient as a Correlate of Extraversion and Behavioral Inhibition
Abstract
Several studies have shown that individual-specific patterns of cortical spectral power distribution are relatively stable across time and experimental conditions. The antero-posterior EEG spectral power gradient (APSPG) emerged as the most prominent feature associated with important personality characteristics. In this study this phenomenon is further investigated in relation to its stability and association with different personality traits. It has been shown that APSPG is generally more pronounced during resting baseline than during inter-trial interval and post-stimulus period. Its association with personality variables is similar for different frequency bands and is mostly preserved during different experimental conditions. Relatively higher oscillatory activity in frontal than in posterior cortical sites is more frequently observed in subjects with higher behavioral inhibition (BIS) and lower Sociability. Source localization analysis showed that both high BIS/low Sociability and high APSPG are associated with higher oscillatory activity in medial cortices associated with emotion processing (mostly the cingulate gyrus). This association could be tentatively explained by higher vigilance and emotional tension in introverted and behaviorally inhibited subjects.
INTRODUCTION
The general tendency in the research of brain oscillations is to study effects averaged both in the within- (i.e., across consecutive trials) and the between- (i.e., across individuals) subject domains. Such approach helps to reveal major effects that are stable across time and subjects. However, this approach largely precludes systematic investigation of time-varying patterns and individual differences in observed effects. Analysis of variability of short-term spectral patterns (SPs) shows that a limited number of SP types may describe the human electroencephalogram (EEG) accurately [1, 2]. However, only about half of all SP types are functionally active (i.e., their appearance depends on the functional state of the brain) [1]. Individual-specific SP characteristics show trait-like properties being relatively stable over long periods of time [3]. This concurs with rapidly accumulating evidence showing heritability of some important characteristics of brain oscillations. Twin studies indicate that a considerable part of inter-individual variation in EEG variables could be attributed to genes [4]. The heritability estimates are about 79% for EEG alpha power (somewhat lower for other frequency bands), 81% for alpha peak frequency, 60% for P300 amplitude and EEG coherence measures [4-6]. It has been also shown that about 60% of the variance in the temporal structure of amplitude fluctuations in spontaneous EEG oscillations could be attributed to genetic factors [7].
One characteristic of the short-term SPs that is relatively less studied is the temporal variability and individual differences in the cortical distribution of spectral power in different frequency bands. It is well established that different cortical areas participate in different functional processes. On the other hand, it is increasingly becoming clear that different frequency oscillations may play the crucial role in the integration of different kinds of brain activity [8, 9]. Hence, individual-specific time-varying patterns of the distribution of spectral power across the cortex may relate to the within- and between-subject differences in functional activity. General understanding in EEG research is that cortical distribution of spectral power varies as a function of time, frequency, state, and experimental condition. There are findings, however, which show that individual-specific patterns of cortical spectral power distribution could be amazingly stable, at least in some experimental conditions [10-12]. It has been shown, for example, that a particular topographic distribution of the EEG spectral power along the antero-posterior cortical axis, like a "fingerprint," distinguishes each individual during non-REM sleep. This individual EEG-trait was substantially invariant across six consecutive nights characterized by large experimentally induced changes of sleep architecture. It has been hypothesized that this EEG invariance can be related to individual differences in genetically determined functional brain anatomy, rather than to sleep-dependent mechanisms [11]. Similarly, Tinguely et al. [12] in their study of functional EEG topography in sleep and waking have found that, although EEG spectral power is modulated by state and sleep pressure, basic topographic features appear to be state-independent. Moreover, a high degree of intra-individual correspondence of the spectral power maps was observed across the studied states. Basile et al. [10] have shown that during a simple visual task individual-specific patterns of spectral power cortical distribution are largely the same as they were during the pre-stimulus baseline. In two different experimental datasets Knyazev [13] analyzed the stability and variability of individual patterns of cortical spectral power distribution across time, experimental conditions, and frequency bands. It has been shown that in spite of high short-term variability, individual-specific patterns of cortical spectral power distribution are remarkably stable across frequency bands, long periods of time, and experimental conditions. These patterns are related to state and trait participant’s characteristics. The antero-posterior spectral power gradient (APSPG) emerged as the most prominent feature associated with important personality dimensions. Relatively higher oscillatory activity in the frontal cortical region was related to Behavioral Inhibition (predisposition to anxiety and vigilance, [14]), whereas relatively higher activity at posterior sites was associated with Extraversion (E). It should be noted in parentheses that higher or lower oscillatory activity is defined here as higher or lower spectral power measured by means of conventional spectral decomposition techniques, such as Fast Fourier Transform (FFT) or wavelet transform. This finding is in line with the literature linking higher or lower activity in the prefrontal cortex (PFC) to approach and withdrawal behavioral tendencies. Indeed, although the most known and popular among EEG researchers theory relates personality traits such as Behavioral Activation and Behavioral Inhibition to asymmetrical frontal activity [15], several researchers have emphasized the importance of bilateral (or symmetrical) frontal EEG activity in the context of personality traits [16-18]. Hewig et al. [17, 18] proposed that low resting bilateral frontal EEG activity in the alpha band is associated with high habitual activity in Gray’s [14] Behavioral Activation System (BAS). The BAS is a dopamine-based motivational system closely related to E [19]. Hewig et al. [17, 18] observed significant negative correlations between scores on Carver and White’s [20] BAS scale and resting EEG alpha power at frontal scalp sites and a positive correlation of similar magnitude between BAS sensitivity and EEG alpha power at parietal and parieto-occipital sites. Moreover, several functional magnetic resonance imaging studies have found correlations between E traits and activity in the anterior cingulate cortex (ACC) during a number of cognitive and emotional tasks [21-24]. The ACC is an area of the PFC that receives strong dopaminergic (DA) inputs [25, 26] and whose activity is influenced by genes controlling PFC DA neurotransmission [27]. There is evidence [28] that activity in this region is reflected in frontal midline EEG activity in the theta band (4-8 Hz). Basing on theses evidences, Wacker et al. [29] hypothesized that a difference between EEG alpha activity at frontal sites minus activity at parietal sites would be maximally suited to capture the aspect of brain electrical activity related to habitual BAS activation. They also hypothesized that the difference between frontal midline theta activity and theta activity at posterior sites would be well suited to capture an aspect of EEG theta activity related to brain dopaminergic functioning. They were able to demonstrate that the negative association between E and the frontal (Fz) minus parietal (Pz) theta activity, which was observed in the placebo group, was completely reversed in the group that received the selective dopamine D2 antagonist sulpiride [29]. Similar effect was observed for the low alpha band (8-10 Hz) but it failed to reach significance level. This intriguing finding implies that the fronto- posterior spectral power gradient (specifically in the theta band of frequencies) may reflect trait-like predispositions which depend on the brain dopamine functioning.
It should be noted that Knyazev [13] used collapsed across all frequencies measure of the antero-posterior gradient (APSPG). In light of the above discussed findings by Wacker et al. [29], a question arises as to whether APSPG in different frequencies would show similar correlations with personality, or (as it appeared in the Wacker et al.’s study) most substantial correlations would be found for the theta band. The latter result would be meaningful given theoretical considerations and empirical evidence linking theta oscillations with emotion processing [30, 31]. Another question is whether the APSPG relates specifically to E (and, more precisely, to agentic E [29]), or is associated with a broader set of personality traits? Depue and Collins [19] note that E can be subdivided into sociability on the one hand and agency on the other. It is the agency facet of E (i.e., a motivational disposition that comprises social dominance, enthusiasm, energy, assertiveness, ambitiousness, and achievement striving), which they regard as the central characteristic of E and for which they propose a dopaminergic basis in their theory. Wacker et al. [29] show that the difference between frontal midline theta activity and theta activity at posterior sites relates specifically to agentic E (which was measured by the Activity scale of the Zuckerman-Kuhlman Personality Questionnaire [32]). On the other hand, Knyazev [13] has found correlations of the APSPG not only with E, but also with facets of Neuroticism and Behavioral Inhibition. The third question is whether individual differences in APSPG (and its association with personality) are stable across different experimental conditions? Knyazev [13] show moderate to strong between-condition correlations in cortical spectral power distribution, but this does not actually mean this distribution does not change in different states. Wacker et al. [29] show that both the magnitude of the frontal minus parietal theta and alpha activity and the strength of its association with E are moderated by different experimental conditions and by administration of the selective dopamine D2 antagonist. Finally, we aimed to explore the cortical/subcortical sources of individual differences in APSPG. Basing on existing literature, we mainly expected to find these sources in the cingulate gyrus. To address these questions, previously collected data [33] were reanalyzed.
MATERIALS AND METHODS
Subjects
The study sample included 39 healthy, right-handed volunteers (21 females) aged 17 to 32 years with normal or corrected to normal vision. Each participant received a sum equivalent to about 5 USD for participation. All applicable participant protection guidelines and regulations were followed in the conduct of the research in accordance with the Declaration of Helsinki. All participants gave informed consent and the study was approved by the Institute of Physiology ethical committee.
Instruments
All participants completed the following psychometric measures: Behavioral Inhibition (BIS) and Behavioral Activation (BAS) were measured by a short form of the Gray-Wilson Personality Questionnaire (GWPQ [34]). Eysenckian personality dimensions were measured by a short form of the Eysenck Personality Profiler (EPP [35, 36]). This inventory contains 3 scales for each major personality dimension, plus a Lie scale. The 3 traits selected for Extraversion are Sociability, Activity and Assertiveness. The 3 traits selected for Neuroticism are Anxiety, Inferiority, and Unhappiness. The 3 traits selected for Psychoticism are Risk-taking, Impulsiveness, and Irresponsibility. Trait Anxiety was measured by the Spielberger’s State Trait Anxiety Inventory (STAI [37, 38]).
Experimental Procedure
As stimulation we used an ensemble of the photographs presented by Ekman and Friesen [39]. We selected 30 photographs, specifically, 5 different females and 5 different males with 3 different facial expressions (angry, happy, and neutral). The pictures were presented black and white (17×17 cm) and displayed on a screen at a distance of 120 cm from the participants. All physical parameters of stimulation (brightness, intensity of illumination) were equal for all presented stimuli. The participants sat in a soundproof and dimly illuminated room. After about 4 min of spontaneous EEG registration with eyes open (baseline) they were instructed to evaluate emotional expression of each presented face on an analog scale ranging from -100 (very hostile) to 100 (very friendly). First, a fixation cross appeared at the center of the screen for 1 sec. Then a face picture was presented for 4 sec, which was followed by presentation of the evaluative scale. During the 4 sec of the test interval the participants were watching the presented face trying to comprehend its emotional message; after presentation of the evaluative scale they had opportunity to express their understanding of this message. Angry, happy, and neutral faces were delivered randomly, and inter-stimulus-interval randomly varied between 4 and 7 s to avoid temporally conditioned responses. The number of face stimulations was 120 for each participant, including 40 faces of each category. In this study, besides the baseline, the inter-trial interval (ITI, 1000 ms prior to the fixation cross presentation) and the post-stimulus period (PSP, 1000 ms after the face picture presentation) were analyzed.
EEG Recording
EEG was recorded using a 32-channel PC-based system via silver-silver chloride electrodes. A mid-forehead electrode was the ground. The signals were amplified with a multichannel biosignal amplifier EEG8 manufactured by Contact Precision Instruments Inc., Boston MA, with bandpass 0.05 - 70 Hz, -6 dB/octave and continuously digitized at 300 Hz. Notch filter for removing 50 Hz power supply artifacts was not used, because in this study only frequencies below 30 Hz were analyzed. The electrodes were placed at 30 head sites according to the International 10-20 system (O1, Oz, O2, Pz, Cz, Fz, TP7, CP3, CP4, TP8, P7, P3, P4, P8, FT7, FC3, FC4, .FT8, T7, C3, C4, T8, FCz, Fp1, Fp2, CPz, F7, F3, F4, F8) and referred to linked-mastoids. The horizontal and vertical EOG was registered simultaneously. EEG data were artifact-corrected using Independent Components Analysis via EEGLAB toolbox (http://www.sccn.ucsd.edu/eeglab/) with additional visual rejection of artifact-contaminated data off-line.
Data Analyses and Statistics
Power spectral density was calculated for artifact-free baseline, ITI, and PSP epochs (the epoch length was 1.7, 1, and 1 sec, respectively) using Welch’s averaged modified periodogram method of spectral estimation through a Hamming window. The power spectral density estimates were log-transformed (using the base 10 logarithm) in order to normalize their distribution. Spectral estimates were averaged within delta (1-3.8 Hz), theta (4.1-6.7 Hz), alpha (7.0-11.7 Hz), and beta (12.0-30.2 Hz) bands. For each epoch of every subject the spectral power data for each frequency band (i.e., delta, theta, alpha, and beta) were converted into z-scores across the channels (i.e., mean across all channels spectral power was subtracted from each channel spectral power and the remainder was divided by standard deviation). Next, the channel data were averaged along “latitudinal” dimensions, thus obtaining an antero-posterior vector of seven variables: (1) Fp1, Fp2; (2) F7, F3, Fz, F4, F8; (3) FT7, FC3, FCz, FC4, FT8; (4) T7, C3, Cz, C4, T8; (5) TP7, CP3, CPz, CP4, TP8; (6) P7, P3, Pz, P4, P8; (7) O1, Oz, O2. Then, differences between all but the last variable and the next one in the antero-posterior vector were calculated and accumulated. Note that positive values of this measure evidence higher spectral power in anterior than in posterior sites, whereas negative values point to the opposite. For ANOVA analysis, for all five experimental conditions (baseline, ITI, PSP for angry face presentation, PSP for happy face presentation, PSP for neutral face presentation) and the four frequency bands the percent of trials with a positive APSPG value (reflecting higher oscillatory activity in anterior than in posterior cortical sites) was calculated and used as a dependant measure. Repeated measures ANOVAs were conducted to test the effects of gender and psychometric variables as between-subject factors and experimental condition and frequency band as within-subject factors. To avoid averaging across subjects, between-subject variables were entered as covariates rather than as grouping variables. Grouping variables (i.e., above vs. below median) were subsequently used only for demonstration purposes. Greenhouse-Geisser correction for sphericity assumption violation was used where necessary.
To determine the cortical sources of individual differences in APSPG, sLORETA [40] was applied to the data. The sLORETA is a linearly distributed solution that is based on standardized values of the current density estimates given by the minimum norm solution. The sLORETA functions on the assumption that the EEGs measured on the scalp are generated by highly synchronized post-synaptic potentials occurring in large clusters of neurons [40]. sLORETA uses a three-shell spherical head model registered to the digitized Talairach and Tournoux [41] atlas (Brain Imaging Centre, Montreal Neurological Institute). For baseline, ITI, and PSP epochs, delta, theta, alpha, and beta power was calculated for each trial and current source density was estimated for 6430 cortical voxels under the assumption that neighbouring voxels have similar activity. Current source density data were analyzed voxel-wise using statistical non-parametrical mapping implemented in the sLORETA package [40]. Regression analyses were used to predict the delta, theta, alpha, and beta current source density estimates from averaged across the four frequency bands baseline APSPG values, or relevant psychometric variables. The statistical significance of the regression coefficients was assessed using a randomization test [42] that corrects for multiple comparisons to keep the family-wise Type I error rate to .05.
RESULTS
Estimated marginal grand mean (Std. Error) for the percent of trials with a positive APSPG (PAPSPG) value was 44.2 (2.4). Repeated measures ANOVA with experimental condition and frequency band as within-subject factors and PAPSPG value as the outcome showed significant main effects for condition (F = 4.36, df = 1.79, p = 0.020), frequency (F = 23.24, df = 1.76, p < 0.001), and their interaction (F = 13.87, df = 5.51, p < 0.001). PAPSPG was higher for delta and theta (estimated marginal means = 53.4 and 52.9, respectively) than for alpha and beta (estimated marginal means = 35.3 and 35.2, respectively). Due to significant interaction condition x band, the effect of condition was further analyzed separately for each frequency band. It was significant for delta (F = 3.01, df = 2.42, p = 0.044), theta (F = 3.97, df = 2.37, p = 0.017), and beta (F = 19.34, df = 1.82, p < 0.001), but not for alpha (F = 1.09, df = 2.16, p = 0.343) band. In all frequency bands PAPSPG tended to be higher during baseline and ITI than during PSP.
Series of repeated measures ANOVAs were further conducted for each frequency band separately with experimental condition as within-subject factor, gender and psychometric variables as between-subject factors, and PAPSPG as the outcome. In all frequency bands females showed higher mean PAPSPG than males, but this effect was significant only for delta band (F = 9.42, df = 1, p = 0.004). The main effect of E was significant for theta (F = 4.8, df = 1, p = 0.036) and alpha (F = 4.12, df = 1, p = 0.050) bands. The interaction E x condition was significant for delta (F = 3.15, df = 2.63, p = 0.035), theta (F = 3.69, df = 2.43, p = 0.022), and alpha (F = 3.17, df = 2.25, p = 0.042) bands. In all cases extraverts showed lower PAPSPG than introverts, but this difference was most pronounced during the baseline condition. In all other conditions, relative to baseline, PAPSPG tended to decrease in all subjects, but this decrease was sharper in introverts than in extraverts. As a result, the main effect of condition was significant in introverts (F = 3.62, df = 2.05, p = 0.036), but it was not significant in extraverts (F = 1.41, df = 1.76, p = 0.260). When effects of the three E facets were analyzed, only Sociability showed significant main effects for delta (F = 5.83, df = 1, p = 0.022), theta (F = 6.41, df = 1, p = 0.016), and alpha (F = 5.35, df = 1, p = 0.027) bands Fig. (1, 2), whereas effects of Activity and Assertiveness were nonsignificant.
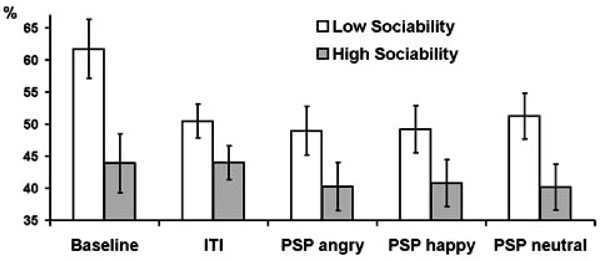
Estimated marginal means and standard errors of averaged across delta, theta, and alpha bands PAPSPG values in the five experimental conditions in subjects with below (empty bars) and above (filled bars) median scores on Sociability.
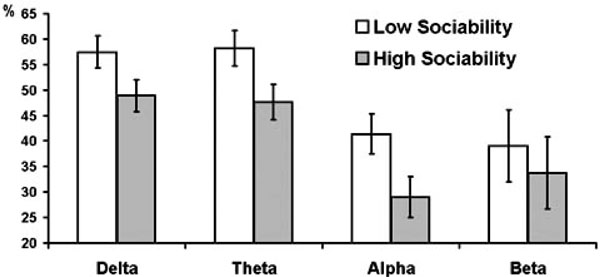
Estimated marginal means and standard errors of averaged across experimental conditions PAPSPG values in delta, theta, and alpha bands in subjects with below (empty bars) and above (filled bars) median scores on Sociability.
Assertiveness showed significant interactions with condition for theta (F = 3.07, df = 2.38, p = 0.043) and alpha (F = 5.93, df = 2.42, p = 0.002) bands. High as compared with low Assertiveness subjects showed lower PAPSPG during baseline recording, but higher PAPSPG during all other conditions. Main effect of Trait Anxiety was significant only for theta band (F = 6.22, df = 1, p = 0.018). Main effect of BIS was significant for delta (F = 5.48, df = 1, p = 0.025), theta (F = 9.02, df = 1, p = 0.005), alpha (F = 10.02, df = 1, p = 0.003), and beta (F = 5.6, df = 1, p = 0.024) bands. In all cases anxious and high BIS subjects showed higher PAPSPG Figs. (3, 4). There were no significant effects of BAS and Psychoticism.
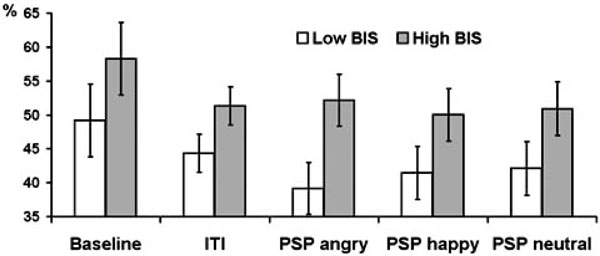
Estimated marginal means and standard errors of averaged across delta, theta, and alpha bands PAPSPG values in the five experimental conditions in subjects with below (empty bars) and above (filled bars) median scores on BIS.
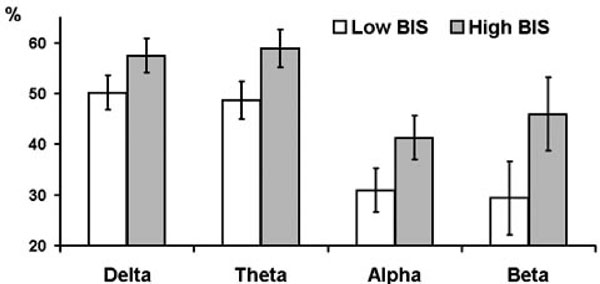
Estimated marginal means and standard errors of averaged across experimental conditions PAPSPG values in delta, theta, and alpha bands in subjects with below (empty bars) and above (filled bars) median scores on BIS.
Finally, sLORETA analyses were conducted to compare cortical sources of individual differences in APSPG values with cortical sources of individual differences on relevant psychometric variables. Baseline APSPG values were averaged across the four frequency bands and used in a regression analysis as the independent variable to predict baseline, ITI, and PSP delta, theta, alpha, and beta current source density estimates. As there were only minor differences in localization of sources for baseline, ITI, and PSP conditions, only results for the baseline condition are reported Fig. (5).
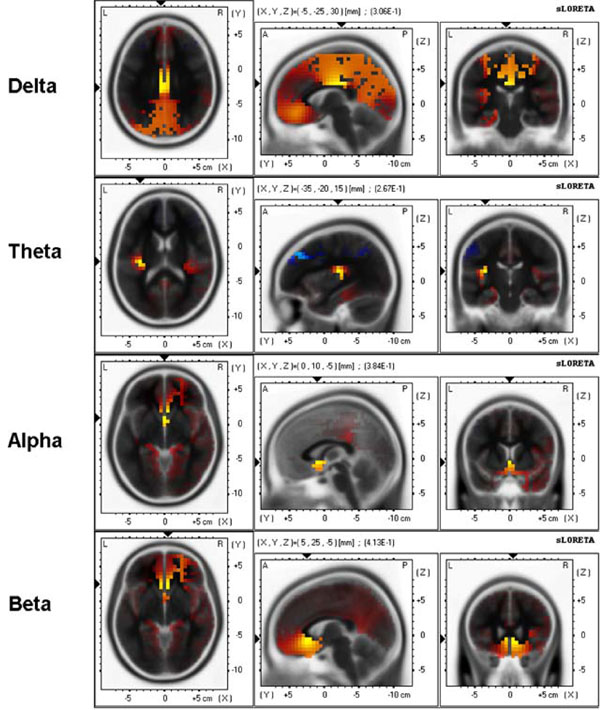
sLORETA 3-D distribution of significant correlations of APSPG values with delta, theta, alpha, and beta source current density during baseline resting condition. Red color shows significant positive correlations and blue color shows significant negative correlations (p < .05, corrected for multiple comparisons).
For delta band, maximal correlation (0.31) was found in the cingulate gyrus, BA23 [(X, Y, Z) = (-5, -25, 30)]; for theta band maximal correlation (0.26) was found in the insula, BA13 [(X, Y, Z) = (-35, -20, 15)]; for alpha band maximal correlation (0.38) was found in the anterior cingulate, BA25 [(X, Y, Z) = (0, 10, -5)]; for beta band maximal correlation (0.41) was found in the anterior cingulate, BA24 [(X, Y, Z) = (5, 25, -5)].
The same analysis was conducted using relevant psychometric variable instead of APSPG. Because BIS and Sociability showed strongest associations with APSPG, their combination was used in this analysis (i.e., BIS z-scores - Sociability z-scores). Fig. (6) shows results for the baseline condition.
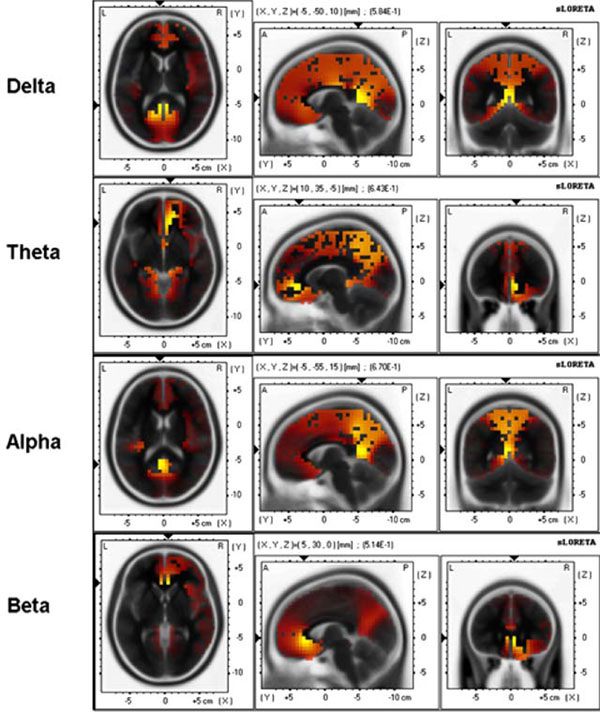
sLORETA 3-D distribution of significant correlations of BIS-Sociability scores with delta, theta, alpha, and beta source current density during baseline resting condition. Red color shows significant positive correlations and blue color shows significant negative correlations (p < .05, corrected for multiple comparisons).
For delta band maximal correlation (0.58) was found in the posterior cingulate, BA29 [(X, Y, Z) = (-5, -50, 10)]; for theta band maximal correlation (0.64) was found in the anterior cingulate, BA32 [(X, Y, Z) = (10, 35, -5)]; for alpha band maximal correlation (0.67) was found in the posterior cingulate, BA30 [(X, Y, Z) = (-5, -55, 15)]; for beta band maximal correlation (0.51) was found in the anterior cingulate, BA24 [(X, Y, Z) = (5, 30, 0)].
DISCUSSION
In our analyses, we deliberately avoided averaging across trials. Instead we chose a measure of relative frequency of appearance of a particular instantaneous pattern of cortical EEG spectral power distribution which is characterized by relatively higher oscillatory activity in frontal than in posterior cortical sites. Overall, this pattern appeared in approximately half of trials, but there were significant between- and within-subject differences which may help to deduce possible physiological (psychological) concomitants of this pattern. In the within-subject domain, relative prevalence of oscillatory activity in frontal regions was more frequently observed in “passive” states (baseline and ITI) than in states associated with the perception of visual information. This is to be expected given that visual perception is associated with occipital cortical regions. This fact further confirms that brain oscillations have functional significance and do not reflect an “idling” condition.
Effects of personality variables were not restricted to the theta band of frequencies. Similar effects of E were observed in delta, theta, and alpha bands. Effects of BIS were significant in all four frequency bands. It should be emphasized that this similarity refers only to the pattern of individual differences in the antero-posterior spectral power gradient values and its correlations with personality variables. It does not mean that within each individual subject the actual antero-posterior distribution of spectral power was identical in different frequencies. It is common knowledge that in healthy subjects during rest alpha power is maximal in posterior, whereas delta and theta power is higher in the frontal cortex areas.
The observed uniformity of relations between personality and the antero-posterior spectral power gradient in different frequencies seems puzzling given vast literature highlighting different functional correlates of different frequency oscillations. It appears that individual-specific pattern of cortical distribution of oscillatory activity and reciprocal relationships between different frequency bands are two different dimensions. Whereas the former reflects general level of oscillatory activity in different cortical regions, the latter relates to specific between-band relationships which could be observed within each region. It seems that the magnitude of the overall (across all frequencies) oscillatory activity is an important characteristic, which probably reflects intensity of functional involvement of a particular cortical region.
In our study, APSPG was most consistently associated with Sociability and BIS. Specifically, relatively higher oscillatory activity in frontal than in posterior cortical sites was more frequently observed in individuals with higher behavioral inhibition and lower sociability than in disinhibited and sociable individuals. This pattern of results somewhat differs from Wacker et al.’s [29] suggestion that APSPG should be most closely associated with agentic aspects of E. In our study, these aspects were measured by Activity and Assertiveness scales. Activity did not show significant associations with PAPSPG, whereas Assertiveness showed the expected association only during baseline condition.
Analysis of cortical sources of inter-individual differences in APSPG values showed that for all but theta bands these differences were associated with differential activity within the cingulate cortex. For theta, cortical sources were found in the insula. Amazingly similar (except for theta) results were obtained when APSPG was replaced with the relevant psychometric variable. The strength of associations with cortical sources current density was higher for the psychometric variable than for APSPG. Thus, maximal correlations for APSPG were 0.31, 0.26, 0.38, and 0.41 for delta, theta, alpha, and beta bands, respectively, whereas for the psychometric variable they were 0.58, 0.64, 0.67, and 0.51. It should be noted that given low spatial resolution of sLORETA and the known caveats inherent in inferring brain electrical sources from scalp EEG data, precise localization of maximal correlations should be interpreted with caution, and the most robust result seems to be that higher behavioral inhibition and lower sociability are associated with higher activity in different parts of the cingulate cortex. The cingulate gyrus is involved in various functions, such as attention, pain, response selection, maternal behavior, vocalization, sensorimotor function and autonomic control [43]. However, it is generally acknowledged that different parts of the cingulate gyrus play a prominent role in conscious and unconscious perception of emotion. In 1937, James Papez [44] proposed that the dorsal anterior cingulate cortex was the seat of emotional experience. Although current models of how the brain mediates emotion are very different from the Papez model, this hypothesis was surprisingly prescient [45]. Cingulate lesions result in profound behavioral disturbance with abnormal expression and experience of affect [46]. The posterior cingulate is traditionally considered a part of the limbic system and has abundant connections with the hippocampus and the amygdala. The anterior cingulate plays an important role in arousal, attention, motivation, emotion, and feeling [45, 47, 48], in the interaction between emotion and attention [49, 50], in the top-down modulation of intense emotional responses [51, 52]. It has been suggested that the anterior cingulate has a superordinate role in executive control of attention [45]. According to this view, emotion, pain, or other salient exteroceptive or interoceptive stimuli provide moment-to-moment guidance regarding the most suitable allocation of attentional resources [45]. This idea is consistent with Paus’ [53] view that the dorsal anterior cingulate is fundamentally involved in translating intentions into actions in the context of emotional arousal. Being a place of convergence for motor control, emotion and cognition [54], the anterior cingulate may participate in emotional response inhibition [55] and in inhibitory control of movement [56]. Subjects with low sociability and high behavioral inhibition may be particularly vigilant and experience increased emotional tension in the environment of a psychophysiological laboratory which may show up in increased oscillatory activity within the cingulate cortex. Noteworthy, the difference between high and low Sociability subjects is most pronounced during baseline recording when the subjects’ attention is not captured by an external task; this difference substantially diminishes when attentional resources are directed to the task. As for the association between APSPG and cortical theta sources in the insula, this result should be treated with caution until it is replicated in some other study, but it generally corroborates the view that APSPG-related individual differences relate to differences in emotion processing because insula is a higher association area for bodily signals [57] and participates in the neural basis of background feelings [45, 58].
CONCLUSIONS
In conclusion, this study analysis shows that although cortical distribution of spectral power is relatively stable across time and experimental conditions (Knyazev, 2009), the APSPG is generally more pronounced during resting baseline than during ITI and PSP. Its association with personality variables is similar for different frequency bands (see Figs. 2 and 4) and is mostly preserved during different experimental conditions (see Figs. 1 and 2). Source localization analysis shows that both high BIS/low Sociability and high APSPG are associated with higher oscillatory activity in medial cortices associated with emotion processing (mostly cingulate gyrus). This association could be tentatively explained by higher vigilance and emotional tension in introverted and behaviorally inhibited subjects, although this issue clearly needs further exploration in different experimental conditions and with different psychometric instruments.
ACKNOWLEDGEMENTS
This study was supported by grants of the Russian Foundation for Basic Research (RFBR) № 08-06-00016-a and № 08-06-00011-a.

