All published articles of this journal are available on ScienceDirect.

Dynamic Diffusion Magnetic Resonance Imaging of Infarct Formation and Peri-infarct Spreading Depression after Middle Cerebral Artery Occlusion (MCAO) in macacca fasicularis
Abstract
Dynamic diffusion MRI was used to visualize hyperacute stroke formation in the brain of a cynomolgus macaque. Under fluoroscopic guidance, a microcatheter was placed into the middle cerebral artery (MCA). The animal was immediately transferred to a 1.5T clinical scanner. Dynamic T2-weighted imaging during bolus injection of Oxygen-17 enriched water through the microcatheter mapped out the territory perfused by the MCA segment. Serial diffusion measurements were made using diffusion-weighted echo-planar imaging, with a temporal resolution of 15 seconds, during injection of a glue embolus into the microcatheter. The apparent diffusion coefficient declined within the lesion core. A wave of transient diffusion decline spread through peripheral uninvolved brain immediately following stroke induction. The propagation speed and pattern is consistent with spreading peri-infarct depolarizations (PID). The detection of PIDs following embolic stroke in a higher nonhuman primate brain supports the hypothesis that spreading depressions may occur following occlusive stroke in humans.
INTRODUCTION
Cortical spreading depression (CSD) describes a propagating wave of transiently depressed cortical activity initially demonstrated electrophysiologically in rodent brain [1]. CSD has been demonstrated in experimental animal models by application of different types of stimuli to the cortex; mechanical (traumatic brain injury and stroke), chemical (direct potassium chloride solution application to the cortex) and electrical stimulation [2-8]. While experimental CSD induction in the normally perfused brain does not result in injury to the involved cortex, it has been hypothesized that CSDs in the vicinity of an ischemic lesion could add to the extent of the lesion, due to the increased metabolic demand during repolarization. In animal stroke models, waves of recurrent peri-infarct depolarizations (PIDs) have resulted in increased infarct volume [9-11]. In fact, as early as 1996, Hossmann et al [12] suggested that therapeutic supression of spreading depressions may miminimize infarct size.
CSDs and PIDs bear similarity in their rates of wave propogation and changes in the intra/extracellular ion concentrations, however there are differences in the metabolic state of the cortical tissue undergoing these depolarizations. Middle cerebral artery occlusion creating focal ischemia results in perfusion gradients, hence varying oxygen and glucose and nutrient supply, between the normal, peri-infarcted and infarcted tissue. Under these conditions the slow, persistent waves of depolarization start in the ischemic core and as they transistion to the metabolically compromised peri-lesional tissue they become transient waves of PIDs [6]. These waves then spread to normally perfused tissue as spreading depressions (SDs) that propagate at a speed of between 2-5 mm/minute.
Dynamic diffusion weighted MRI (DWI) is an ideal technique for charting the evolutionary timecourse from stroke inception, through the early hyperacute period (within minutes of stroke onset), the chronic period and beyond due to its unique sensitivity to the acute cellular swelling which accompanies membrane depolarization. While spreading depression was first visualized by MRI using blood oxygenation sensitive imaging [13] (by virtue of the hemodynamic sequelae of cellular repolarization), diffusion weighted imaging is most sensitive to the dynamic changes in cell volume occurring during CSD [14]. In order to visualize the waves of transiently depressed cortical activity with diffusion weighted imaging serial, high speed multi slice MR images (across the entire brain) acquired at a sufficiently rapid sampling rate are required [6] .
This manuscript reports a case of spreading depolarization observed using DWI in the peri-infarct tissue of a non-human-primate brain after middle cerebral artery occlusion (MCAO). We also describe a novel approach for interrogating the targeted perfusion territory (prior to stroke induction) with intra-arterial delivery of Oxygen-17 enriched water combined with rapid T2-weighted imaging [15]. Under physiologic conditions 17O-water lowers the proton T2 of blood, and perfused brain tissues [16-18]. The approach is similar to arterial delivery of conventional Gadolinium contrast agents [19] only using Oxygen-17 enriched water as a freely-diffusible tracer, potentially allowing for more accurate perfusion quantification [20].
METHODS
Animal Preparation
All animal procedures were approved by the animal committee of our institution. The detailed procedures for animal handling and stroke creation have been previously described [21]. The animals was kept warm, mechanically ventilated and physiological signs monitored throughout the entire experiment. Briefly, while under anesthesia (Propofol/Remifentanil, continuous i.v. infusion) the right middle cerebral artery (MCA) of a cynomolgus macaque was cannulated with a Prowler 10® angiographic microcatheter. The microcatheter was introduced through a guide catheter, over a micro guidewire, into the femoral artery and navigated into the MCA under X-ray fluoroscopic guidance. The microcatheter was advanced until there was resistance (it became occlusive) then pulled back slightly and the catheter fixed to the animals’s leg to prevent its movement. A final angiogram was performed to confirm normal perfusion prior to transfer to the MRI scanner.
MRI and Stroke Induction
The animal was transferred to a 1.5 Tesla MR scanner (GE Signa) adjacent to the fluoroscopy suite. Following pilot and baseline scans, Oxygen-17 saline solution (0.5ml of a 20% 17O-enriched solution) was delivered intraarterially as a rapid bolus through the microcatheter during serial EPI scanning in order to measure local brain perfusion. Single-shot EPI parameters were: TR 2 sec, TE 80 ms, FOV 120 X 120 mm, Matrix 64 X 64, slice thickness 3mm, 12 contiguous axial slices. Dynamic scans were acquired for a period of 2 minutes (60 time points) during the bolus experiment.
Stroke was effected by injection of cyanoacrylate adhesive (ethyl cyanoacrylate mixed with Ethiodol, a radiopaque contrast agent), as detailed in [21], during continuous diffusion weighted EPI scanning. Diffusion imaging parameters were as follows: spin-echo DWI-EPI, TE = 70ms, TR = 5s, slice thickness = 3mm, FOV = 120 x 120, Matrix = 128 x 128, 12 contiguous axial slices, one acquisition at b ≈ 25 s/mm2 and two acqusitions at b = 1000 s/mm2 per ‘set’ with diffusion weighting along the Z direction (superior-inferior). Acquisition of each set of images (for one diffusion measurement) took 15 seconds. A total of 80 sets of images were acquired over 20 minutes, glue (occluded the MCA to cause cerebral ischemia) was injected after the 5th diffusion image set. At the end of the dynamic imaging series, the microcatheter was removed (without moving the animal) and the stroke was monitored for the next 3 hours using diffusion tensor EPI, T2-weighted and gradient echo imaging. Additionally, a high resolution 3D spoiled gradient echo (SPGR) scan was acquired at approximately one hour post-occlusion for anatomical reference.
Data Processing
All images were transferred off-line to Linux workstations for analysis (MRVision, Redwood City, CA). The T2-weighted signal intensity from the bolus injection of Oxygen-17 enriched water was converted to a change in transverse relaxation rate (ΔR2) according to:
(ΔR2 = -ln(St/S0)/TE α [H217O]
where S0 is the average of the pre-injection time-points, and St is the signal intensity after tracer injection at time ‘t’, TE is the echo time, and [H217O] the contrast agent concentration in the tissue. The area under the ΔR2 curves was integrated to generate relative cerebral blood volume (rCBV) maps.
Each set of DWI images were fitted to a monoexponential function to yield ADC maps. In order to highlight changes in diffusion due to the glue embolus injection, an average baseline ADC map (mean of the first 5 timepoints) was subtracted from all subsequent maps to generate a ΔADC series. These serial ΔADC maps were analyzed to detect any transient diffusion changes due to PIDs. The function modelling the shape of the PID transients was constructed of two back-to-back exponentials, as described by Kastrup et al. [22], as shown below
A * ((1 − exp(−(TTP − t)/Tdec)) + c) for t < TTP
A * ((1 − exp(−(t − TTP)/Trec)) + c) for t > TTP
where TTP is the time point of the greatest ADC change (time-to-peak), Tdec and Trec are the exponential time constants for the decay and recovery part of the transient, and A, c are constants. Correlation coefficients, r, were calculated between the fitted model function and the measured ΔADC timecourse for each voxel and thresholded at r = 0.45. This threshold excluded most voxels with no ADC change in the brain as well as any background noise, while selecting voxels with a visually apparent transient ADC decline as well as voxels with persistent ADC decline. The timepoint of peak ADC decline (time-to-peak, TTP) resulting from the fitting process was extracted and mapped. Manually defined regions of interest (ROIs) were drawn on the serial ΔADC and TTP maps within the stroke lesion core and periphery. In-plane propagation velocity of the ADC transient was estimated on the most superior slice (slice 12) by fitting a straight line to the TTP vs linear displacement relationship, for 3 collinear ROIs
RESULTS
Pre-occlusion injection of H217O enriched water through the microcatheter resulted in 30-50% decrease in signal intensity in the T2-weighted EPI scans, see Fig. (1). The bolus transit was very rapid, typically lasting only about 4 seconds since the tracer was injected directly into the middle cerebral artery (i.e. there was little dilution of the bolus, as would be the case for a venous injection). After the bolus passage, the signal did not return to baseline as would be the case for conventional Gadolinium based contrast agents (which remain intravascular in normal brain) but increased slowly, reflecting the gradual washout of extravasated H217O from perfused brain tissue.
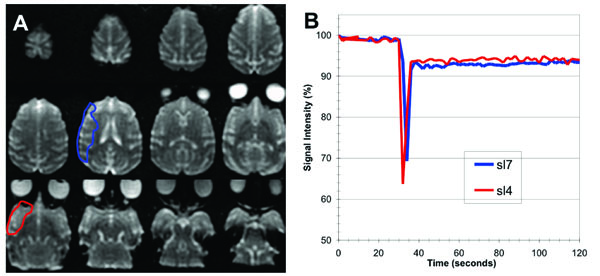
(A) Axial low diffusion-weighed (b0) EPI images covering the entire macaque brain (slices are ordered from 1 (inferior, lower right) to 12 (superior, upper left)). (B) Plots of percentage signal intensity vs time within the brain region perfused by 17O enriched water, delivered as a bolus injection through the microcatheter positioned within the middle cerebral artery (ROIs encompassed all of the perfusion region on the slices shown).
Relative CBV maps of the H217O perfused vascular territory are presented in Fig. (2A), indicating that the MCA segment containing the microcatheter supplies a large proportion of the hemisphere. Relative blood volume within this perfusion territory was relatively uniform except in the most superior slice (slice 12). The rCBV maps also demonstrate a focal hyperintensity at the posterior edge of the brain in most slices, reflecting venous drainage of the tracer via the saggittal sinus.
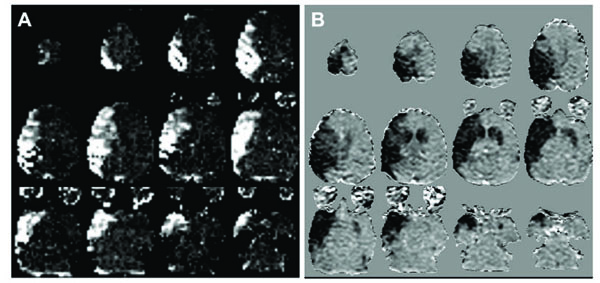
(A) Relative CBV maps (arbitrary scale) of the arterial territory perfused by the microcatheter from the bolus injection of 17O enriched water. (B) ADC difference maps (Δ ADC, grayscale -3x10⁻⁴ – 3x10⁻⁴ mm2/s) showing the regional decrease in diffusion coefficient between baseline and the final dynamic timepoints at 18-19 minutes after glue injection. There is good correspondence between the region perfused by the microcatheter and the initial stroke lesion following glue injection, with the addition of a small contralateral lesion mainly in the caudate. The small region of decreased ADC in the posterior contralateral occipital lobe in slice 4 (lower left image in B) represents a transient depolarization at the end of the image series.
Fig. (2B) shows ΔADC maps averaged over the final 5 timepoints (totalling 1.25 minutes) of the serial diffusion measurements, indicating the extent of the acute diffusion decline following glue injection. The initial extent of the acute stroke, defined by this early diffusion decrease, closely matches the vascular territory of the MCA segment (Fig. 2A) with the addition of a small area of contralateral involvement in the most superior slices as well as in the contralateral caudate and putamen. The initial stroke volume measured from these ΔADC maps was 18.6ml by 17 minutes after glue injection which grew by about 15% to 21.4ml measured (by diffusion MRI) at 107 minutes.
The results of fitting the model PID function to the serial ΔADC maps are shown in Fig. (3). The core of the initial stroke lesion appears as a bright mixed signal intensity region in the TTP maps (Fig. 3A) where the ADC declines persistently, see upper two plots in Fig. (3B). The ‘core’ area on the TTP maps closely match the areas of ADC decline, Fig. (2B). Voxels with persistent diffusion declines fall above threshold for the transient function fitting because of the large signal changes however, the TTP values fall towards the end of the time series and are noise driven. The time delay between embolization and the rapid change in ADC within the initial lesion core was approximately 95 seconds.
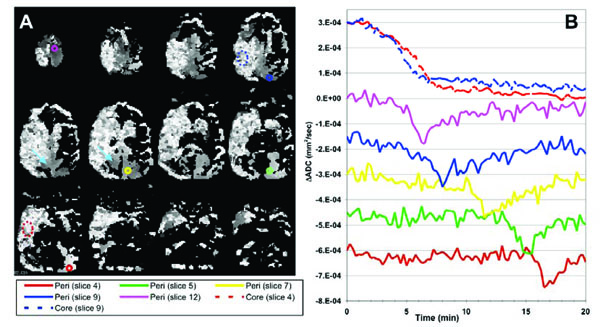
(A) ADC-TTP maps resulting from fitting the model transient function to the serial diffusion data. Pixel values represent the time-point of the peak diffusion decline (grayscale 0–20min, i.e. darker voxels represent an earlier peak diffusion decline). Bright mottled areas represent areas of persistent ADC decline consistent with the lesion core (peak position is noise-driven). Smoother grayscale regions repre-sent voxels containing ADC transients (consistent peak position across multiple neighboring voxels) reflecting a propagating depolarization wave spreading in a superior-inferior direction mostly in the contralateral ‘peri-infarct’ brain. (B) ΔADC timecourses measured from the color-coded ROIs shown in (A) indicating both persistent ADC declines in the lesion (broken lines on the plots and dotted ROI outlines) and propagating transients (solid lines) in peripheral tissue. Plots are color coded to ROI location and offset on the vertical scale for clarity. These ADC transients are consistent with a PID wave propagating in an inferior-posterior direction in contralateral gray matter, from a peri-infarct initiation site in the most superior slice (slice 12). In addition, a second transient was observed in a small area of ipsilateral peri-infarct tissue (pale blue arrows, middle row).
Brain regions exhibiting ADC transients appear as smooth gray regions in the TTP maps, where multiple neighboring voxels contain similar TTP values. The TTP maps and associated ROI plots in Fig. (3) are consistent with a propagating PID (or CSD) wave spreading from an initiation site on the most superior slice and spreading towards the inferior-occipital region of the brain through contralateral gray matter. Fig. (4) shows a more detailed view of the PID initiation site on slice 12. There was an initial persistent ADC decline in the ipsilateral and a small area of anterior contralateral brain in this section. The propagating diffusion decline seems to have initiated in tissue adjacent to this contralateral ischemic lesion since this is the location of the earliest ADC transient (green plot and ROI in Fig. 4). The transient PID propagates across this slice in a posterior-lateral (left) direction. By comparing the TTP and spatial coordinates of the three peri-infarct ROIs in Fig. (4B), we estimated the in-plane propagation speed of the wave at about 5.0 mm/min. Fig. (4C) shows an ADC map acquired at 107 minutes after MCA occlusion showing apparently normal ADC values both ipsi- and contralateral to the stroke in this slice (although the stroke area grew slightly in the more inferior slices).
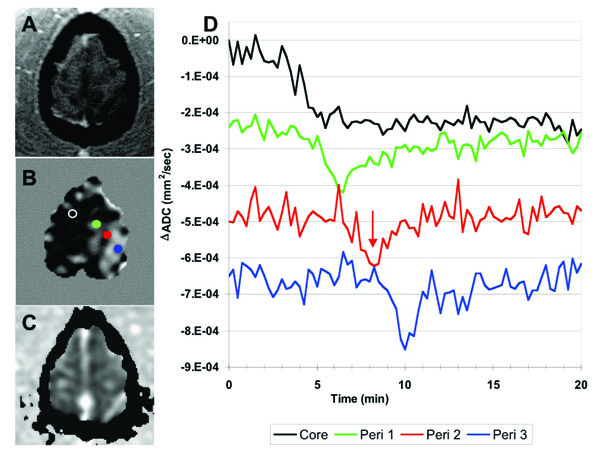
(A) SPGR anatomical image and (B) ΔADC map of the most anterior slice (slice 12) of the brain. The ΔADC map was acquired at about 6 minutes post-occlusion, indicated by the red arrow on the plots. The dark band beneath the red dot in B captures the propagating ADC wave as it traverses the peri-infarct tissue. (C) ADC map at 107 minutes after occlusion show-ing that the early persistent diffusion declines eventually resolve in this slice. (D) ADC timecourses from the color-coded ROIs shown in B, demonstrating an initial persistent depolarization in the ‘core’ but propagating transient changes across the remaining contralateral brain at this level. The in-plane speed of this propagating wave was estimated at 5mm/min.
Mean arterial blood pressure (MABP) steadily increased during the experiment (Table 1). The animal was removed from the scanner at approximately 3 hours after occlusion, all catheters were removed and the animal moved to a recovery area. However the animal did not regain consciousness after anesthetic recovery, and subsequently died at approximately 9 hours post MCAO. Post mortem examination of the brain revealed ipsilateral subarachnoid hemorrhage, likely the cause of death.
Physiological parameters recorded
| Baseline | Surgery | Post-Occlusion | |
|---|---|---|---|
| MABP (mmHg) | 59±7 | 88± 9 | 92± 14 |
| HR | 133±5 | 108± 5 | 116± 12 |
DISCUSSION
This work provides, to our knowledge, the first demonstration of spreading peri-infarct depressions by dynamic MRI in a higher primate brain. The pattern of propagating diffusion changes through ‘uninvolved’ peri-infarct brain initiated at the point of stroke induction mirrors previous observations following embolic stroke in rats [22]. In the rat, multiple spontaneous PIDs may be detected within the first 3-6 hours after stroke, however in the current study we did not detect any additional spontaneous PIDs, likely because of the limited sampling window of up to 17 minutes post occlusion. In addition, the PID wave detected in our study occurred in brain contralateral to the main infarct, though apparently initiated by an area of focal ischemia in the contralateral superior brain; in agreement with literature results suggesting that CSD waves do not cross the midline [22]. While the perfusion experiment using H217O confirmed that the MCA segment containing the microcatheter supplied only ipsilateral brain, it is likely that manual injection of the more viscous glue solution resulted in some retrograde flow within the MCA, thus permitting a fraction of the glue embolus to flow via the circle of Willis into the contralateral circulation, inducing areas of focal ischemia there.
While CSD in normal rodent brain can be easily initiated, as described earlier, imaging and electrophysiological data has shown that it is difficult to elicit in macaques [23], suggesting that the role of CSD in higher primates may be different from that in rodents. A serial diffusion MRI study in acute stroke patients [24] also failed to demonstrate PIDs, although it is likely that any transients were missed due to the limited sampling duration of the scans (15 minutes) and the late onset of imaging after stroke initiation (median 9.7 hours). The data presented here, though in a single animal, confirms that PIDs can occur in higher nonhuman primates, although more data is needed to confirm a link with infarct expansion.
Our MRI data in macaques is consistent with recent human data in cases of acute cerebral ischemia resulting from subarachnoid hemorrhage. The occurrence of CSDs in the periphery of the damaged cortex in human patients with traumatic brain injury, intracranial or subarachnoid hemorrhage, hematomas have been demonstrated in electrocorticographic (EcoG) studies [25, 26]. Recurrent clusters of spreading depression have been described in patients with subarachnoid hemorrhage and it has been reported that they are early indicators of delayed ischemic brain damage [27, 28]. In particular, Dreier et al. [27] recorded EcoG for periods of 1-10 days, beginning between 0.5 and 2 days after surgery (cranial opening) for subarachnoid hemorrhage and reported that clusters of spreading depressions with depression periods increasing to 60-90 minutes often predicted delayed infarction.
We estimated a propagation speed for the detected PID wave of approximately 5mm/min in the most superior slice. This slice was selected for the measurement because the propagation direction of the SD wave was clearly defined. However many voxels in this slice likely contain a mixture of both gray and white matter, as suggested by comparison with the (much thinner slice) anatomical SPGR image at the same level (Fig. 4A, which has good gray/white contrast). Assuming the PID wave travels only in the convoluted gray matter strip, the true propagation distance between the ROIs measured in Fig. 4B is likely longer than the linear in-plane separation of the measurements. Thus our measured propagation speed may have been slightly underestimated. Nevertheless this propagation speed is not dissimilar to 3.3mm/min reported using similar MRI methodology for CSD in normal rodent brain [14]. In addition, Fabicus et al [25] measured an average CSD speed of 3.3 mm/min using a single electrode strip while Dreier et al [27] (2-6 electrode strips) measured a rate of about 2 mm/min. One must bear in mind however that unidirectional electrode arrays can only measure one component of the velocity (thus likely to underestimate the true speed) while MRI has the potential to characterize the CSD wave in 3 dimensions.
This work shows that large signal changes in perfused brain tissue are detectable after an injection of a small volume of fairly low enrichment (20%) 17O water using intra-arterial delivery. The relatively high local concentrations thus achievable allow quantitative CBF measurements which may prove useful during neurointerventional procedures to assess and treat ischemic infarctions as well as monitoring intra-arterial delivery of pharmaceutical compounds to the brain [19]. Oxygen-17 water is safe and offers the potential for more accurate CBF quantitation than the more common bolus tracking approach using Gadolinium agents. The tracer kinetics of Oxygen-17 injection can be modeled, employing a single-tissue compartment model [18, 20] and cerebral blood flow (CBF) and mean transit times (MTT) can be determined [29]. In these studies we were able to map out the volume of the MCA territory perfused by the microcatheter which showed close correspondence to region of decreased ADC.
CONCLUSIONS
Dynamic diffusion MRI is well suited for 3D visualization of hyperacute stroke formation and peri-infarct spreading depressions in primate brain. The detection of PIDs following embolic stroke in a higher nonhuman primate brain supports the hypothesis that spreading depressions may occur following occlusive stroke in humans. In addition, we have demonstrated the feasibility of arterial injection of Oxygen-17 enriched water as a freely diffusible MRI tracer to map regional cerebral perfusion.
ACKNOWLEDGEMENTS
We would like to acknowledge other members of the experimental team who assisted with the generation of the original MRI datasets; Drs. J. Pryor, Y. Liu, M. Duggan, J. He. We are also grateful for support from the N.I.H. (1R01-NS41285, P41RR14075) and American Heart Association (Established Investigator Award).

