All published articles of this journal are available on ScienceDirect.

Methods for Fine Scale Functional Imaging of Tactile Motion in Human and Nonhuman Primates
Authors Info & Affiliations
Abstract
In the visual and auditory systems specialized neural pathways use motion cues to track object motion and self-motion, and use differential motion cues for figure-ground segregation. To examine the neural circuits that encode motion in the somatosensory system, we have developed neuroimaging methods to study motion processing in human and nonhuman primates. We have implemented stimulus presentation paradigms to examine neural encoding of apparent motion percepts. These paradigms are designed to be compatible with fMRI, optical imaging, and electrophysiological methods, thereby permitting direct comparison of data derived across neurofunctional scales. An additional motivation for using a common tactile motion stimulation paradigm is to bridge two disparate bodies of work, that derived from neuroimaging studies in humans and another from neuroimaging, neurophysiological and neuroanatomical studies in monkeys. Here, we demonstrate that such an approach through the use of optical imaging and 9.4 Tesla fMRI experiments in monkeys, and 7 Tesla fMRI experiments in humans is effective in revealing neural regions activated by tactile motion stimuli. These methods span spatial scales capable of detecting 100 μm sized domains to those that would reveal global whole brain circuits. Armed with such capabilities, our long-term goals are to identify directionally selective areas and directionally se-lective functional domains and understand the global pathways within which they reside. Such knowledge would have great impact on our thinking regarding not only tactile motion processing, but also general strategies underlying somatosensory cortical processing.
INTRODUCTION
Primary somatosensory cortex (S1) is known not only to contain somatotopic representations of the body surface, but also to have critical roles in the perception of touch and proprioception [1]. However, in contrast to studies in the visual system, only a few studies have investigated the neural representation of motion in the somatosensory system [2-7]. Here, we present a multidimensional approach for studying motion processing in somatosensory cortex. Our approach is a comparative one, and includes high-resolution fMRI mapping in both human and nonhuman primates, complemented by invasive imaging and electrophysiological studies. Such an approach will disclose neuronal circuits involved in the perception of tactile motion and potentially reveal the contributions tactile motion has in multisensory areas [8-12] in the generation of world and body frames of reference [13]. Our motivations for this approach are two-fold. First, by directly relating findings collected with different imaging techniques, we hope to utilize the advantages of one technique while minimizing the limitations of another technique. Second, by directly comparing human and nonhuman primate data, we aim to bridge a large literature in monkey physiology with that in human imaging and perception.
Both OIS (optical imaging of intrinsic signals) and fMRI (functional magnetic resonance imaging) methods offer distinct advantages. Studying the activity of neural ensembles in vivo with submillimeter resolution has largely fallen in the domain of OIS. The OIS method uses a camera to record minute changes in light absorption or fluorescence that accompany changes in cortical activity [14, 15]. With red light illumination an initial 2 to 3 second change in cortical reflectance correlates with early deoxygenation of tissue that occurs in response to neuronal activation. In our laboratory, OIS has detected cortical activations in areas 3b and 1 to finger pad stimulation in anesthetized and awake squirrel monkeys [16-22]. The areas of digit tip activation are about 1 mm in size, organized topographically, consistent with electrophysiological maps [23], and supports the notion that hemodynamic signals can correspond spatially to local neuronal activity and reveal 100 μm sized structures [20, 24-36]. However, one important drawback of OIS is that it only reveals organizations of functional areas that are on the surface of the brain (the cerebral cortex) and does not readily image deep structures (such as cortical areas buried in sulci or subcortical structures).
The advantage of fMRI, in both humans and animals, is its ability to measure hemodynamic changes non-invasively from areas as large as entire brain networks to areas as small as cortical columns. This approach is based on measuring neuronal activity-related changes in blood oxygenation level dependent (BOLD) signals. At 9.4 Tesla (T) in anesthetized squirrel monkeys we have demonstrated the ability to detect BOLD signal changes in somatosensory cortical areas (areas 3b and 1) that showed excellent agreement with maps derived from electrophysiological and OIS methods [20, 37]. These studies and others have demonstrated that high-field fMRI can resolve submillimeter functional organization in the central nervous system (CNS) [20, 38-48]. High MRI field (e.g. 7 T) imaging also promises to provide high spatial resolution mapping in humans [49], where we reliably generate millimeter-scaled maps of SI [50].
Our experimental design with respect to studies in tactile motion takes advantage of an apparent motion percept induced by sequentially presented taps across the skin. To identify somatosensory areas involved in tactile motion processing, we compare activations obtained in response to this sequential motion stimulus with those in response to simultaneously presented taps, a stimulus that induces no motion percept. In this study, an apparent motion tactile stimulus was used in OIS and 9.4 T fMRI experiments in anesthetized squirrel monkeys and fMRI experiments at 7 T in awake humans. Our goals are to characterize and identify the spatial location of areas within SI (e.g. areas 3b, 1, or 2) responsive to tactile motion, and potentially identify functional domains within each of these areas that might be motion-selective. Our combined methodological approach is aimed at bridging the realms of neuronal responses and identifying cortical intra-areal functional domain preferences as it pertains, in this case, to tactile motion perception.
MATERIALS AND METHODS
Below is a concise summary of the methods along with highlights of critical steps and recent changes in our protocols. Details of our IOS and fMRI procedures for non-human primates have been described in detail in previous publications [17, 20, 22, 50]. All procedures were in compliance with and approved by the Institutional Animal Care and Use Committee. All subjects gave informed consent in accordance with a protocol approved by the Vanderbilt University Institutional Review Board.
Animal Preparation
For fMRI experiments squirrel monkeys (n=3) were anesthetized with isoflurane (0.5–1.1%) delivered in a 30:70 O2:N2O mixture, mechanically ventilated, and placed in a custom-designed magnetic resonance (MR) compatible cradle with the head secured with ear and head bars. Vital signs including SpO2, heart rate (Nonin, Plymouth, MN), ECG, ETCO2 (Surgivet, Waukesha, WI), respiratory pattern (SA instruments, Stony Brook, NY) and rectal temperature (SA instruments) were monitored throughout the procedure. Body temperature was maintained between 37.0-38.5o C via a circulating water pump and water blanket (Gaymar Industries, Orchard Park, NY).
The same preparation (3 different squirrel monkeys) and monitoring procedures were used in the OIS experiments. However, in the OIS experiments isoflurane (0.9–1.3%) was delivered by pure oxygen. After a craniotomy/durotomy, the primary somatosensory cortex (areas 3b and 1 within SI cortex) was exposed and identified by blood vessel landmarks and electrophysiological recordings. While we typically perform repeated OIS through a chronic chamber [16, 19], we have observed that squirrel monkeys recover and image fairly well with repeated craniotomies and durotomies over the same area of cortex if imaging sessions are separated by at least 2 weeks.
Tactile Stimuli and Stimulus Presentation
For anesthetized monkeys, fingers were secured by gluing small pegs to the fingernails and fixing these pegs firmly in plasticine, leaving the glabrous surfaces available for vibrotactile stimulation. Vibrotactile stimuli (Fig. 1A) were delivered to the glabrous skin by indentation of plastic probes (2 mm diameter) mounted on piezoceramic actuators (Noliac, Kvistgaard, Denmark) that were driven by Grass 88 and S11 stimulators (Grass-Telefactor, West Warwick, RI).. For functional somatotopic mapping of the distal finger pads, a probe was indented 0.48 mm (pulse duration 30 ms) at a rate of 8 Hz. During rest or a blank condition, each probe was lightly touching the skin. To identify somatosensory areas involved in tactile motion processing, apparent motion stimuli (Fig. 2A) consisted of a series of taps presented in opposite spatiotemporal sequences (1 and 2) to 3 or 4 adjacent distal finger pads. Simultaneous taps of all the digits that induced no motion percept, and a no stimulus condition (blank) served as controls.
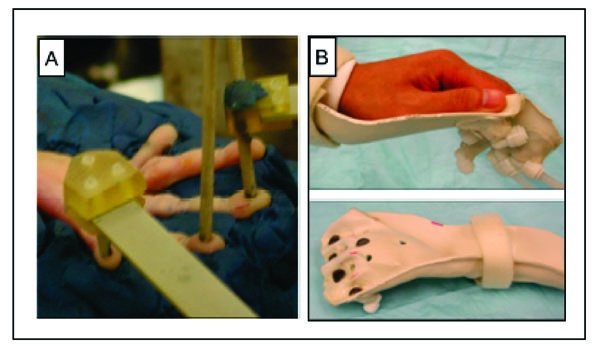
Stimulation methods used for imaging primary somatosensory cortex (SI). A. Piezoceramic stimulators are positioned on the finger pads of a hand secured in plasticine. B. Hand cast is used for air puff stimulation in humans. Bottom. Air displaces stretchable fabric (blue circles) that generates a pressure sensation.
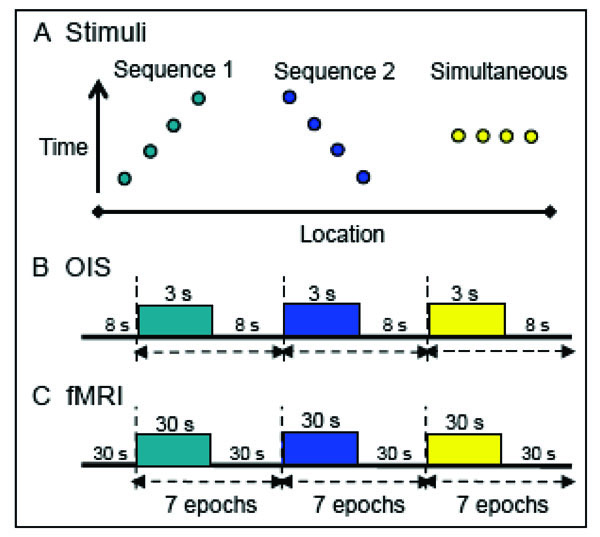
Stimulus presentation paradigms. A. Apparent motion stimuli consisted of a series of taps presented in opposite temporal sequences (1 and 2) to 3 or 4 sites on the fingers; control stimuli entailed simultaneous taps to all the fingers.. Y-axis: time; x-axis: location. B. For OIS, apparent motion stimuli, generated by the piezoceramics, were presented in 3 sec blocks at a rate of 1.5 Hz. The tap of a piezoceramic was 50 ms in duration. Each block contained 5 repeats of a vibrotactile sequence. Interstimulus interval: 8 sec. C. FMRI apparent motion sequences were presented in 7 epochs of 30 or 24 sec blocks with an interstimulus interval of 30 sec. For 9.4 T MRI imaging, piezoceramic stimulation was the same as in OIS except 44 repeats (30 sec) were presented per block. For human 7 T fMRI puffed air sequences were presented at a rate of 1.5 Hz with 35 repeats (24 sec). Each air puff pulse was 100 ms in duration. For an apparent motion sequence the interpulse interval of the air puffs was zero.
Apparent motion stimuli for OIS (Fig. 2B) were presented in 3 sec blocks. Each block contained 5 repeats of a vibrotactile sequence, presented at a rate of 1.5 Hz. The tap duration was 50 ms with an interpulse interval of 0 ms. Interstimulus intervals were between 8 to 10 sec. For fMRI imaging at 9.4 T, stimulus conditions (Fig. 2C) were the same as in OIS experiments except that 44 repeats (in 30 s duration) of each stimulus were presented per block separated by 30 sec interblock intervals. Each stimulus condition was repeated 7-9 times within one run, and multiple imaging runs were performed within one imaging session.
A functional imaging session typically lasts about 3 to 4 hours, so the functional images acquired within the same experiment could be a couple of hours apart. As the BOLD signal is sensitive to the physiology of the animal (pCO2 [51-54] and blood pressure (BP) [55, 56], and to the type and level of anesthesia [44, 57, 58], we continuously monitor and maintain a tight control of the physiology (ETCO2, HR, temp, respiration rate) of an animal during imaging in order to obtain stable BOLD responses. To illustrate, plots of vital signs from an animal during a functional scan are shown in Fig. (4). With a stable animal at 9.4 T, we are able to obtain replicable activation maps across runs, and between experimental sessions in the same animal [37]. This stability provides us opportunities to compare several different stimulus conditions within an animal in an experimental session, or more, if functional maps are evaluated across sessions.
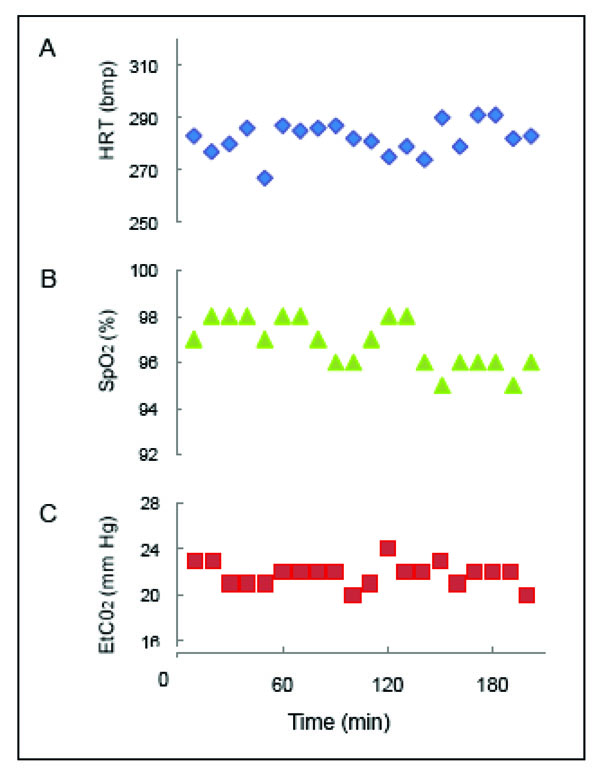
Vital signs during an anesthetized fMRI experiment. A. Heart rate (HRT) in beats per minute (bpm). B. Saturation of peripheral oxygen' (Sp02) in percent. C. End-tidal carbon dioxide (ETCO2) in mm mercury (mm Hg). Readings were recorded every 10 min during the 3 hr and 20 min session in the 9.4 T magnet.
For human imaging at 7 T, apparent motion stimuli were produced by air puffs (Fig. 1B) instead of piezoceramic actuators. The air puffs displaced a stretchable fabric that fitted across holes in a hand cast allowing for restricted skin displacement to an air puff. Velcro straps were used to secure the wrist and hand. For somatotopic mapping individual digits were stimulated with a 100 ms in duration air puff at a rate of 2 Hz. Apparent motion stimuli were presented at a rate of 1.5 Hz, in blocks (24 sec duration) of 35 repeats, and with an interpulse interval of 0 ms. We applied air puff stimulation in humans for 2 reasons. The first reason was the time constraint of human studies (~1.5 hrs). The implementation of air puff stimulation on a subject was quicker and easier than positioning of piezoceramic actuators, which outweighed potential issues of switching mechanical stimuli. The second reason was that certain fMRI sequences undesirably activated the piezoceramic actuators, which introduced artificial confounds.
We chose different stimulus and interstimulus durations for OIS and fMRI experiments based on the differences in their temporal signal profiles. With 630 nm light, the intrinsic signal that is related to changes in oxy/deoxyhemoglobin concentration occurs and peaks within the first 3-4 sec after stimulus onset and returns to baseline. In contrast, the BOLD signal, which is related to change a series of hemodynamic changes, is temporally delayed and returns to baseline with a much slower rate than OIS signals. Because of the slow temporal profile of BOLD signal and the mapping purpose of this study, we used block designs to delineate activation foci. We have yet to implement an event-related fMRI experimental design, which would so parallel our optical imaging paradigm.
MRI Data Acquisition and Analysis in Animals
All animal scans were performed on a 9.4 T 21-cm narrow-bore Varian Inova MR system (Fig. 3A, Varian, Palo Alto, CA) using a 3 cm surface transmit-receive coil positioned over the contralateral SI cortex of the stimulated hand. Scout images using a fast gradient-echo sequence were used to plan oblique slices covering somatosensory cortical areas for structural and functional studies. Three high resolution T2*-weighted gradient echo structural images (Fig. 3B, repetition time (TR), 200 ms; echo time (TE), 14 ms, 512 x 512 matrix; 78 x 78 x 2000 μm3 resolution) were acquired to visualize venous and transcortical veins on the cortical surface. Identification of the central and lateral sulci (Fig. 3C, D) were used to locate SI cortex and provide structural features for coregistration of MRI maps obtained across imaging sessions conducted on different days on the same animal, and for coregistration of MRI and OIS maps. Details on the alignment procedures were described in prior publications [20, 37]. FMRI data were acquired using a gradient echo planar (GE-EPI) sequence (TE=16 ms, flip angle = 70°, 64 x 64 matrix; 0.547 x 0.547 x 2 mm3 resolution). The TR of 1.5 or 2.0 sec on individual scans was adjusted to match the ventilation rate of the animal to minimize respiration-induced signal variations the time course in BOLD signal.
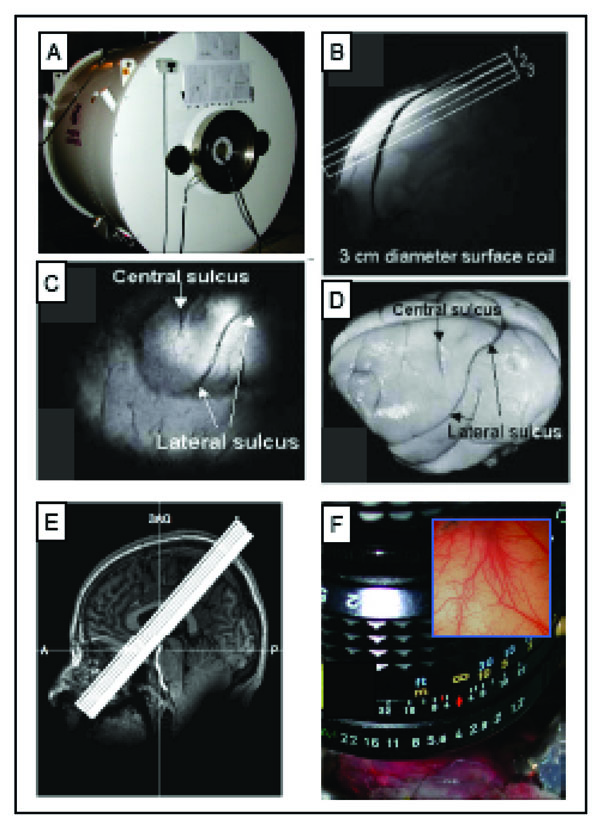
Methods used for imaging the primary somatosensory cortex (SI). A. 9.4 T MRI imaging with a 21-cm bore Varian Inova MR system (Varian, Palo Alto, CA). B. A high-resolution scout coronal image is collected to guide, parallel to SI, placement of three oblique slices (slice locations indicated by white overlaid rectangles). C. The most superficial slice image acquired with T2* weighting, where sulci and vascular structures appear dark, allow ready identification of both the central and lateral sulci (white arrows). D. Major landmarks (such as central and lateral sulci) used to identify SI are visible on the surface of post-mortem squirrel monkey brain. E. 7 T Philips Achieva magnet with a 16-channel NOVA head coil is used to collect oblique coronal image slices. Sixteen oblique coronal images slices were positioned to cover SI, SII, posterior insula and thalamus. A = anterior, P = posterior, SAG = sagittal. F. Intrinsic optical imaging with 632 nm light. An optical window made with agar and a slide coverslip covers a craniotomy. Inset illustrates a typical field of view of 6x6 mm2 of SI cortex.
Reconstructed images were imported into Matlab (Mathworks, Natick, MA) for analysis. The time courses of the EPI data were drift corrected using a linear model fitted to each time course and temporally smoothed with a low-pass filter with a cut-off frequency of 0.25 Hz. No spatial smoothing was applied in order to preserve the highest resolution possible. A voxel-wise correlation of the BOLD time course to a boxcar predictor (delayed by 2 image volumes to compensate for the hemodynamic response delay) was calculated, and functional activation maps were generated by identifying voxels whose correlation were significant at p ≤ 10-4 (uncorrected for multiple comparisons), unless otherwise stated. This threshold provides repeatable activation in SI cortex at 9.4 T [37, 59]. Activation maps were linearly interpolated to the native resolution (512 x 512 matrix), and overlaid on high-resolution structural images for display. The time course and amplitude of BOLD signal changes were calculated at multiple spatially distinct regions of interest, which were defined by their locations on the average activation map for each stimulus condition within a session. To assess the level of uncorrelated fluctuations in BOLD signal, control ROIs were randomly selected from nearby cortical areas that showed no significant positive or negative BOLD signal changes across runs.
Optical Image Acquisition and Analysis
Optical images were collected using an Imager 3001 system (Optical Imaging, Germantown, NY) with 630 nm illumination (Fig. 3F). A blood-vessel map, used for landmark purposes, was collected with 570 nm illumination. In blocks of trials, stimuli (3 sec duration) were presented in a randomly interleaved manner. Thirty trials were collected per stimulus condition. Intrinsic signal maps were collected at five image frames per second for 3 sec starting 200 ms before stimulus onset. Interstimulus intervals were 8 sec. For each stimulus condition, all trials were summed to maximize signal-to-noise ratio. Single-condition activation maps were obtained by subtracting individual frames from either the first frame image (baseline image before stimulus onset) obtained from each given vibrotactile stimulus or frames collected during the no-stimulus condition.
Microelectrode Electrophysiological Mapping
After optical imaging, electrophysiological mapping and anatomical landmarks were used to confirm the finger pad regions of SI. As expected, area 3b was found slightly posterior to the central sulcus (e.g. see Fig. 5J) and identified by units having small receptive fields (restricted to a single finger) and a brisk responsive to light touch. Area 1 was identified by being posterior to area 3b, by the representations of the distal finger pads in area 3b and area 1 being separated by the representations of the middle phalanges and palm, and by area 1 units having cutaneous receptive fields that can cover more than one finger. The lateral to medial somatotopic organization of digits D1-D5 was also used as defining features of areas 3b and 1. A functional border between areas 3b and 1 was estimated based on these distinctions [17, 18, 21, 23]. In contrast, forming a tip to tip organization the area 3a/3b border and area 1/2 border were characterized by a change in unit activation, where units with small receptive fields and responses to light touch switch to units with amorphous receptive fields that respond predominantly to deep pressure and/or joint movement [1]. Acquiring detailed electrophysiological maps of SI complemented and assisted the interpreting of the functional images acquired in response to tactile motion.
MRI Data Acquisition and Analysis in Humans
For the preliminary studies on tactile motion, two healthy human subjects (1 man and 1 woman) were scanned on a 7 T Philips Achieva magnet (Royal Philips Electronics, Amsterdam, The Netherlands) with a 16-channel NOVA head coil (Nova Medical, Inc, Wilmington, MA). Structural images were collected using a three-dimensional fast field echo (3D-FFE) sequence, TR = 3.7 ms, TE = 1.8 ms, and TI = 1300 ms, with a 1 x 1 x 1 mm3 voxel resolution. Functional images were acquired using a gradient-echo echo-planar imaging (GE-EPI) sequence, TR = 2000 ms, TE = 25 ms, flip angle = 80°, and a 192 x 192 field of view (FOV). The voxel resolution was 1 x 1 x 2 mm3. Sixteen oblique coronal slices (0 mm gap thickness) were acquired covering the central sulcus (SI), posterior portion of the lateral sulcus (SII, posterior insula, and surrounding areas) and thalamus (Fig. 3E). A SENSE acceleration factor of 3 and volume selective 2nd and 3rd order shimming using a pencil-beam method were employed. For distortion correction purpose, a B0 field-map was obtained at the start of scanning [60].
In a human apparent motion imaging run we interleaved the 3 different stimulation blocks with replication, with each run lasting around 7 min. Within a 1.5-hour scan session, we typically collected 8-10 imaging runs. We found that instructing a subject to attend to the tactile stimulus while laying in the magnet improved BOLD signal quality.
Following standard procedures data preprocessing and statistical analyses were conducted in BrainVoyager QX (Brain Innovation B.V., Maastricht, The Netherlands), as we have recently published [50]. All EPI images were distortion corrected using a B0 field-map before inputting files into BV. Preprocessing included slice scan time correction using a cubic spline, 3D motion correction, and slice alignment using intra-session registration. BOLD signals were temporally filtered with linear trend removal and 0.007 Hz high-pass filtering. The functional EPI images were interpolated into 1 x 1 x 1 mm3 voxels and overlaid on structural images for visualization. To preserve the high spatial resolution, spatial smoothing of the functional images was not applied. To correlate our findings with previous studies around this region, structural and activation maps were transformed into Talairach space. Thus, activation clusters were presented in Talairach coordinates. A general linear model (GLM) was fitted to the data and t-maps were created. Single condition activity maps (e.g. DA – Rest) were examined. Individual subject maps were thresholded at q (false discovery rate (FDR)) < 0.001 with 20 voxels minimum per cluster. Raw time courses obtained from the peak 5 voxels (highest p or t values) of these ROIs were calculated and plotted in BV.
Identification of SI Cortex in Humans
SI cortex is directly posterior to the central sulcus (CS) and can be identified by the omega-shaped folding in the axial plane [61-64]. SI cortex also is divided into four cytoarchitecturally distinct subregions [65, 66]; however, without structural MRI landmarks and with intersubject variability in cortical geometry, it is difficult to accurately identify the location of SI subregions [67, 68]. We therefore use the guidelines put forth by Geyer et al., to delineate the boundaries between subregions within SI [67]. Thus, area 3a is located within the fundus of the CS, area 3b is located along the posterior bank of the CS, area 1 is located at the crest of the postcentral gyrus, and area 2 is located on the anterior bank of the postcentral sulcus [46, 67, 69-71].
RESULTS
Six squirrel monkeys (0.8 to 1.1 kg) and 2 human subjects were included in our studies on tactile motion. Representative functional images from 2 squirrel monkeys and 1 human subject are shown in the figures.
OIS Imaging of the Topographic Organization of Somatosensory Areas 3b and 1
After brief electrophysiological mapping to identify areas 3b and 1, an OIS run was performed to define digit topography and evaluate the quality of functional images, as shown in Fig. (5), which included stimulation conditions where D1 through D4 were individually tapped (Fig. 5A-D) and where no digits were tapped generating a Blank condition (Fig. 5E). The imaging field of view was centered over area 3b as shown by the blue rectangle in Fig. (5J). After first frame subtraction, that sets the background level of reflectance to an even gray, OIS maps to single-digit activation showed the topographical organization of the digit activations in area 3b. Activation areas, where activation is indicated by darkening, showed in Fig. (5A) a D1 activation region that was located laterally in the field of view and medial to a dark crossing vein that forms an anatomical border between the hand and face regions. D2 activation (Fig. 5B) was found just medial to D1 activation (Fig. 5A), and D3 (Fig. 5C) activation was located just medial to D2 (Fig. 5B). There appeared to be some activation overlap between D3 and D4 (Fig. 5C, D); however, most of that overlap was a consequence of signal contributions from large arteries and veins running along the central sulcus (as shown nicely in Fig. 5A). In this particular case, we did not observe strong OIS activation in area 1; however there was some activation to D2 (Fig. 5B) and D4 (Fig. 5D) stimulation posterior to area 3b in area 1. Observing only weak activation in area 1 is common in anesthetized animals. The even gray shown in Fig. (5), the blank condition, confirms that the activations were stimulus dependent. The lateral to medial progression of D1 to D4 activation corresponded to the known somatotopy (Fig. 5F) and the electrophysiological map (Fig. 5J).
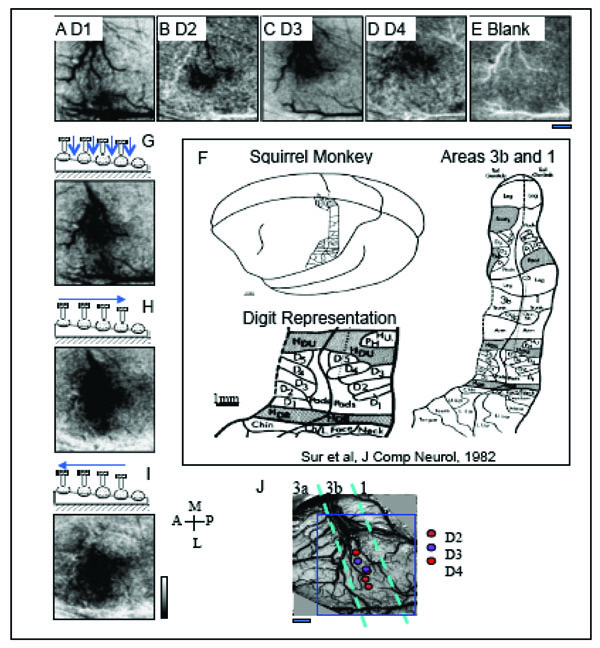
OIS activations to taps to distal finger pads and to sequential taps across digits generating apparent motion. Activation maps, where a darkening indicates activation, to mechanical taps of D1 (A), D2 (B) and D3 (C) and D4 (D) reveal the lateral to medial topography in SI of different digits in area 3b. E. Map to a Blank, no stimulation condition. F. Schematic illustration of the cortical somatotopy of the body and hand in areas 3b and 1 in squirrel monkeys based on electrophysiology [23]. Activation maps to (G) simultaneous stimulation of the finger pads, and sequential (H) medial to lateral (D1 to D4) and (I) lateral to medial apparent motion. Note that the distinct spatial temporal patterns of stimulation (G-I) produce different patterns of activation even though the number of taps and the sites of stimulation are identical across conditions. J. Electrophysiologically defined somatotopic map of the digit tips in this field of view. Receptive fields were characteristic of area 3b. Color-coded circles indicate receptive field location of each penetration site. Dashed aqua blue bars represent the estimated areal borders between areas 3a, 3b and 1. In this case, only some hints of OIS activation is apparent in area 1. Blue rectangle outlines field of view of OIS maps (A-E, G-I). Scale bar under (E) represents 1 mm scale bar for the field of view. A=anterior, P = posterior, M = medial, L = lateral. Image maps were clipped at 2 standard deviations. Low pass filtered with a 2 pixel Gaussian kernel.
OIS images of Simultaneous Multidigit Stimulation and Apparent Motion Stimuli
Simultaneous stimulation of all 4 distal finger pads (D1-D4, Fig. 5G) produced activation that was centered over the D3 representation (Fig. 5C). In contrast to a linear summation of maps of D1-D4 activation (Fig. 5A-D), the OIS map to simultaneous stimulation of D1-D4 (Fig. 5G) showed potentially reduced signal within areas corresponding to D1 and D2 representation. This sublinear summation could be analogous to what we previously reported regarding funneled cortical activation in response to paired digit stimulation in area 3b [72]. The relatively reduced activation to the simultaneous stimulation of all 4 digits could be due to a similar funneling response to the stimulation of multiple sites.
Sequential stimulation of the 4 digits, in an orderly secession from D1 to D4 (Fig. 5H) or D4 to D1 (Fig. 5I) to form apparent motion stimuli, produced activation in the same areas as simultaneous multi-digit stimulation (Fig. 5G). However, there were some subtle differences. Sequential stimulation of the digits appeared to generate activation of greater intensity and size in area 3b (Fig. 5H, I) than simultaneous stimulation (Fig. 5G). There was also greater activation in area 1 to apparent motion stimulation (Fig. 5H, I) than to simultaneous stimulation of the 4 digits (Fig. 5G). Similar findings were observed in the 2 other cases. Unexpectedly, and not shown, subtraction maps contrasting D1 to D4 stimulation and D4 to D1 stimulation did not reveal cortical domains that were distinct and selectively active for motion in one direction verses the other. Motion selective domains were also lacking in subtraction maps contrasting the sequential stimulation and simultaneous stimulation conditions.
FMRI BOLD Activation Maps at 9.4 T to Single Digit and Apparent Motion Stimuli
To evaluate whether at 9.4 T tactile motion stimulation would evoke BOLD activations similar to OIS maps, cortical activations were mapped in areas 3b and 1 with identical stimuli and similar stimulus presentation paradigms as used for OIS. To maximize the mapping power, one 2 mm thick oblique image slice with an in-plane resolution of 547 x 547 μm2 was centered over the central sulcus (white arrows in Fig. 6A) so as to include SI cortex. In this oblique slice, large and medium-sized surface veins and the penetrating transcortical veins (small black dots) were clearly visible on the T2* weighted structural image.
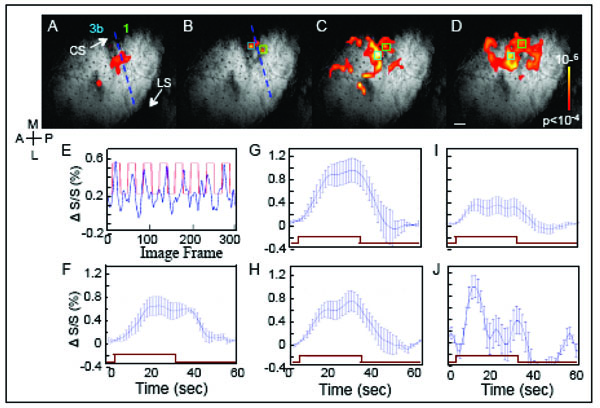
BOLD fMRI response to taps of distal finger pads. BOLD Activation maps to stimulation of (A) D2, (B) D3, (C) D2 & D3 & D4, simultaneously, and (D) D4 to D3 to D2, sequentially. Activation maps, overlaid on T2* anatomical images, were thresholded at p <0.0001 (uncorrected). Blue dashed lines in A and B indicate the estimated inter-areal border between areas 3b and 1. E. BOLD signal changes (%) derived from a single voxel in area 1 (green box in B) during D3 stimulation. Blue line shows the percent signal change over time. The red square-wave represents the timing of stimulus presentation. F. BOLD time course of E averaged across stimulation epochs. G and H. Average BOLD time courses to simultaneous D2 & D3 & D4 stimulation are shown for area 3b (G, blue box in C) and 1 (H, green box in C). I and J. Average BOLD time courses observed in response to sequential D2 & D3 & D4 stimulation in areas 3b (I, derived from light blue box in D) and 1 (J, derived from green box in D). Note the different ratios of activation between areas 3b and 1 during the simultaneous and motion stimuli. Error bars = 1 StDev. Brown rectangle indicates the time of stimulation. Scale bar = 1mm.
To functionally map the somatotopy in area 3b, initial runs examined the responses to single digit stimulation of D2, D3 (Fig. 6A, B) and D4 (not shown). In response to D2 stimulation (Fig. 6A), significantly activated voxels, thresholded at p < 0.0001 (uncorrected), were observed in area 3b. Brighter color indicates greater correlation significance (see color bar insert). In response to D3 taps, significant BOLD activation was observed in a location medial to D2 activation (Fig. 6B). Based on their anatomical locations, the anterior and posterior clusters of the significant voxels mark the D2 somatotopic location within areas 3b and 1. In response to D3 taps (Fig. 6B), activations were weaker in general; however, the activation foci were located in areas corresponding to the expected D3 representation location in areas 3b and 1.
A weak signal, for instance at the D3 location, could be a consequence of a number of factors. For one, noise from the nearby large vessels could contaminate the signal originating from the D3 cortical representation. Secondly, BOLD signal size also can be affected by a partial voxel effect. Partial voxel effects occur where only part of a voxel is activated by a stimulus. As the digit representation in cortex is on the order of 1 mm and our voxel sizes were 0.547 x 0.547 x 2 mm3, there is likelihood that partial voxel effect could reduce signals in certain voxels. Related to this issue is the alignment of the image plane to cortex. In the experiment, we did not observe D4 activation; the cause likely being that the D4 representation of cortex was outside of the prime imaging area. Given all these factors, still, in comparison to Figs. (5A-D, 6A and B) illustrated BOLD fMRI was capable of revealing digit maps akin to those observed with optical imaging.
In contrast to single digit taps (Fig. 6A, B), stimulation of all 3 digits (Fig. 6C, D) lead to a larger number of significantly activated voxels in areas 3b and 1 and in undefined cortical areas. Simultaneous stimulation of D2, D3 and D4 (Fig. 6C) elicited a distinctly larger area of activation in area 3b and area 1 as well as regions anterior. Larger numbers of significant voxels also were evoked by apparent motion stimulation (Fig. 6D), moving in the direction of D4 to D2, where a large number of voxels in area 1 and posterior were significant. Larger areas of activation to apparent motion stimuli, especially in area 1, were commonly observed in the other 2 cases (not shown). The maps showed that fMRI at 9.4 T revealed greater area 1 activation in response to multidigit and motion stimuli, as one might expect based on the receptive field properties of area 1 neurons.
BOLD Signal Time Course to Single Digit and Apparent Motion Stimuli
The temporal profile of the BOLD response was examined to see whether there were differences in the amplitude or time course of BOLD signals between stimulus conditions. At different cortical locations in areas 3b and 1, the amplitude of the BOLD response was measured by calculating the BOLD percent change from single voxels within the activation cluster as indicated by the colored boxes in Fig. (6B-D). As shown in the BOLD time course (Fig. 6E) from a single run during tapping of digit D3, increases in BOLD signal (blue line) occurred after stimulus onset (Fig. 6E, red square-wave indicates block durations). The robust increase in BOLD signal after stimulus onset supported the validity of the activation map to D3 stimulation (Fig. 6B).
To characterize the temporal profile of the BOLD signal to a stimulation block, average BOLD time courses were plotted. Fig. (6F) showed the averaged BOLD profile for the BOLD signal time course shown in Fig (6E). In response to D3 taps, the BOLD signal increased in amplitude over the first 10 s of stimulation, leveled off, and then returned to baseline after stimulus offset. The average signal amplitude peaked at around 0.6 %. Across different ROIs in areas 3b and 1 (Fig. 6F-H), the range of percentage BOLD signal changes (0.4-1%) was similar and comparable to the activations in our previous studies at 9.4 T [20, 37, 59].
Simultaneous stimulation of D2, D3 and D4 produced essentially equivalent average BOLD time courses for the ROIs in areas 3b (Fig 6G) and 1 (Fig 6H), except the amplitude of the BOLD signal was slightly larger in area 3b. The profiles of the BOLD time courses to simultaneous stimulation of the 3 digits also were similar to the BOLD time course to taps of individual digits (Fig 6F). In contrast, in response to apparent motion stimulation, two features of the average BOLD signal were noticeably different in area 1 (Fig. 6J) when compared to the response evoked in area 3b (Fig. 6I). First, the ROI in area 1 showed a large transient response to a block of stimulation whereas area 3b showed a sustained response to the block of motion taps. Second, the response peak was significantly larger for area 1, based on the amplitude difference between area 1 and area 3b and the standard deviations. Similar profiles of activation were observed in the other 2 cases (not shown). At times, we have observed in area 1 a transient profile of the BOLD response to non-motion stimuli. Further studies would be needed to discern whether the transient profile observed for motion stimuli was distinct from the transient responses we tend to observe in area 1, which we interpret as an indication of greater adaptation to trains of tactile stimuli in area 1 that parallel the response properties of individual neurons.
FMRI BOLD Response Related Tactile Apparent Motion Percept at 7 T in Humans
To address the question of whether tactile apparent motion stimulus evoked activations in areas 3b and 1 are also related to the apparent motion percept, BOLD activation was examined while a human subject was perceiving apparent motion in the 7 T magnet. As shown for one subject in Fig. (7), motion taps evoked clusters of activation in contralateral areas 3b and 1, and many other cortical areas. In Fig. (7A-C) BOLD correlation maps of apparent motion (thresholded at t = 6.4 (p<10-10) and a minimum voxel number of 20) were overlaid on the subject’s structural images in (Fig. 7A) axial (left hemisphere), (Fig. 7B) zoomed in axial, and (Fig. 7C) sagittal planes. The structural sections were cut through an activation cluster located along the posterior bank of central sulcus corresponding to area 3b, its location marked with white crosshairs (Fig. 7B, C). The correlation maps (Fig. 7A-C) illustrated not only focal activation clusters in area 3b (purple circle in Fig. 7B, C) and area 1 (green circle in Fig. 7C), located at the crest of the postcentral gyrus, but also showed in these image planes significant BOLD activation in a number of other cortical areas both contralateral and ipsilateral to the hand of stimulation.
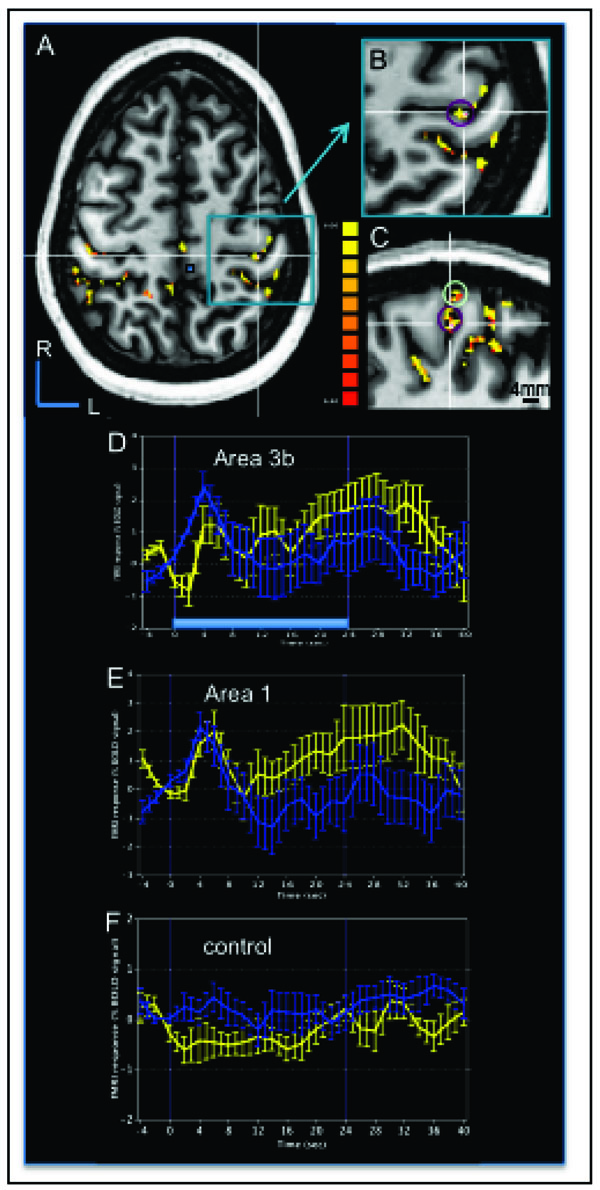
Human BOLD activation maps at 7 T to apparent motion stimuli. A. Correlation map to tactile motion (thresholded at p < 10-10 with cluster threshold of 20 voxels) evoked by air puffs presented to the right hand is overlaid on the subject’s structural image in the horizontal plane slicing through the SI hand area. R: rostral, L: left. B. Magnified view of area in the blue box in (A) showing the activation cluster (Tal x, y, z coordinates of -38, 28, 52) in contralateral area 3b (purple circle) used to generate a BOLD time course. C. Magnified sagittal plane view through the left hemisphere that sliced through the area 3b activation cluster in (B, white cross) that revealed activation clusters in area 3b (purple circle) and area 1 (light green circle). D-F. Average BOLD signals time course derived from the ROIs of area 3b (D), area 1 (E), and one control region (F, small blue box in A) during the apparent motion stimulus (blue curves) and simultaneous tapping stimulus (yellow curves). Time course was calculated from the top 15 voxels (with highest t values). Light blue bar in D represents stimulus duration of 24 sec. Error bars: standard errors. X-axis: time in sec. Y-axis: % BOLD signal change.
Average BOLD time courses (Fig. 7D-F) from the most significantly activated 15 voxels within each activation clusters in areas 3b area 1 and from a control cluster (solid blue box in Fig. 7A) showed the BOLD signal changes to tapping motion (blue lines with error bars) and simultaneous tapping stimulation of 3 adjacent digits (yellow lines). The comparison of the profiles shown in Fig. (7D-F) confirmed that the shape of the temporal profiles of the BOLD signals in both areas 3b (Fig. 7D) and 1 (Fig. 7E) were distinct from a control region (Fig. 7F). In areas 3b and 1, the stimulation of multiple digits evoked a transient response for both simultaneous and motion taps. The BOLD profiles were slightly different for the apparent motion (blue line) and simultaneous (yellow line) stimulation blocks. The apparent motion response appeared to peak (with a ~ 2% BOLD signal change) immediately after stimulus onset, and decline quickly even though the stimulus was still active (e.g. the light blue bar in Fig. (7D) at the bottom of the graph represents the block duration). In contrast, the simultaneous stimulus (yellow curve) evoked more of a sustained response after an initial transient response (~ 1% BOLD signal change) during the stimulus presentation period. In our second subject (not shown), we aligned our imaging plane to include visual association areas involved in motion perception and SII, and not SI. Therefore, we are unable at this time to confirm that the transient response observed in areas 3b and 1 to motion stimuli in a quiescent human subject is a distinguishing feature of the BOLD response to motion stimulation.
With respect to tactile motion imaging in humans at 7 T, at this juncture, the important point that can be made is that multiple activation clusters within one region (e.g. SI) that are difficult if not impossible to discern at lower field strength now can be studied readily at 7 T. Some of our other studies on SI somatotopy and the characterization of the pain network located around the Sylvian Fissure point more specifically to the utility of 7 T imaging in addressing questions of human sensory processing.
DISCUSSION
The present study presents a tractable approach to studying tactile motion using OIS and fMRI methods. These methods are capable of revealing activations across multiple cortical areas responsive to motion stimuli. With high-resolution functional imaging techniques submillimeter to millimeter sized functional structures in both humans and anesthetized monkeys can be identified in response to moving tactile stimuli. In anesthetized squirrel monkeys, these activations are seen within Brodmann areas 3b and 1 with both OIS and 9.4 T fMRI methods. In humans, mapping motion responses in a 7 T magnet revealed numerous clusters of activated voxels in areas directly posterior to the central sulcus, consistent with area 3b and area 1 locations as well as numerous other cortical areas. Future studies are needed to evaluate the relationship of tactile motion activations to existing vibrotactile functional domains, and to compare the relationship between real and apparent motion stimulus responses.
Imaging Functional Responses to Tactile Motion
A leading issue in somatosensory neuroscience is whether the somatosensory pathways, like the visual pathways, are composed of two primary pathways, one focused on object identification (visual ventral pathway) and one on sensation for action (dorsal pathway). Although a case can be made that while there are parallels in global cortical organization [73-75], in comparison to the visual pathways far less is known about the cortical hierarchy and internal functional organization in the somatosensory system. What parallels and what differences should we expect. Visual motion information is considered fundamentally necessary for the identification of object motion, the computation of self-motion, and for object identification (e.g. figure ground segregation). Directional selective responses, which are present in V1 and are mapped in V2 [76], are channeled to area MT, an area that is considered the ‘gateway’ to the dorsal pathway. MT is characterized by a prominence of directionally selective neurons that are organized into functionally organized directional columns, which when locally stimulated, can bias directional percepts and thus are behaviorally relevant functional structures [77, 78]. In contrast, in the ventral pathway, cells in V2 and V4 sensitive to motion direction contrast are hypothesized to contribute to figure-ground segregation and object identification.
Can similar distinctions be made in the somatosensory system? Recent studies suggest that such parallels may be possible. In SI, Hsiao and colleagues have shown that Area 1 is characterized by a strong complement of directionally selective neurons, a proportion significantly greater than that in Area 3b [7]. Based on this exciting observation, parallels have been drawn between area MT in the visual system and Area 1 in the somatosensory system. However, evidence for directional columns or possible functional organization for direction in SI is still lacking. Further lacking is localization of tactile motion processing stages and incorporation of these stages into distinct functional pathways in the somatosensory system. Considerable effort will need to be made in the study of tactile motion information processing in the somatosensory system. Methods must span spatial scales capable of detecting 100 μm sized domains to those that would reveal global whole brain circuits. Armed with such capabilities, our long-term goals are to identify directionally selective areas and directionally selective functional domains and understand the global pathways within which they reside. Such knowledge would have great impact on our thinking regarding not only tactile motion processing, but also general strategies of cortical motion processing.
Factors Contributing to the Reproducibility of High-field BOLD fMRI Maps
Several technical and biological factors can influence the run-to-run and session-to-session reproducibility and stability of BOLD maps. These include variation in image slice positioning, accuracy of image co-registration algorithms, image acquisition point spread functions (PSF) [79], contrast to noise ratio of the BOLD signal, and the animal’s physiological state across imaging sessions [44, 57]. In our previous study that specifically examined the reproducibility of fMRI BOLD at 9.4 T, anatomical and fine vascular landmarks were used for positioning the imaging slices and for subsequent coregistration of images across sessions. High resolution T2* weighted anatomical scans visualized the network of pial and even small transcortical veins, providing a rich set of landmarks for guiding slice planning and coregistration with sub-voxel accuracy [20, 80].
We believe that at least two biophysical factors increase the contrast to noise ratio at ultra-high field strengths that contributed to our ability to obtain GE-BOLD maps with submillimeter reproducibility. First, it is generally observed that draining veins are a significant part of the signal in fMRI maps collected using GE-BOLD fMRI at lower field strengths, which thereby limits spatial resolution [79, 81]. However at high field strengths the short T2, the time constant of signal decay of intravascular water, greatly reduces the signal from large and small vessels to the BOLD response [82]. Consequently, the detectability of focal tissue–level BOLD signals is less obscured or blurred by intravascular signals from draining vessels. At high MRI fields, there also is an increase in the amplitude of the BOLD signal, which allows for reduced voxel volumes. Thus, the increased spatial resolution available with high-field BOLD fMRI is attributable in part to the increased contrast to noise ratio, which allows reduced voxel volumes, and in part to the increased detectability of focal tissue–level BOLD signals not obscured or blurred by intravascular signals from draining vessels. Additionally, higher resolution and smaller voxel size could significantly reduce partial volume averaging effects, resulting in greater signal localization specificity.
Fine scale mapping at 7 T with attentive human subjects offers several distinct advantages for obtaining functional maps with millimeter reproducibility. Besides the important increase in amplitude of BOLD signals with awake subjects, we are able to utilize individual perceptual ratings as regressors [83]. A percept-related predictor can produce more stable and reproducible activation maps than physical stimulus based predictors [83]. The observed differences could be caused by perception variations across trials and subjects, and/or ‘uncontrolled’ cognitive or attentional modulatory effects during an imaging acquisition.
Although individual subject analysis can be accomplished at lower MRI field strengths [47], the greater signal sensitivity at 7 T provides other benefits as well. In a high-resolution fMRI experiment, typically, whole brain coverage is traded for high spatial resolution with partial brain volume coverage. Higher field strengths allow for whole brain coverage at higher spatial resolutions. Additionally, an increase in contrast to noise can result in a smaller need to average over as many acquisitions. In our study [50] BOLD activations, acquired in 24 s blocks of stimulation, were robust within individual subjects and runs, and were spatially reproducible across runs. Reliable BOLD signal in a single subject can be acquired in as little as 2 min 30 sec per stimulus, since our reproducibility analysis indicates that a scan time of only 2 min 24 sec is necessary to accurately map a single digit. This improvement could negate the need for more across-run averaging, ultimately reducing the total scan time to collect functional data. The across-run reproducibility as we demonstrated in our previous publication [50] implies 7 T imaging has a potential application in examining dynamic cortical changes within one imaging session in an individual subject, such as immediate plastic changes following a manipulation of the stimulus. Finally, the detection of subtle variations of digit representation could have significant potential for detecting small cortical changes in disease conditions such as plastic changes following spinal cord injury.
Technical Challenges of High Field BOLD fMRI
Ultra-high field fMRI in humans faces several challenges. The first is related to macroscopic field variations caused by increased inhomogeneities of magnetic susceptibility, which can introduce image distortion. The distortion is more apparent in human 7 T than 9.4 T animal EPI images. At 9.4, the surface coil and good shimming over a small brain volume (four 2 mm slices) contributed to the minimal distortion in EPI images. Secondly, the performance of radiofrequency (RF) coils is also affected at higher fields, and it is more difficult to create uniform RF fields within large objects (i.e. the human brain). To meet these challenges, we employed a set of parallel array coils (16 channels) in humans for data acquisition, reduced the imaging volume to partial brain coverage, and applied B0 distortion correction in data preprocessing. Additionally, we took extra efforts in defining the shim volume for each subject. With these approaches, the susceptibility problems in SI areas around the CS appear minimal. There is, however, some degree of signal drop in brain regions near air-tissue interfaces such as inferior temporal lobe. Other techniques such as dynamic shimming during functional scans for high-resolution fMRI studies are currently under development in our laboratory [49].
CONCLUSIONS
Because of the nature of the signal (measures changes in the blood oxygenation levels in microcirculation), OIS and fMRI measure the ensemble activity of heterogeneous neuronal populations. Because of its dominant relationship with deoxyhemoglobin concentration, OIS signals have a tighter relationship with neuronal electrical activity. Additionally, the superior spatial resolution of OIS (~100 μm) allows a precise mapping and quantification of cortical response to subtly different stimuli (e.g. apparent motion versus simultaneous stimuli). Furthermore, an accurate interpretation of these studies requires knowledge of the activity of the underlying cellular constituents. Such information is difficult, and indeed is often impossible to obtain in human subjects for both technical and ethical reasons, but can be acquired from animal studies. Particularly, fMRI studies on nonhuman primates would provide an important link between human and animal studies. A linear relationship between neural activity and the subsequent hemodynamic response as revealed by fMRI and OIS has been well documented. However, both positive correlations and dissociations between neuronal activity (firings of single and/or multiple units and local field potential) and functional signals have been reported [20, 24-34]. The degree of correlation has also been shown to differ across cortical areas. In sum, while OIS and BOLD signal can reflect neural activations quite well at a population level, neural activity measured with complementary multi-unit activity (MUA) and local field potentials (LFPs) provide additional and important information to imaging data. With high-resolution fMRI mapping in humans and monkeys, we will ultimately be able to correlate human perception with underlying neuronal, electrophysiological and neuroimaging data.
CONFLICIT OF INTEREST
None decleared.
ACKNOWLEDGEMENTS
We would like to thank Elizabeth Stringer for assistance on the human experiments, and Chaohui Tang and Lisa Chu for their excellent technical assistance on animal preparation. This work is supported by NIH grants DA024831 to LMC, EB000461 to JCG, and NS044375 to AWR and RMF.

