All published articles of this journal are available on ScienceDirect.

Functional PET Evaluation of the Photosensitive Baboon
1. INTRODUCTION
Epilepsy is a condition of recurrent, unprovoked seizures. Seizures are characterized by episodic changes in perception or behavior associated with an electrical discharge synchronizing large populations of cortical neurons. In humans, the epilepsies are diagnosed and classified by a clinical history provided by a patient or a witness (seizure description, etiological factors, response to treatment) combined with scalp electroencephalography (EEG) [1, 2]. As seizures are rarely recorded in brief EEG samples, clinicians rely on detection of interictal (between seizures) epileptic discharges, which can serve as markers for the seizure type. Epilepsies are classified mainly as localization-related, i.e. seizures beginning in one region of the brain, or generalized, i.e. seizures are associated with a simultaneous activation of both hemispheres. Because of developments in structural neuroimaging, and the growing experience associated with resective surgery for epilepsy, recent research was focused on the pathophysiology underlying localization-related epilepsies. Nonetheless, generalized epilepsies are diagnosed in almost half of people with epilepsy (www.epilepsyfoundation.org/about/statistics.cfm). With the development of animal models and improvements of functional neuroimaging, interest has resurfaced into the mechanisms underlying generalized epilepsies.
The baboon represents one of the natural animal models of generalized epilepsy [3]. All baboon subspecies exhibit spontaneous generalized myoclonic and tonic-clonic seizures, which occur predominantly in the morning or upon awakening [3-5]. The onset of the seizures occurs in adolescence or early adulthood. Seizures appear to be equally distributed among the sexes, and sex-specific age distributions are also similar. Early on, investigators recognized the association of this model with photosensitivity, i.e. the predisposition for visual stimuli, such as flickering lights, to elicit IEDs or seizures [6]. Photosensitivity was utilized to activate seizures in a laboratory setting, allowing the recording of the discharges or seizures with EEG using scalp and intracranial electrodes [6, 7]. Nevertheless, previous evaluation of this model was limited with respect to absence of neuroimaging, the framework for electroclinical classification, and neurosurgical techniques, relying solely on depth electrode recordings. Nonetheless, based upon these electroclinical features, the baboon provides an excellent model for one of the most common forms of generalized epilepsy syndrome in humans, namely juvenile myoclonic epilepsy [8].
The recent revival of the baboon as a model for photosensitive, generalized epilepsy, was inspired by the collaboration between researchers at the University of Texas Health Science Center in San Antonio (UTHSCSA) and at the Southwest National Primate Research Center (SNPRC) at the Southwest Foundation for Biomedical Research (SFBR) in San Antonio. Scalp EEG studies were performed in over 600 baboons in the pedigreed colony housed at the SNPRC [9]. These studies provide a database for animal selection for the imaging studies, and the EEG phenotypes will be utilized for genetic linkage studies. All of the EEG studies lasted for about one hour, and included repeated trials of ILS. The baboons were sedated with ketamine, which at low doses, similar to humans with a predisposition to epilepsy, can activate IEDs [10, 11] without suppressing the photoparoxysmal response [12].
Relying on the extensive background in functional positron emission tomography (PET) at the Research Imaging Institute of UTHSC at San Antonio, our goal was to map cerebral blood flow (CBF) changes at rest and during ILS using H215O-PET. The regional CBF changes would not only demonstrate connectivity of the visual pathways but also reflect those alterations of CBF associated with IEDs. The CBF maps can then be used to demonstrate the spatial distributions of activations and deactivations, and their directionality, eventually providing a target for intracranial electrode placement for electrophysiological monitoring. While H215O-PET is a reliable tool to image mildly sedated animals, as it is more lenient to motion artifact, including brief myoclonic seizures (in large part because the baboons are scanned after and not during ILS), its limitations compared to blood oxygen level dependent (BOLD) functional MRI is mainly its spatial and temporal resolution. Nonetheless, with the help of intracranial electrophysiological monitoring, we hope to prove whether CBF changes induced by ILS are related to a physiological connectivity or the generation or propagation of ictal or interictal epileptic discharges.
Our work in this field initially focused on subtraction studies comparing CBF at rest and during ILS in PS and CTL baboons, but later incorporated correlation analyses with particular attention directed toward the dose-dependent effects of ketamine, which similarly to the EEG studies was used to lightly sedate the baboons, and the rate of interictal epileptic discharges, subtraction analyses assessing ILS frequency-dependent changes and covariance analyses correlating CBF changes with activation of the occipital lobes during ILS. All of these approaches have been instrumental in the evaluation of physiological CBF changes and connectivity in CTL baboons and delineating the epileptic networks in PS animals.
2. PREVIOUS PET RESEARCH IN THE BABOON
Prior to the introduction of MRI, PET played a central role in the localization of an epileptic focus in localization-related epilepsy. Early applications in the baboon included H215O- , 18FDG- and radioligand PET [13-15]. 18FDG-PET was used in one study to evaluate metabolic changes associated experimentally-induced status epilepticus [13]. The authors found increased metabolism in the hemisphere ipsilateral to the intra-amygdalar kainic acid injection, suggesting that PET imaging can localize the seizure onset zone. Other studies evaluated the benzodiazepine receptor binding of an experimental GABAergic compound during the course of pentylenetetrazol induced generalized convulsive status epilepticus [14, 16]. Further developments in the temporal resolution of PET and MRI, as well as the ability to coregister the two modalities, revived the interest in H215O-PET [17, 18]. Although functional, blood oxygen level dependent (BOLD) MRI yields may yield better spatial and temporal resolution of cerebral blood flow (CBF) than PET, leading to its increased utilization as the preferred modality for functional mapping, PET retains important advantages in multimodal imaging.
3. FUNCTIONAL PET IN THE BABOON
3.1. Rationale
The epileptic baboon was one of the first natural animal models of epilepsy to be investigated. Early studies utilized its photosensitivity to activate interictal and ictal epileptic discharges in the laboratory. Scalp and intracranial EEG recordings provided the first insights about the generalized nature of the photoparoxysmal responses and spontaneous IEDs [6, 7, 19]. Intracranial electrophysiological recordings using depth electrodes indicated that spontaneous IEDs were maximally expressed in the motor and premotor cortices. In contrast to scalp EEG recordings in humans with photosensitive epilepsies, there was little to no evidence of epileptic activity generated by the occipital lobe during ILS, particularly in the primary visual cortices, leading investigators to assume that the physiological occipital driving response triggered IEDs in the frontal lobes. The intracranial recordings were limited to recordings with depth electrodes, which, even with precise stereotactic placement, only sparsely sample the cerebral cortex. Without anatomical proof of any direct connections between the visual and motor cortices [20, 21], later electrophysiological studies in baboons using paroxysmal visually evoked potentials (PVEP) and microelectrode recordings raised the possibility that the parietal lobes may be involved in the generation or propagation of photoparoxysmal responses [22-24]. Because of the growing interest in focal epilepsies, and the relative unavailability of the baboon, the electrophysiological studies were abandoned. The development of MRI and PET, however, provides a new approach to evaluate the physiological response to ILS in baboons, and identify potential targets for intracranial EEG studies. Among non-human primates, the baboon is one of the best models for neuroimaging because of its relatively large brain size and anatomy, which structurally resembles the human brain. Furthermore, due to the electroclinical similarities between the photosensitive generalized epilepsy of the baboons and juvenile myoclonic epilepsy, ILS-dependent activation of cortical-subcortical networks may be extrapolated to photosensitive generalized epilepsy in humans [4, 5].
H215O-PET provides an excellent, minimally invasive method for studying cerebral blood flow (CBF) changes in association with visual stimulation in normal individuals [25-28], it has been also implemented in the evaluation of photosensitivity in vivo [29]. While H215O-PET demonstrated increases in occipital CBF between in photosensitive subjects compared to healthy controls, CBF increases were minimal outside of the occipital lobes. Blood-oxygen level-dependent (BOLD) MRI studies demonstrated decreased CBF in the motor cortices of photosensitive individuals after brief visual stimuli [30]. When the BOLD analysis was restricted to those scans acquired during the photoparoxysmal responses, CBF increases were noted outside of the occipital lobes, particularly in the parietal regions, less consistently in the frontal regions [31]. Both H215O-PET and BOLD MRI take advantage of neurovascular coupling to deliver visuospatial representations of brief electrophysiological events. The metabolic demand of activated or discharging neurons leads to localized changes in CBF and cerebral blood volume [28]. The expected ILS-related increase in CBF allows the subtraction of resting from activation states. However, as resting CBF can be affected by the activation of IEDs or medications, each of these factors is taken into consideration in the interpretation of subtractions studies. Furthermore, in order to compensate for the shortfalls of the subtraction studies, H215O-PET evaluations will need to be complemented by analyses correlating CBF change with quantifiable EEG or CBF markers.
3.2. Methodology
The data presented for the subtraction and covariance studies includes 8 PS and 6 CTL baboons selected on the basis of EEG findings performed during the PET scans confirming the activation of ictal or interictal epileptic discharges during ILS [32]. The data for the analyses correlating CBF with ketamine dose and IED rate included 8 PS and 8 CTL animals selected on the basis of previous electroclinical classification and EEG findings during acquisition of the resting state PET scans. All of the baboons were females belonging to the Papio hamadryas anubis subspecies or were Papio hamadryas anubis/cynocephalus hybrids. The two groups were matched for age and weight, but the CTL baboons, that were slightly younger, required higher doses of ketamine to maintain the same level of sedation as the PS baboons. The baboons were treated in strict accordance with the U.S. Public Health Service’s Guide for the Care and Use of Laboratory Animals [33] and the Animal Welfare Act. This study was approved by the Institutional Animal Care and Use Committees of UTHSCSA and SFBR.
Ketamine Anesthesia
The baboons were sedated with an intramuscular injection of s-ketamine 5-6 mg/kg (KetaVed, Phoenix Scientific, St. Joseph, Missouri). They were removed from their squeeze cages and their scalp, shoulders and one leg were shaved. A catheter was placed in the saphenous vein. All animals received atropine 0.5 mg intramuscularly to reduce oropharyngeal secretions. EEG electrodes were affixed and the placement of soft restraints and facemask or Velcro straps fitted to limit head movement in the scanner, a continuous ketamine infusion (initially at 6 mg/kg/hr) was then started. The animals’ EEG, respiration and movement were monitored continuously. The ketamine infusion rate was adjusted by increments of 0.25-0.5 mg/kg/hr in order optimize sedation. The ketamine dose was lowered if a baboon demonstrated tonic motor activity or a suppressed background on EEG, or increased if the baboon demonstrated voluntary movements. The ketamine dose required for sedation was significantly higher in CTL than PS baboons.
PET Scans
Dynamic PET images were acquired on a CTI/Siemens HR+ scanner (Siemens, Munich, Germany; 63 contiguous slices, 2.4 mm thickness, 12 frames of 10 seconds each) in 3D mode. Transmission scans were performed for attenuation correction. Five CBF measurements were acquired in each animal. The first, third and fifth scans measured resting CBF, while ILS was delivered at 25 Hz during the second and fourth scans. The baboons received a bolus dose of 20 mCi 15O-labelled water (H215O) every 8-10 minutes. The total acquisition time for each scan was 120 seconds. Thirty-two activation and 48 activation scans were acquired for PS and CTL groups, over 80% being included in the analysis. The remaining scans were excluded either due to motion artifact or oversedation.
MRI Scans
At the end of each PET session, the baboons were intubated and connected to a ventilator (Datex-Ohmeda Aestiva 5, Madison, Wisconsin, U.S.A.). The ketamine drip was discontinued, and the baboons received isoflurane at 1-1.5% inspiratory minimum alveolar concentration (MAC). The baboons were placed supine into a Siemens 3T Trio MRI scanner (Siemens, Munich, Germany) using an eight-channel receive-only primate head coil. The baboons were immobilized using soft restraints. Heart rate, pulse oximetry and respiratory rates were monitored. High-resolution (500µm isotropic), high gray-matter/white-matter contrast (~25%) and T1-weighted (~25 signal-to-noise) images were used to acquire six full-resolution volumes were acquired using a 3D TurboFlash sequence with an adiabatic inversion contrast pulse (TE/TR/TI = 3.04/2100/785 msec, flip angle=13 degrees). Motion correction was performed after the six volumes were aligned to control for head movements between acquisitions.
Image Pre-Processing
PET images were reconstructed to a matrix size of 128 x 128 x 75, using a 5 mm Hahn filter resulting in images with a spatial resolution of about 7 mm full-width at half-maximum (FWHM). For each injection of H215O, the time of bolus arrival in the brain was confirmed to be in the third frame (20-30 seconds). Therefore, the first two frames (20 seconds) of the data were excluded from further analysis. Frames 3-12 were corrected for intra-scan motion using MCFLIRT tool in FSL software (FMRIB, Oxford, UK) and averaged. All resting H215O scans were also corrected for inter-scan motion using MCFLIRT. The PET images were value-normalized to a whole-brain mean count of 1000. MRI scans of all baboons were aligned to a baboon MRI template. Each animal’s PET scan was co-registered with its own MRI using the Convex Hull algorithm [33]. Further analysis of PET and MRI data were performed once the images were processed to a common space (Fig. 1). Bonferroni correction was used to control for multiple comparisons.
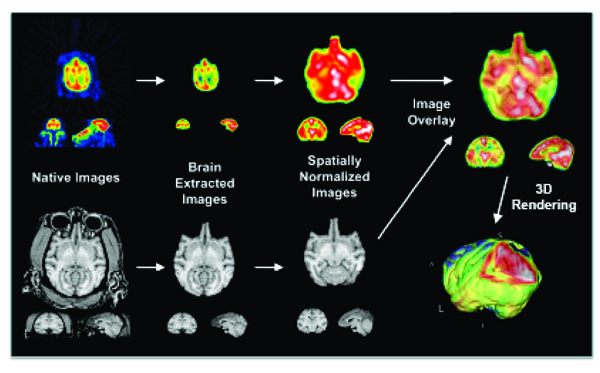
Coregistration of PET and MRI in the Baboon.
Legend: Averaged H215O-PET images co-registered with a MRI template.
Image Analysis
Conditional Contrasts
Images were analyzed using a combination of voxel-wise statistical parametric images (SPIs) previously described [35]. Briefly, SPIs consisted of contrast between ILS and resting conditions computed both within animals and intergroup for the PS and CTL groups (SPI{z}). An automated, local-maximum search [36] was performed for the activation and deactivation clusters of the SPI{z} image, and only clusters with a z value of 1.96, with p ≤ 0.05 and a volume >80 mm3 were considered for analysis. Activation and deactivation clusters were localized using PET templates [18].
Volume of Interest (VOI) Analysis
Hemodynamic responses were probed bilaterally in homologous regions of the occipital and medial orbitofrontal cortices (Fig. 2). These were the brain regions showing maximum bilateral activation during ILS in the CTL and PS groups, respectively. The cross-group z-score image (SPI{z}) contrasting photic stimulation with the resting control state was used to specify the location of cubic VOIs (1 cm3). The VOIs were placed in the center of mass of the activated cluster at these sites, as specified by an automated local-maximum search [34]. After normalization of each image to a whole-brain mean of 1,000 within these VOIs, the average value normalized counts (VNCs), which are the “raw” PET counts, were compared for each imaging condition in both groups.
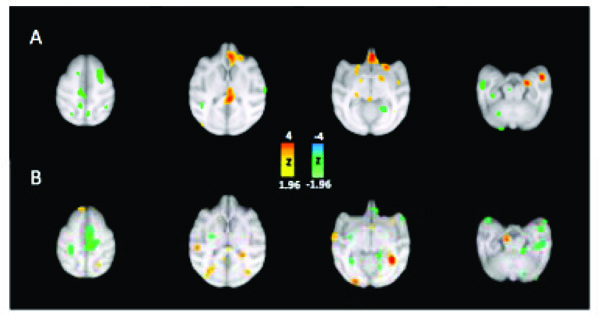
Subtraction Analyses in Photosensitive and Control Baboons.
Legend: CBF changes superimposed on axial MRI. Row (A) Controls, row (B) Photosensitive Baboons. Left side is on viewer’s left.
Correlational Analysis
A statistical parametric image of r values (SPI{r}) was computed as a voxel-wise correlation of CBF at the seed voxel centered on the ILS-induced occipital CBF responses in the CTL group [32]. These homologous regions were selected as they were the regions showing symmetrical activation closest to the primary visual cortices, and hence near to the origin of the visual pathways. The seed region (2.7 cm3) was superior to external calcarine fissure in the occipital lobes of the CTL animals. SPI{r} were analyzed for correlational effects first by an omnibus (whole-brain) test and, if omnibus significance was proven, then a post hoc (regional) test was done and local extrema were identified. The SPI{r} were converted to SPI{z}, P values were assigned from the Z distribution, and corrected for the number of positive and negative extrema. The volumes of significant correlations in various brain regions in both the hemispheres meeting the above criteria were identified. Activation and deactivation clusters were localized using PET templates [18].
Correlations were sought between ketamine dose and regional CBF changes in each group [37]. The doses ranged between 4.8 and 14.6 mg/kg/hr. The CTL group received statistically higher doses of ketamine (p<0.05) than the PS group. In order to control for the differences in ketamine doses used in the two groups, eight scans were identified in each group using similar doses of ketamine. These scans belonged to four PS animals receiving mean ketamine doses of 7.9 (+/-1.1) mg/kg/hr and three CTL animals receiving 8.5 (+/- 1.0) mg/kg/hr. Unfortunately, this sample size was too small to achieve statistical power.
EEG Studies
EEG recordings were performed during the PET scans to monitor the level of sedation, ictal and interictal epileptic discharges, occurring in resting state or during photoparoxysmal and photoconvulsive responses. EEG techniques have been described elsewhere [35]. The EEG recording was reviewed over the 90-second PET acquisition period for each animal, and the presence of IEDs and brief myoclonic seizures, predominantly consisting of eyelid myoclonus, were documented on the basis if muscle or blink artifacts. All of the EEG samples were reviewed by a single investigator (CAS) who was blinded to identity and prior EEG diagnosis of the baboons.
3.3. Results
Subtraction Analyses
In attempt to compare the CBF changes between photosensitive (PS) and asymptomatic, control (CTL) baboons averaged resting scans were subtracted from averaged activation scans (during ILS at 25 Hz) in each individual, the before the subtraction scans were averaged for each group. The subtraction analyses demonstrated multiregional activations and deactivations in both PS and CTL groups, but with more frontotemporal cortical and subcortical activation in the PS group (Fig. 2). Frontally, the medial orbitofrontal and anterior cingulate gyri were activated in the PS group, as well as the medial and anterolateral temporal cortices. The activations were asymmetric, usually more prominent over the right hemisphere. Subcortically, the activations were noted in the striatum, particularly the globus pallidum, bilaterally, the pineal gland and in the left lateral geniculate nucleus. Deactivations were also widespread, engulfing the frontal, central and parietal cortices, particularly the left SMA. The cortical activations in the CTL group were localized to the occipital lobes, particularly superior to the external calcarine sulci bilaterally, the left posterior cingulate gyrus, angular and principal gyri, and subcortically to the right lateral geniculate nucleus and putamen. Deactivations were noted in the temporal lobes, with persistent activation of the amygdalae, orbitofrontal and medial frontoparietal regions, particularly in the right SMA. The inverted CBF in some brain regions, even the activation or deactivation of homologous cortical regions, suggest that corticocortical networks respond differently in PS and CTL baboons, even in the lateralization of CBF changes.
Absent activations of the occipital cortices in PS baboons contrasts BOLD fMRI findings and H215O-PET in photosensitive humans [29, 31]. Quantification of normalized CBF changes reflected increases in occipital CBF in PS baboons at rest compared to CTL animals, while CBF increases during ILS were similar. The net CBF change consequently did not achieve statistical significance. The regional activation of orbitofrontal cortices and diffuse frontoparietal hypoperfusion in PS baboons during ILS were also unexpected findings. Early electrophysiological studies using intracranial electrodes demonstrated bilateral activation during interictal and ictal epileptic discharges in the rolandic and prerolandic frontal cortices during the photoparoxysmal response, with a delayed involvement of the orbitofrontal cortices, only with sustained ictal discharges [7]. The absence of activation of the frontoparietal cortices during ILS was also noted in previous studies, and was thought to reflect cortical inhibition or CBF undershoot following the IEDs [29, 30]. The fact that CBF tends to decrease between generalized spike-and-wave discharges or absence seizures, reduces the sensitivity of detecting CBF increases associated with ictal discharges [38]. The activation of the orbitofrontal cortices in PS baboons, on the other hand, may reflect a lower baseline or resting CBF. Alternatively, fMRI studies of absence seizures in humans also demonstrated a sustained increase of orbitofrontal CBF before and after brief IEDs, lasting longer than in the lateral or medial frontal regions [39]. Whether this would be the case during the brief discharges associated with the photoparoxysmal response is unknown.
Subcortically, only the right thalamus was activated, ipsilateral to the larger occipital, orbitofrontal and temporal activations. While the thalami were activated during sustained ictal discharges associated with absence seizures [40-42], photoparoxysmal responses result in predominantly cortical activations as they propagate predominantly by cortico-cortical pathways not involving the thalamus, particularly in the setting of the brief generalized polyspike or spike-and-wave discharges associated with myoclonic seizures [31]. Furthermore, CBF was increased bilaterally in the internal globus pallidum and putamen in PS baboons, possibly reflecting the activation of nigrostriatal pathways in response to generalized seizures [43].
Ketamine- and IED-related CBF Changes
In order to better evaluate the differences in resting CBF between the PS and CTL baboons, we searched for ketamine or IED-related effects on CBF. Subtraction scans, comparing resting states of CTL and PS baboons, did not demonstrate any statistically significant differences in any brain regions. As CBF changes differed between PS and CTL baboons in a dose-dependent fashion, CBF was compared in a subset of the animals receiving the same, weight-adjusted, ketamine dose during the resting scans. This comparison demonstrated increased occipital CBF and decreased frontal CBF in the PS baboons. In healthy human subjects receiving increasing, subtherapeutic doses of ketamine, global CBF is increased, particularly in the frontal regions, with little to no change in the occipital regions [44]. This baseline activation of the occipital lobes which increases with ketamine dose increases has no obvious explanation. It is not likely to be driven by IEDs, as these are expressed mainly in the frontal regions, but rather by ketamine-induced cortical disinhibition. Nonetheless, while the CBF patterns correlating ketamine dose and IED rate differed substantially in the frontal lobes of PS baboons, occipitally the correlation analyses appeared to be concordant for both variables [37].
Furthermore, correlation analyses with resting IED rate demonstrated a symmetrical pattern of activation of the primary occipital cortices, lateral parieto-occipital regions, angular gyri and of the primary somatosensory cortices (Fig. 3). Subcortical structures are also activated, though less symmetrically, with the left thalamus showing increasing activation with IEDs. It is possible that the duration of the interictal or ictal discharges would be better correlated with bilateral thalamic CBF increases, but scalp EEG may be too unreliable to precisely quantify discharge duration. Nonetheless, correlation of resting CBF with IED rate may have reproduced at least part of the network responsible for the generation and propagation IEDs. Hence, in contrast to previous observations [19], it is likely that the parieto-occipital regions contain either the electrophysiological or biochemical framework to elicit and synchronize IEDs, even in the absence of ILS.
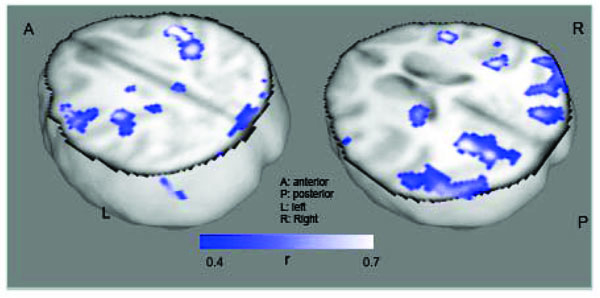
Correlation of CBF with Rate of Interictal Epileptic Discharges in the Baboon.
Stimulus-Frequency Dependent Changes
One approach to identify connectivity of brain regions in PS and CTL baboons, is to evaluate CBF changes associated with altered parameters of stimulation. Variability of occipital CBF change was reported in healthy humans exposed to ILS, with CBF maximized at 8 Hz frequency, resonating at the same frequency of the awake posterior background [25]. Outside of the occipital lobes, CBF changes also appeared in the lateral and medial frontal lobes, temporal lobes and cingulate gyrus, which tended to decrease at increasing ILS frequencies, while CBF tended to increase in the visual association cortices [26]. A biphasic CBF change similar to the occipital lobes was only noted in the anterior cingulate region, but was maximal at 4 Hz.
In an ongoing study evaluating regional CBF changes due to ILS-stimulus frequency, preliminary findings in five PS and 3 CTL baboons demonstrated marked differences between them [45]. Averaged subtractions scans for three PS and CTL animals were compared at 5, 10, 15 and 25 Hz frequencies for particular regions of interest, including the occipital, posterior cingulate, orbitofrontal and motor cortices. Similar to humans, biphasic changes were noted in the occipital lobes, posterior cingulate cortex and motor cortices in the CTL baboons. CBF values, on the other hand, were maximal at higher frequencies in baboons than humans, namely 10-15 Hz (Fig. 4). While CBF maximized at ILS frequencies of 15-25 Hz in the PS baboons, the overall biphasic changes were maintained in the same brain regions. The only exceptions were the occipital lobes, where CBF increased progressively to 25 Hz. While these regions may also adhere to a biphasic response if ILS frequencies were to be increased further, progressive activation at increasing ILS frequencies may reflect decreased inhibition in PS baboons, particularly at frequencies that are most likely to trigger photoparoxysmal discharges. As this finding may be in part an artifact of ketamine’s pharmacodynamic effect, it is necessary to validate this finding with anesthetics with a different mode of action. It will be also important to test the CBF responses at higher ILS frequencies in order to confirm that 25 Hz is associated in maximal excitation in the PS baboon.
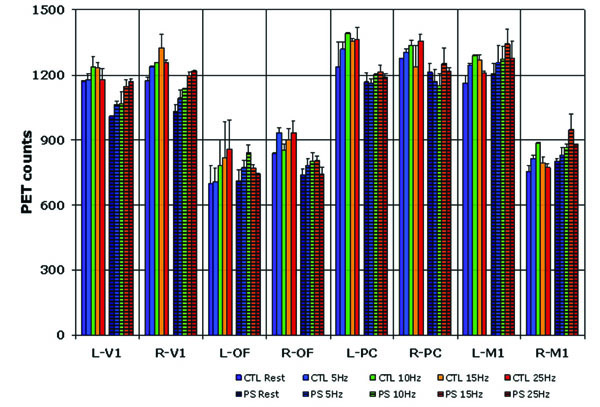
ROI Analysis of CBF change with Variable ILS Frequency in the Baboon.
Legend: L left, R right, V1 primary visual area, OF orbitofrontal cortex, PC posterior cingulate gyrus, M1 primary motor cortex. hatched columns pertain to photosensitive baboons.
Covariance Analyses
Covariance analyses to correlate CBF changes with respect to a single region of interest. As the occipital lobe is the entrance point for visual stimulation, which reliably produced CBF increases in both CTL and PS, it provides an excellent region of reference for covariance analyses. The CBF changes that are reported outside of the occipital lobe in the setting of a covariance analysis, are secondary to occipital CBF increases. Surprisingly, the CTL baboons demonstrated asymmetrical, and mainly unilateral, activation patterns in brain regions outside of the occipital lobes, implying connectivity of the occipital lobes with brain regions in the same hemisphere. However, there was increased activation of brain regions with respect to left than right occipital lobe activation. Whether this asymmetry represents a particular ocular dominance is unclear, but it may merely imply a preferential processing of gross, high-frequency visual stimuli in the left hemisphere. The PS baboons, on the other hand, demonstrated widespread activation of both occipital lobes, and symmetrical activation of the parietal lobes and the sensorimotor cortices, regardless of the lateralization of the region of interest. From this analysis, and similar to the results of the correlations analysis of IEDs, it was apparent that synchronization of the photoparoxysmal response occurred at the level of the occipital lobes, with symmetrical coactivation of parietal association areas and sensorimotor cortices. While these regional CBF coactivations may not determine the areas where spontaneous or ILS-induced ictal or interictal epileptic discharges are generated, they do outline the brain regions that are likely nodes in a network subserving the propagation of the photoparoxysmal response along known anatomical pathways [20, 21]. This finding is in stark contrast with earlier electrophysiological studies demonstrating the generation of IEDs only at the level of the perirolandic (predominantly motor) cortices, with propagation to the medial and lateral frontal cortices [7]. These studies reported that ictal or interictal epileptic discharges appear occipitally only after their expression in the frontal lobes. It is unclear, whether the emphasis on the frontal lobes by these earlier studies was based upon a sampling bias limited by the use of depth electrodes or recording equipment, but the CBF changes identified by our group need to be verified electrophysiologically.
4. CONCLUSIONS
The objective of PET studies was to outline the epileptic network, providing potential targets for intracranial electrophysiological monitoring. The correlation and covariance analyses were effective tools for mapping circuits spontaneous and ILS-induced IEDs, respectively. The correlation and covariance analyses evaluate relative changes of CBF with independent variables and between brain regions, thereby reducing the effect of resting state CBF, particularly the effect of ketamine, on cortical and subcortical activation patterns. As the maps representing occipital CBF covariance and resting IED correlations are generated by distinct (only partly dependent) variables pertaining to the baboons photosensitive, generalized epilepsy, overlapping regions of interest may include brain regions belonging to the epileptic network. Fig. (5) depicts the composite map of these analyses, demonstrating overlap in the lateral occipital cortices, angular gyri superior and medial parietal lobes and the sensorimotor cortices, bilaterally. This composite map, and its individual components, support a much greater involvement of the parieto-occipital cortices in the generation of the photoparoxysmal response and spontaneous IEDs than previous researchers had proposed [7, 19].
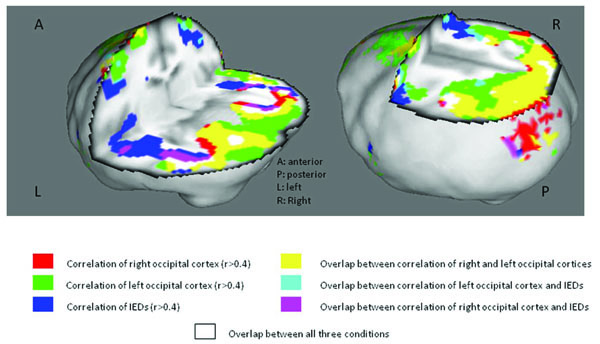
Covariance/Correlation Analyses in Photosensitive Baboons.
Legend: Covariance analyses evaluating CBF change with left or right occipital lobe activation are merged with the correlation analysis of CBF change with IED Rate.
Nonetheless, it is not clear whether regional CBF changes reflect synaptic events related to corticocortical transmission or the generation or propagation of ictal or interictal epileptic discharges. Functional BOLD-MRI studies mapping CBF changes with respect to the discharges associated with the photoparoxysmal response may provide a more effective methodology to evaluate the evolution of CBF changes associated with a single photoparoxysmal response or spontaneous IED. One of the shortcomings of the PET analysis is that fluctuations of CBF related to IEDs or seizures are averaged over an extended uptake period, and consequently may remain undetected. But even with fMRI, the BOLD changes lag behind electrophysiological changes by seconds, and clearly separating epileptic and physiological activity may be hampered in photosensitive individuals. Ultimately, well-designed electrophysiological approaches will be needed to evaluate the mechanisms underlying CBF changes associated with ILS in photosensitive and symptomatic individuals.
5. FUTURE STUDIES
5.1. Absolute PET Quantification
Absolute PET quantification will be needed to evaluate any subtle CBF or metabolic differences between photosensitive and a healthy, control baboons, particularly at rest. It is important to quantify relative orbitofrontal CBF decreases, and occipital CBF increases, in photosensitive animals to better understand whether these changes reflect functional or structural abnormalities.
5.2. Structural Equation Modeling
Structural equation modeling (SEM) requires a study design altering regional CBF by a quantifiable change in the stimulus [46]. This could include stimulus duration, changes in the luminance or distance of the stimulus. As the alteration of ILS-frequency affects both occipital and cerebral CBF changes in PS and CTL baboons, it may provide an optimal biomarker for modeling of connectivity of the visual cortices. However, as structural equation modeling depends upon connectivity, it may not be adequate to map the entire epileptic network, particularly those regions remotely connected to the visual cortices. SEM not only demonstrates connections between the suspected nodes of the epileptic or physiological networks, but can also determine their directionality.
5.3. Functional MRI and Electrophysiological Studies
Functional BOLD MRI has been implemented favorably in the evaluation of absence seizures [40, 41] and the photoparoxysmal response [31] in humans. The continuous acquisition of MRI data with the retrospective correlation with spike-and-wave discharges occurring on with EEG has been an effective model in mapping the BOLD changes before, during and after the ictal or interictal discharge. In absence seizures, BOLD changes even precede the recording of the ictal discharges in some brain regions, which had not been reported in other studies [38]. BOLD changes increase and migrate during the course of the epileptic discharge visible on scalp EEG. The BOLD increases then resolve, with subsequent decreases in BOLD signal in the previously activated and adjacent brain regions. These studies all prove that “generalized” discharges, although generated bilaterally, are associated with localized CBF changes that propagate inter- and subcortically. These studies need to be confirmed in intracranial electrophysiological studies animal models of generalized epilepsy. The WAG-Rij rodent model of absence epilepsy was evaluated with intracranial EEG recordings and, in one study, IEDs were correlated with cortical CBF changes [47, 48]. Researchers demonstrated a likely parietal lobe onset of absence seizures, more specifically localized to the somatosensory barrel-cortex. Similarly, the baboon model should be amenable for the same multimodal approach, synthesizing CBF maps and intracranial EEG recordings. The functional neuroimaging studies, in the case of the baboon, will provide the targets for the EEG evaluation, both to confirm potential electrophysiological mechanisms underlying the CBF changes and better delineating the temporal evolution of the spontaneous and ILS-induced ictal and interictal epileptic discharges.
ACKNOWLEDGEMENTS
This study was supported by the South Texas Veterans Health Care System (VISN 17) and by the NIH/NCRR base grant (P51 RR013986) that supports the SNPRC. This research also was supported in part by NIH/NINDS grant R01 NS047755 and NIH/NINDS grant R21 NS065431. F.S. Salinas is supported by a National Research Service Award (NIH/NINDS F32 NS066694). The pedigreed baboon resources were supported in part by NIH/NHLBI grant P01 HL028972. This research was conducted in part in facilities constructed with support from the Research Facilities Improvement Program under grants C06 RR15456 and C06 RR014578 from NIH/NCRR.

