All published articles of this journal are available on ScienceDirect.

Brain Development in Childhood
Abstract
Although human brain development continues throughout childhood and adolescence, it is a non-linear process both structurally and functionally. Here we review studies of brain development in healthy children from the viewpoint of structure and the perfusion of gray and white matter. Gray matter volume increases and then decreases with age, with the developmental time of the peak volume differing among brain regions in the first and second decades of life. On the other hand, white matter volume increase is mostly linear during those periods. As regards fractional anisotropy, most regions show an exponential trajectory with aging. In addition, cerebral blood flow and gray matter volume are proportional at similar developmental ages. Moreover, we show that several lifestyle choices, such as sleeping habits and breakfast staple, affect gray matter volume in healthy children. There are a number of uninvestigated important issues that require future study.
1. INTRODUCTION
In the last ten to fifteen years, progress in magnetic resonance imaging (MRI) and other imaging techniques, the application of statistical analysis to brain imaging, and other advances have enhanced our understanding of brain development, which continues throughout childhood to adolescence and early adulthood. Pediatric brain development is a complex process that includes both linear and non-linear structural and functional processes [1-5]. The initial increase in the number of synapses per neuron and intracortical myelination in the brain is followed by a decrease with maturation, as seen in postmortem studies [6-8]. In addition, recent neuroimaging studies have determined that several disorders, such as autistic spectrum disorder, show significant differences in gray matter volume both in the cortex [9-1] and in subcortical regions [10] compared with age-matched healthy children. Other studies have identified different trajectories in the correlation between white matter volume and age in patients with these disorders compared with age-matched healthy children [12, 13]. Therefore, understanding brain development in healthy children is thought to be important not only for improving understanding of the progress of brain maturation but may also facilitate early diagnosis and evaluation of developmental disorders, such as autistic spectrum disorders.
Here we review studies of brain development in healthy children, from the viewpoints of gray matter and white matter volume, and brain perfusion. We also review studies that focus on lifestyle factors that are thought to affect brain development. Finally, we point out several uninvestigated important issues in this field.
2. GRAY MATTER DEVELOPMENT
Recent studies have shown an inverted-U-shaped correlation between gray matter volume and age, with a pre-adolescence increase followed by a post-adolescence decrease in healthy children [1-3, 14-17], corresponding to an increase in the number of synapses per neuron and intracortical myelination in brain maturation and then a subsequent decrease [6-8, 18]. A recent study analyzing the linear and curvilinear trajectories of gray matter density with age in cortical regions showed that higher-order association cortices mature only after lower-order somatosensory and visual cortices [3]. Other studies have shown a significant positive linear correlation between gray matter volume and age in several regions, such as the bilateral anterior temporal cortex and insulae, and a significant negative linear correlation between gray matter volume and age in other regions, such as the basal aspect of the frontal lobe and posterior parietal cortices [19, 20] using voxel-based morphometry (VBM) [21]. VBM is an established automated neuroimaging technique that enables cortical and subcortical gray matter analysis without a priori identification of a region of interest, which is, therefore, not biased toward any specific brain region. More recently, linear and curvilinear correlations between cortical thickness and age were estimated in cortical gray matter regions using data from 375 healthy children and adolescents [22]. They revealed that cortical regions with simple laminar architecture, including most limbic areas, showed a linear trajectory with age, while poly-sensory and high-order association cortical areas that have complex laminar architecture have the most complex developmental trajectories fitted by quadratic or cubic polynomial functions. Another study showed curvilinear regional cortical thinning with age in adolescence and young adulthood [23]. Cortical thinning was observed across almost the entire cortical mantle. In the majority of regions, cortical thickness decreased non-linearly, with the greatest change occurring in adolescence. The percentage decrease in thickness was largest in the parietal lobe, followed by the medial and superior regions in the frontal lobe, the cingulum and the occipital lobe. Moreover, a recent study analyzed the linear and curvilinear correlations between age and subcortical gray matter regions such as the caudate head, putamen, and thalamus, and found that there were no age effects on thalamic volume, whereas the hippocampus and amygdala showed volume increases [24].
In addition, in our recently published study, we analyzed the linear and curvilinear correlations between gray matter volume and age and between gray matter density and age in cortical and subcortical gray matter using voxel-based analysis applying the Akaike information criterion (AIC). The AIC is one of the methods that are widely used to determine the best-fit model for any correlation by selecting the function that shows the lowest AIC value [25]. Representative sets of structural MR images in a 5.8-year-old female, a 9.6-year-old male, and a 13.5-yearold male are shown in Fig. (1). We found that several regions, such as the lateral frontal cortex, precentral gyrus, and cerebellum, had significant positive linear or curvilinear correlations between gray matter volume and age [26]. We also found several regions, such as the medial aspect of the frontal cortex, that showed significant decreasing linear or curvilinear correlations between gray matter density and age [26]. Thus, recent studies have revealed the trajectory of gray matter volume or cortical thickness with age. These studies may help in clarifying the mechanisms of normal brain maturation from the viewpoint of brain gray matter volume and enable a distinction between normal and abnormal gray matter volume trajectories indicative of developmental disorders.
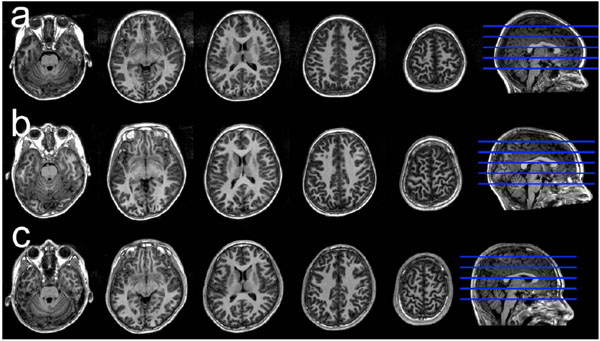
Representative sets of structural images in a 5.8-year-old female, a 9.6-year-old male, and a 13.5-year old male.
3. DEVELOPMENT OF WHITE MATTER
In addition to gray matter volume, white matter volume also has a curvilinear trajectory with age in childhood through adolescence, with a stable preadolescence volume followed by a slight post-adolescence increase [2, 23, 27-29]. The increase and decrease in the number of synapses per neuron and intracortical myelination in brain maturation are believed to contribute to this phenomenon [6-8, 18]. Recent studies have focused on white matter microstructure, such as fractional anisotropy (FA) and mean diffusivity (MD), using diffusion-tensor imaging (DTI). DTI indirectly provides in vivo information about tissue microstructures using the random diffusion of water molecules in the brain [30]. While the FA index is a commonly used intravoxel metric that characterizes the degree of diffusion directionality [31], FA is a measure of the directionality of diffusion, with values ranging from 0 (isotropic diffusion) to 1 (totally anisotropic diffusion), and is sensitive to axonal diameter, axonal density, and the degree of myelination [32-34]. On the other hand, MD measures the average degree of water diffusion. Several studies have shown that while FA increases linearly with age, MD decreases linearly from childhood to young adulthood [35-39]. However, other recent studies have shown that the FA and MD trajectories are curvilinear, rather than linear, such that FA initially increases rapidly with age, and then the rate of increase slows, finally reaching a plateau. In contrast, MD initially decreases rapidly with age, then the rate of decrease slows, and finally a stable value is reached. The correlations of curvilinear fitting, using exponential fitting, in ROI analysis [23, 27, 40-42] have been estimated. ROI analysis has the advantage that the developmental change of specific white matter fibers can be the research focus. On the other hand, voxel-based analysis has the advantage of revealing brain maturation in whole brain regions, without setting any a priori ROI. In a recently published paper, we examined linear and curvilinear correlations of FA, MD, and white matter volume with age in a large number of healthy children using brain structural and diffusion-tensor MRI followed by voxel-based and ROI analyses. Representative sets of FA map in a 5.8-year-old female, a 9.6-year-old male, and a 13.5-yearold male are shown in Fig. (2). We found that the correlations of FA and MD with age showed exponential trajectories in most ROIs, except for a few fibers, such as the corpus callosum connecting the bilateral rectal gyri in boys [43]. Furthermore, the correlation between white matter volume and age was generally positive and linear in most ROIs, except for a few fibers, such as the bilateral uncinate fasciculus. Additionally, the maturational rate differed among major fibers. In girls, the left superior longitudinal fasciculus, which connects the frontal and temporal lobes, showed a slower rate of maturation than other fibers [43].
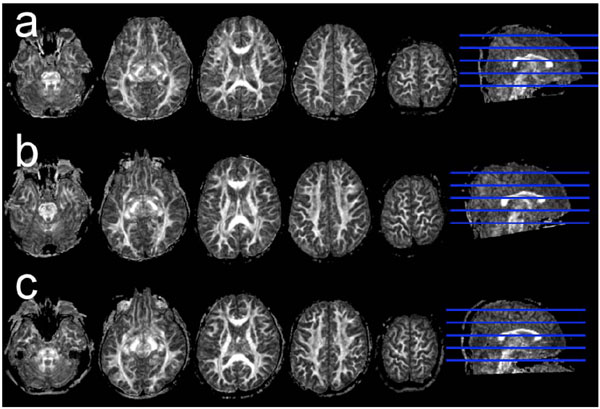
Representative sets of FA map in a 5.8-year-old female, a 9.6-year-old male, and a 13.5-year old male.
Because the FA value is associated with cognitive functions such as reading skills [44] and working memory [45], correlating measures of white matter microstructure and age in healthy children is important. Additionally, subjects with autism show lower FA in several regions, such as the superior temporal sulcus and the fusiform gyrus [36]. Thus, defining the normal trajectory of the correlation between FA and MD with age in the whole white matter may clarify white matter maturation relative to cognitive function in healthy children, and also explain differences in brain maturation between healthy children and children with autism.
4. DEVELOPMENTAL CHANGES IN CEREBRAL BLOOD FLOW
Despite a growing wealth of knowledge about maturational changes in gray/white matter volume and white matter microstructures in children, brain perfusion with age in healthy children is not yet well documented. Brain perfusion is thought to reflect cerebral metabolic demand [46], and several disorders such as autism show significant differences in brain perfusion compared with age-matched normal children [47-49]. Earlier brain perfusion has been measured by intravenous bolus injection of contrast agents or radioisotopes. More recently, arterial spin-labeling (ASL) perfusion MRI was developed for evaluating brain perfusion [50]. In ASL, arterial blood water is magnetically labeled proximal to the tissue of interest, and the effects of this pre-labeling are determined by pair-wise comparison with images acquired using control labeling. This technique provides reproducible and reliable quantitative measurements of brain perfusion in various diseases and psychiatric disorders in adults [51-55]. Because of the higher water content in children, as compared to adults [56], and higher blood-flow rates in carotid arteries in children, as compared to adults [57], the limitations of low signal-to-noise ratio and transit effects in ASL are reduced in children, as compared to adults [58]. Using ASL, one study showed a correlation between brain perfusion and age from 4 to 78 years [59]. Perfusion in gray-matter volume in the first decade of life was about two times higher than in adults; decreased in adolescence, and finally reached the adult level [59], consistent with a study applying 15O-labeled positron emission tomography [60]. We recently reported a correlation between brain perfusion, adjusted for gray-matter density, and age in a large number of healthy children with a wide age range. We applied ROI analysis, in which cerebral gray-matter was divided into four lobes and 22 ROIs, corresponding to anatomical structures in each hemisphere [61]. Because of the limited spatial resolution of ASL, and significantly higher brain perfusion in gray matter compared with white matter, we adjusted gray matter density in brain perfusion to remove the partial volume effect between perfusion of gray and white matter [62]. Representative sets of ASL images in a 5.8-year-old female, a 9.6-year-old male, and a 13.5-yearold male are shown in Fig. (3). We found that BP-GMD showed an inverted-U- followed by a U-shaped curvilinear pattern in most brain regions, similar to the trajectories derived from brain structural and functional studies with respect to brain maturation [3, 6, 46]. In addition, we showed that the age of the highest BP-GMD differed among the lobes and gray-matter regions, progressing from the occipital lobe to the frontal lobe via the temporal and parietal lobes.
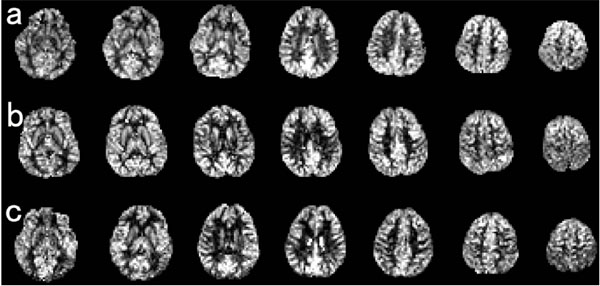
Representative sets of ASL images in a 5.8-year-old female, a 9.6-year-old female, and a 13.5-year old female (adopted from [61]).
As regards the curvilinear pattern, a pre-adolescence increase followed by a post-adolescence decrease in the number of synapses per neuron and intracortical myelination occur during brain maturation [6-8, 18]. This may affect the results as seen in the correlations between gray matter volume and age described above. Because a major portion of the brain’s glucose consumption is used for the maintenance of resting membrane potentials [63], there should be a direct relationship between the degree of synaptic connectivity, or dendritic arborization, and the cerebral metabolic rates of glucose utilization (CMRglu). In fact, the trajectory of CMRglu in the first and second decades of life increases twice as much as that seen during the first four to ten years, and then shows a gradual decline until adult CMRglu values are reached around the age of 16–18 years [46]. Due to the relationship between CBF and glucose consumption [64-66], an inverted–U- followed by a U-shaped curvilinear trajectory of BP-GMD is observed in healthy children. Several post-mortem studies of human brains showed that the time course of synaptogenesis was earlier in the visual cortex and auditory cortex than in the prefrontal cortex [6-8], with the age of the highest BP-GMD moving in a posterior to anterior direction. Moreover, synapse elimination starts earlier in the visual cortex than in the auditory cortex, whereas synapse elimination in the prefrontal cortex starts later than in the visual cortex and the auditory cortex [6]. Therefore, brain maturation starts in the occipital lobe, and then moves to the temporal lobe, followed by the frontal lobe.
5. INFLUENCE OF LIFESTYLE ON BRAIN DEVELOPMENT
5.1. Sleeping Habits and Brain Development
Recent studies have suggested that sleep is associated with hippocampal function and structure, although the role of sleep remains debatable. For example, one major theory proposes that memory consolidation occurs predominantly during sleep, when the hippocampus sends information from the memory to the neocortex for permanent storage [67]. Additionally, sleep deprivation has been shown to reduce the proliferation of cells and to suppress neurogenesis in the rat hippocampus [68, 69]. Even human patients with primary insomnia showed significant reductions in hippocampal volume [70]. Thus, because there is a correlation between sleep and the hippocampus in both animals and human adults, and because the influence of chronic sleep loss on the cognition of healthy children has been examined [71], there may be significant correlations between sleep and hippocampal volume in healthy children. Indeed, we recently reported a correlation between sleep duration and hippocampal gray matter volume using MR images of a large number of healthy children, aged 5–18 years. We found that the volume of the bilateral hippocampal body significantly positively correlated with the duration of sleep during weekdays after adjusting for age, sex, and intracranial volume and after performing small-volume correction of the hippocampal ROI [72]. Although the mechanisms underlying this significant positive correlation have not been clarified, the findings of several studies in rats and humans support these results. Thus, sleep may be necessary for neurogenesis and synaptic reorganization in the human hippocampus. These findings advance our understanding of the importance of sleep habits in the daily lives of children.
5.2. Breakfast Habits and Brain Development
Because brain development continues throughout childhood and adolescence, an adequate diet during these periods is thought to affect brain development and cognitive function. Indeed, recent studies have shown that eating breakfast has an immediate positive effect on cognitive function in children [73-75], and that skipping breakfast affects their problem solving [76], short-term memory [76], and attention [77]. In addition, several studies on school breakfast programs have shown positive long-term effects of breakfast on the cognitive performance of well-nourished children [78, 79]. Moreover, there is a significant positive correlation between regional brain gray matter volume in several regions such as the prefrontal cortex [83], orbitofrontal cortex [80], and cingulate gyrus [80, 81] and cognitive function, such as intelligence quotient (IQ) [80-83]. Thus, because of the correlation between breakfast staple type and several cognitive functions, and between cognitive function and gray matter volume, correlations may also exist between breakfast staple type and gray matter volume in children. Recently, we reported that gray matter volume related to daily breakfast habits for a large number of healthy children aged 5–18 years [84]. Since boiled white rice and white bread are the two major breakfast staples in Japan, we divided subjects depending on their breakfast staple. The rice group consisted of subjects who habitually ate boiled white rice for breakfast, while white bread was habitually eaten for breakfast by the “bread group”. We found that the rice group had significantly larger regional gray matter volumes in an anatomical cluster that included the left superior temporal gyrus, the left inferior frontal gyrus, and the bilateral caudate nuclei after adjusting for age, gender, intracranial volume, socioeconomic status, average frequency of eating breakfast, and number of side dishes eaten for breakfast [84]. Thus, long term dietary habits influence gray matter development. Although the mechanisms remain to be uncovered, the glycemic properties of the staples may affect these results. The main difference between the components of boiled white rice and white bread is in their respective Glycemic Index (GI), which measures glycemic properties [85]. In general, high GI foods are rapidly digested low-fiber high carbohydrate foods that cause an initial sharp blood glucose peak, with overall lower circulating blood glucose 2 h later. Conversely, low GI foods cause a lower blood glucose peak, and generally result in a more sustained blood sugar response, resulting in lower fluctuation in blood glucose level and more stable and efficient glucose supply to the brain compared with high GI food. The GI of Japanese boiled white rice is reported to be lower than that of white bread (boiled white rice: white bread = 68 : 100) [86], suggesting that boiled white rice provides a more stable and efficient glucose supply than white bread. Because a major portion of the glucose consumed by the brain is used for the maintenance of resting membrane potential in neurons [63], stable and efficient glucose supply is important. In addition, cerebral metabolic rates of glucose utilization are approximately two times higher in children, compared with adults [46], because the mean number of synapses per neuron increases in pre-adolescence [6, 8]. Therefore, an efficient supply of glucose is thought to be especially important for brain maturation in children and, thus, the breakfast staple type is thought to affect pediatric gray matter volumes.
6. UNRESOLVED ISSUES
The trajectories of gray/white matter volume and white matter microstructure with age have been clarified in healthy children. However, most studies have used a cross-sectional design, because it is easier to analyze the correlation between brain measures such as gray matter volume and age within a wide age range, using a large number of subjects, than using longitudinal analysis. However, the estimation of age-related changes by a cross-sectional design may be confounded by individual differences in brain size. In contrast, longitudinal analyses can identify subtle changes in brain volume over time, because individual variability in brain size does not obscure such changes. Indeed, longitudinal studies have shown that there are substantial differences between the magnitude of the average annual change in gray matter volume derived from longitudinal studies and that derived from cross-sectional studies in an adult aging study [87, 88]. Therefore, longitudinal studies are needed to clarify the trajectory of gray and white matter with age in healthy children more efficiently. Recently, several longitudinal studies correlated cortical thickness with age [22], or white matter microstructure with age [89]. Those studies clarified more detailed brain development from the context of gray matter than white matter. However, few studies have focused on longitudinal developmental changes in brain perfusion. In addition, longitudinal effects of lifestyle on brain development have not been fully clarified yet.
As regards lifestyle factors that affect brain development in healthy children, we demonstrated that sleeping and breakfast habits are likely to affect brain development. However, several other factors may also influence brain development. For example, exercise training is associated with increased serum levels of brain derived neurotropic factor (BDNF), resulting in an increase in gray matter volume of the adult hippocampus [90]. Therefore, it is thought that exercise training may positively influence brain development in healthy children.
In addition, recent studies have shown that genetic factors affect gray matter volume. For example, a Val66Met single nucleotide polymorphism (SNP) in the BDNF gene is associated with hippocampal volume [91, 92]. Sleeping habits also affect hippocampal gray matter volume [72]. Therefore, studying the interaction of genetic factors with lifestyle in brain development will facilitate our understanding of brain development in healthy children.
7. CONCLUSIONS
Gray matter volume increases with age and then decreases, and the age of peak volume differs among brain regions in the first and second decades of life. White matter volume increases mostly linearly during those periods. As for fractional anisotropy, most regions show an exponential trajectory with age during those periods. In addition, we have shown that several lifestyle factors such as sleeping habits may affect brain development in healthy children. Future studies should increase our understanding of a number of uninvestigated important issues that were discussed here.
CONFLICT OF INTEREST
The authors confirm that this article content has no conflicts of interest.
ACKNOWLEDGEMENTS
We thank H. Hashizume, B. Thyreau, Y. Sassa, H. Takeuchi, M. Asano, K. Asano, Y. Kotozaki, R. Nouchi, and Y. Yamada for collecting MRI data and supporting data analysis, and Y. Suzuki for technical support. We also thank H. Fukuda for advice on research introduced in this review. This work was supported by the Ministry of Education, Culture, Sports, Science and Technology Grant-in-Aid for Young Scientists (B) (grant number 20790875).

