All published articles of this journal are available on ScienceDirect.

Spatial and Temporal MRI Profile of Ischemic Tissue after the Acute Stages of a Permanent Mouse Model of Stroke
Authors Info & Affiliations
Abstract
Object:
To characterize the progression of injured tissue resulting from a permanent focal cerebral ischemia after the acute phase, Magnetic Resonance Imaging (MRI) monitoring was performed on adult male C57BL/6J mice in the subacute stages, and correlated to histological analyses.
Material and methods:
Lesions were induced by electrocoagulation of the middle cerebral artery. Serial MRI measurements and weighted-images (T2, T1, T2* and Diffusion Tensor Imaging) were performed on a 9.4T scanner. Histological data (Cresyl-Violet staining and laminin-, Iba1- and GFAP-immunostainings) were obtained 1 and 2 weeks after the stroke.
Results:
Two days after stroke, tissues assumed to correspond to the infarct core, were detected as a hyperintensity signal area in T2-weighted images. One week later, low-intensity signal areas appeared. Longitudinal MRI study showed that these areas remained present over the following week, and was mainly linked to a drop of the T2 relaxation time value in the corresponding tissues. Correlation with histological data and immuno-histochemistry showed that these areas corresponded to microglial cells.
Conclusion:
The present data provide, for the first time detailed MRI parameters of microglial cells dynamics, allowing its non-invasive monitoring during the chronic stages of a stroke. This could be particularly interesting in regards to emerging anti-inflammatory stroke therapies.
INTRODUCTION
Experimental cerebral ischemia has been widely investigated in small animals using various Magnetic Resonance Imaging (MRI) methods (for review see [1, 2]). “Structural” MRI has usually been used in rodents, especially during the acute phase (first 72 hours), to monitor the progression of ischemic injury [3], while a combination of diffusion-MRI and perfusion-MRI has been successfully used to differentiate the core from the penumbra during the first 24 hours after a stroke [4]. Some specific MRI protocols have also been used to evaluate the effects of potential therapeutic strategies that often targeted penumbra, considered as salvageable tissue. However except for recombinant tissue plasminogen activator (rt-PA), the early neuroprotective treatments that have appeared to be effective in animal models, failed to produce any significant improvement when translated into clinical studies [5-9].
More recently, new targets have been investigated in stroke studies focusing on the sub-acute and chronic phases. Delayed processes, that may be beneficial or deleterious on the brain tissue such as inflammatory processes, gliosis, vascular remodeling, and neoangiogenesis, have been shown to occur within or immediately around the injured area, during the weeks following experimental ischemia [10-12]. Non invasive MRI has been used to monitor the events occurring during this period in live animals, and some particular protocols, using Ultrasmall SuperParamagnetic Iron Oxide (USPIO) as contrast agent, have been developed, for example to target general inflammatory processes by labeling macrophages [7, 13-15].
Most of MR studies have so far been performed in rats [3, 7, 13-23]. Nevertheless, there is currently an increasing interest in murine models of ischemic stroke because of the availability of transgenic mice [5-6, 24, 25]. So far very little work has been done using MRI to explore subacute and chronic progression of cerebral ischemic injury in mice [26] .
In this study, we used serial MRI methods in an attempt to identify intrinsic markers and to monitor the progression of focal cerebral lesion in mice, after the acute phase, i.e. during the next two weeks after cerebral ischemia induction. “Structural” MRI, correlated to histological data obtained from the same mice, was used to get a better picture of local processes taking place, which then made it possible to assess the effects of potential new therapies based on late intervention.
MATERIALS AND METHODOLOGY
Animals
Experiments were performed on 36 male C57BL/6J mice, weighing 25-28 g (Elevage Janvier, France): 5 naive and 6 sham animals and 25 animals which had undergone permanent middle cerebral artery occlusion (MCAo). All experiments were conducted in accordance with the French and European Community guidelines for the care and use of experimental animals, and under French Ministry of Agriculture permit n° 02934. Animals were housed in individual cages throughout the study.
Permanent Focal Cerebral Ischemia
Mice were anesthetized with isoflurane (initially 2%, and then 1.5 to 1.8% in a 75/25 mixture of N2O and O2). Rectal temperature was maintained at 37°C using a retro-controlled homeothermic blanket (Harvard Apparatus, USA). Under low power magnification, left temporal craniotomy with a dental drill between the eye and the ear was performed and the main arterial trunk of the middle cerebral artery was electrocoagulated about 1mm, then cut to prevent subsequent reperfusion as previously described [27]. For the sham mice, the initial procedure was identical then stopped after the craniotomy.
Magnetic Resonance Imaging
Experimental Protocol and Time Schedule
During each run of MRI experiments, mice were anesthetized via a face mask with 0.8-1% isoflurane in a 70/30 mixture of N2O and O2. The breathing rate was monitored throughout the experiments, and the body temperature was maintained between 36.5 and 37.5°C using a water-filled heating pad. The minimal interval between two consecutive MRI runs on a given mouse was 48 h.
Naive mice were observed using proton-density-, T2- and T2*-weighted experiments, T1 and T2 measurements and DTI experiments.
The sham and ischemic animals were separated in 3 groups (A, B and C). The experimental protocol and the time schedule for each group are shown in Fig. (1).
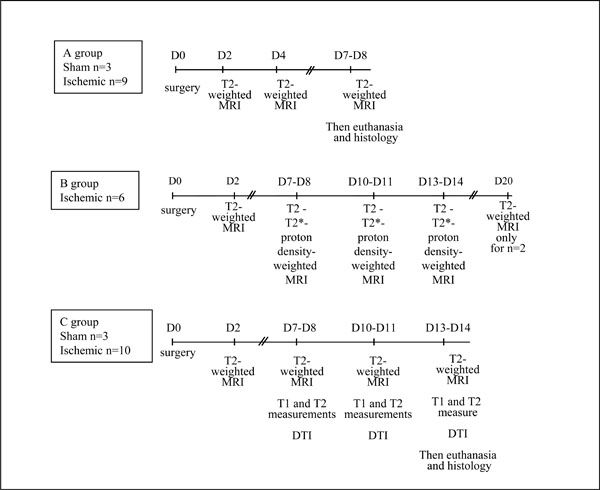
Experimental protocol and time schedule.
Material and Sequence Parameters
All MR experiments were performed using a 9.4T vertical bore spectrometer (Bruker Biospin, Ettlingen, Germany) equipped with a 0.95T/m gradient insert, and using a Rapid BIOMED probe with a 25-mm diameter birdcage type coil. All sequences were acquired using a 1.5x1.5 cm field of view, and a 128x128 acquisition matrix.
Proton and T2-weighted spin echo images were acquired with 2D multi-slice sequences with contiguous slices and a slice thickness of 0.5mm (voxel size: 117x117x500µm3), using TR = 3s, and TE = 3ms for proton- or TE = 40ms for T2-weighted images.
Gradient echo images were obtained using a repetition time/flip angle couple (TR/α) optimized to obtain proton density - or very slightly T2*-weighted images for all brain tissues (TR/α= 100ms/12°), (voxel size: 117x117x500µm3).
T1 and T2 relaxation times were determined from images obtained with multi-echo or multi-TR spin echo experiments, using 8 echoes (echo time, TE = 10ms) or 8 different repetition times (TR= 5s, 2s, 1.5s, 1.2s, 1s, 0.8s, 0.6s, 0.4s) performed with a slice thickness of 1 mm (voxel size: 117x117x1000µm3).
Water diffusion in tissues is an intrinsic three-dimensional physical process, which can be used to probe tissue structure [28]. Diffusion Tensor Imaging can be used to determine the mean diffusivity (MD) and the diffusion anisotropy, characterized by fractional anisotropy (FA). Diffusion Tensor Imaging (DTI) experiments were performed using an 8-shot echo planar-spin echo (EPI-SE) sequence with contiguous slices and a slice thickness of 1 mm (voxel size: 117x117x1000µm3), TR= 4 s, TE= 25.5 ms, diffusion gradient duration δ=4 ms and diffusion gradient separation Δ=11ms, b-value = 750 s.mm-2 along 30 gradient directions.
T1, T2 and the diffusion parameters (mean diffusivity (MD) and Fractional Anisotropy (FA)) maps were calculated using the Paravision 4.0 (Bruker, Germany) software package.
Data Analysis
Whole brain volume: brain area of each slice was determined by manual segmentation, multiplied by slice thickness, and the resulting volumes were then added.
Volumes of the abnormal intensity areas: in order to determine specific thresholds for abnormal intensities, we first checked that the contralateral hemisphere distributions in ischemic brains did not differ significantly from those in healthy animal brains. This study was done between days 7 and 14 after ischemia in proton- T2- and T2* weighted images, and in relaxation and DTI maps (Fig. 1). Then, for each region of interest an individual threshold value of signal intensity was determined from the histogram of signal values measured in the corresponding contralateral structure, which was taken as a “control”. Individual pixels were assigned to abnormal intensity area if their values were found to be significantly different (p<0.05) from the “control” distribution. The sum of the pixels selected by the above process was used to determine the total volume of the abnormal signal areas.
Intensity differences between the control and the abnormal intensity areas were characterized by the mean contrast-to-noise ratio (CNR) CNR=│Sc-S│/ (σc2 +σ2)1/2, where Sc and S were the mean signal intensity in the control area and in the abnormal intensity area respectively, and σc and σ the corresponding standard deviations [29].
Areas with abnormal intensity and the corresponding control area were defined as regions of interest (ROIs) in the T2-weighted images. To evaluate the effects of weighting, these ROIs were transferred to the corresponding slice in other weighting experiments and were also used to determine T1, T2, and diffusion values in T1- , T2- and DTI data maps.
Immuno-histochemistry and Histology
At the end of the first (Fig. 1, group A) or second week (Fig. 1, group C) of MRI runs, ischemic mice were deeply anesthetized and perfused transcardially with heparinized saline solution, followed by 4% paraformaldehyde (PAF) in 0.1M phosphate buffer at 4°C and pH 7.4. The brain was removed, post-fixed overnight in paraformaldehyde, and cryoprotected in 20% sucrose in phosphate buffer. 30-µm-thick coronal sections were cut in a cryomicrotome (CM3050S, Leica, Germany). Lesion and cell damage were assessed on Cresyl Violet stained sections and astrocyte, microglia and microvessel distribution were assessed in the infarct and in the peri-infarct areas, using the following primary antibodies: Glial Fibrillary Acidic Protein (GFAP, Santa-Cruz Biotechnology, USA, 1:50), a cytoskeletal intermediate filament protein expressed in reactive astrocytes; ionized calcium Binding Adaptor molecule 1, specific to microglia (Iba1, Wako Pure Chemical Industries, Japan, 1:200) and anti-laminin, a basal lamina protein (Sigma-Aldrich, USA, 1:80).
One free-floating section out of ten was either stained with Cresyl Violet, or incubated overnight at 4°C with a given antibody. The reaction product was revealed using an appropriate secondary antibody coupled to Alexa fluor 594 (Molecular Probes, USA, 1:400). Specificity was checked by controls in which the primary antibody had been omitted. Sections were analyzed using a laser-scanning confocal fluorescence microscope (BioRad, MRC 600).
The Paxinos and Franklin stereotaxic atlas of the mouse brain [30] was used to identify each section level, and to match it against MRI images.
Statistics
Data are expressed as mean ± SD. For one way ANOVA analysis, residual degree of freedom (DFr), F and p are reported. At first, we analyzed the cortical MR parameter values from the contralateral hemisphere of sham and ischemic mice by a one way ANOVA analysis for repeated measurements. This analysis showed no significant difference for all MR parameters of sham or ischemic mice over time (Fig. 1), between days 7 and 14 after ischemia (Fig. 2). Moreover the MR parameter mean values of sham and ischemic mice were not significantly different (One way ANOVA analysis) from the corresponding mean cortical values in the same hemisphere of naive mice (Table 1). Therefore, for the rest of the study contralateral hemisphere MR parameters of each sham or ischemic mouse were considered as controls.
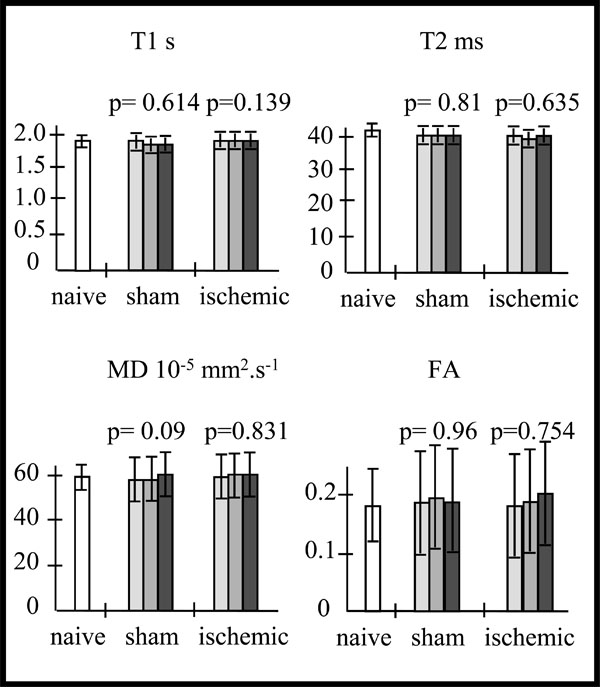
Mean values of T1, T2, mean diffusivity (MD) and fractional anisotropy (FA) in the cortex of the naive (na) mice (n=5) (in white).Variations of these MR parameters mean values, in the contralateral cortex of the sham(sh) (n=3) and ischemic (isc) (n=10) mice over time (D7-D8 : light grey, D10-D11 : intermediate grey, D13-D14 : dark grey), and p values from the one way repeated measures ANOVA: Whatever the MR parameter, there is no statistically significant difference over time for the sham mice (T1: DFr=4; F=0.553; p=0.614; T2: DFr=4; F=0.222; p=0.810; MD: DFr=4; F=4.679; p=0.090; FA: DFr=4; F=0.0412; p=0.960) nor for the ischemic mice mice (T1: DFr=18; F=2.206; p=0.139; T2: DFr=18; F=0.465; p=0.635; MD: DFr=18; F=0.188; p=0.831; FA: DFr=18; F=0.287; p=0.754).
Mean Values of T1, T2, MD and FA in the Contralateral Cortex of the Sham (n=3) and Ischemic (n=10) Mice (Measured between Days 7 and 14 as Shown in Fig. (1)) and in the Cortex (same Hemisphere) of Naive (n=5) mice. The One Way Anova Analysis between Naive Values and Respectively Sham and Ischemic Ones Showed no Statistical Difference (DFr; F; p).
| Mice MRI Parameters |
Naive | Sham | Ischemic |
|---|---|---|---|
| T1 s | 2.00±0.10 | 1.98±0.12(12; 0.398; 0.540) | 1.89±0.16(33; 0.019: 0.828) |
| T2 ms | 42.0±2.0 | 41.5±2.7(12; 1.16; 0.303) | 41.8±2.8(33; 0.033; 0.857) |
| MD 10-5mm2.s-1 | 59.0±6.0 | 60.5±6.8(12; 0.222; 0.646) | 58.9±9.6(33; 0.017; 0.963) |
| FA | 0.183±0.06 | 0.188±0.09(12; 0.176; 0.682) | 0.181±0.09(33; 0.463; 0.503) |
Evolution over time of volumes and CNR values of infarct core and low intensity signal area (LA) was analyzed by a one way repeated measure ANOVA, followed by a post-hoc Least Significant Difference test, when appropriate (Fisher LSD Method). All the mice were used for this analysis.
For LA parameters such as T2, T1, and diffusion parameters a “contrast” parameter was determined: the difference between the mean value in LA and the mean value in the corresponding symmetrically ROI in the non ischemic hemisphere weighted by the square root of the sum of the square of the standard deviations in the two ROIs. For the sham mice, the same protocol was used between ipsi- and contralateral cortical ROIs. Such a parameter limited possible bias between the maps obtained in different animals with different efficiency. This “ contrast” parameter was then analyzed by a one way ANOVA analysis for repeated measurements followed by a post-hoc Least Significant Difference test, when appropriate (Fisher LSD Method). The values of these ipsilateral MR parameters were compared to the contralateral ones using a t-test.
RESULTS
Magnetic Resonance Imaging Method
1/ T2-Weighted Image Aspects and Contrasts
Two days after stroke, T2-weighted MR images revealed a high intensity area in the potentially injured tissue in the ispilateral hemisphere, corresponding to an edema [31] (Fig. 3a). The mean whole brain volume was found to be 502 ± 13mm3. The mean volume of the high intensity area was 35 ± 6mm3, corresponding to 7% of the whole brain volume.
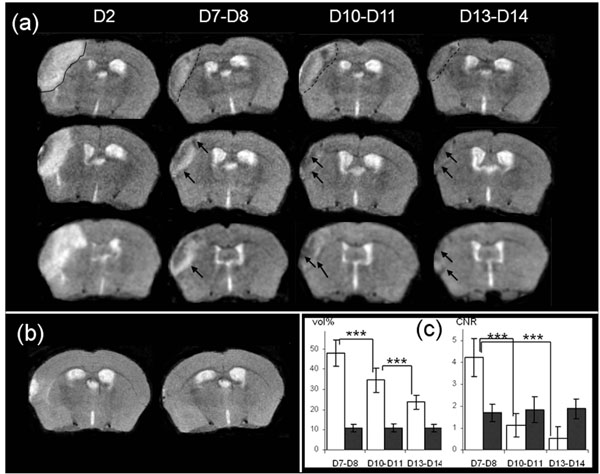
(a): Brain T2-weighted MR images from 3 mice at Days 2, D7-8, D10-11 and D13-14 after MCAo. Edema is visible at Day 2 (delineated by a continuous line, upper row image). The infarct core is delineated by a dotted-line at D7-D8, D10-D11 and D13-D14 in the same mouse brain (upper row), and low intensity area (LA) designated by an arrow in the brain of the other mice (b): Brain T2-weighted MR images from 1 representative sham mouse at Days 2 and 7 after procedure (c): Evolution of apparent volume and CNR of infarct core (in white) and of low intensity area (in black) at Days 7-8 (n=25), Days 10-11 (n=16) and Days13-14 (n=16) after MCAo. Volumes are represented as a % of the hyperintensity area volume delineated at Day 2. The differences in the mean values of infarct core volume against time were statistically significant (DFr=30; F=126.455; p<0.001), and p<0.001 for all pairwises. For LA volume there was not a statistically significant difference (DFr=30; F=0.268; p=0.757). The CNR were calculated as described in the Material and Methods section. The differences in the mean values of infarct core CNR against time were significantly different (DFr=30; F=251.219; p<0.001), and p<0.001 between D7-D8 and D10-D11 or D13-D14), and there was not a statistically significant difference for LA CNR (DFr=30; F=1.550; p=0.229).
At Day 7, qualitative evaluations of T2-weighted images showed that the area corresponding to previously-identified high intensity pixels, exhibited a heterogeneous signal intensity, assumed to be the infarct core. Inside the zone and along the inner border of this zone, low intensity signal areas (defined in the following text as LA) were present (Fig. 3a, arrowhead). The outer zone which displayed “normal” intensity, consisted of adjacent non ischemic tissue.
One should note here that in the sham mice, whereas a small hyperintensity signal area could be seen at Day 2 immediately around the craniotomy zone, this was no longer visible at Day 7 (Fig. 3b).
The infarct core volume was measured at each stage (Days 7-8; Days 10-11; Days 13-14) and was found to (p<0.001) decrease significantly over time for all pairwises (Fig. 3c). The LA volume did not vary significantly, and was equal to about 10.9 ± 1.9 % of the volume value corresponding to the total injured area measured on Day 2 (Fig. 3c).
The CNR measured between the infarct core and its corresponding contralateral zone (p<0.001) decreased significantly over time (Fig. 3c). The CNR between LA and its corresponding contralateral area was modified slightly but not significantly over time and remained equal to about 1.8±0.4 (Fig. 3c).
As the infarct core volume decreased progressively, in all the observed injured mice, LA seemed to approach the lateral edge of the brain progressively, and then merged with skull signal. Consequently, it made it difficult to monitor MRI changes in the injured areas for more than two weeks. This was confirmed in the 2 animals examined on Day 20 hence our study focused on the MRI characterization of LA between Days 7 and 14.
2/ MR Characteristics of LA
In order to determine the origins of LA signal intensity changes observed in T2-weighted images, images recorded with different weightings were compared, and the relaxation times and diffusion parameters were measured.
Effect of Weighting
Although LA was clearly visible in T2-weighted brain images, for all the mice taken into consideration (Fig. 3a, Fig. 4a, b, c, d), this area was slightly visible in T2*-weighted images (Fig. 4b). It was no longer detected in proton-weighted images recorded with either a spin echo or a gradient echo sequence (Fig. 4a). The mean CNR(LA) measured in each weighted image confirmed this qualitative impression (Table 2): in T2*-weighted images, CNR(LA) was about half of that found in T2-weighted images. In proton-weighted images, CNR(LA) was about one quarter of that found in T2-weighted images. Moreover, comparison between these CNR(LA) values and the CNR(BV) values measured between the blood vessel and the healthy adjacent tissue in naive animals (Table 2) showed that CNR(LA) and CNR(BV) determined with the various weightings did not change in the same way.
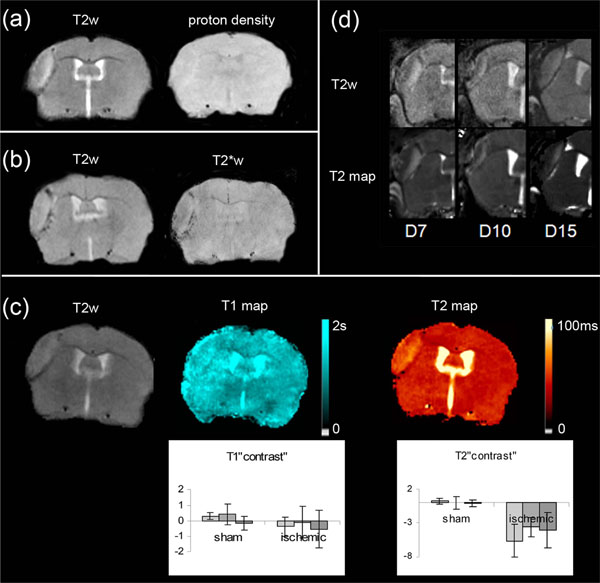
Maps and weighted-images from 6 ischemic mice (a): T2-weighted and proton density-weighted spin-echo images of the infarct core (b): T2-weighted and corresponding T2*-weighted images (c): T2-weighted image and the corresponding T1 and T2 maps. Inserted graphs show evolution of T1 and T2 “contrast” in the sham (n=3) cortex and LA (n=10) as a function of time (D7-D8 : light grey, D10-D11: intermediate grey, D13-D14 : dark grey).One way repeated measures ANOVA showed that there was no statistically significant difference among the time for T1 (DFrsham=4; Fsham= 1.006; psham=0.443; DFrLA=18; FLA= 0.593; pLA =0.559) and T2 (DFrsham=4; Fsham= 0.058; psham=0.944; DFrLA=18; FLA= 2.086; pLA=0..144) “contrast” values (d): Comparison between T2-weighted images and the corresponding T2-maps of the injured area at various time points after MCAo, on different mice.
Contrast-to-Noise Ratio CNR (LA) Between the low Intensity (LA) Area and its Contralateral Homologous Area on Day 10 after Ischemia (n=6) in T2-, T2*- and Proton Density-Weighted Images, and the Contrast-to-Noise Ratio Between a Blood Vessel (CNR(BV)) and Healthy Adjacent Tissue in T2-, T2*- and Proton Density-Weighted Images of the Naive Mice (n=5) and Corresponding p Values
| Weighting CNR (Area) |
T2 | T2* | Proton-Density |
|---|---|---|---|
| CNR (LA) | 1.8±0.3 | 0.9±0.2 (p<0.001) | 0.4±0.1 (p<0.001) |
| CNR (BV) | 0.2±0.2 | 3.5±1.4 (p<0.001) | 0.2±0.2 (p=0.950) |
Relaxation Time Measurements
T1 and T2 brain relaxation times were assessed in the naive, then in the sham and ischemic mice at the different time points between Days 7 and 14 (Fig. 1). As an example, Fig. (4c) shows T1 and T2 maps of the same ischemic mouse brain on Day 10.
The T1 and T2 values measured in the cortical areas of the naive mice were equal to 2.00±0.10 s and 42±2 ms, respectively and corresponded to previously published values [32].
As shown in the “material and methods” section, T1 and T2 values measured in the contralateral cortex of the sham or ischemic mice did not change over time (Fig. 2), and were not significantly different from the naive ones (Table 1). These values were considered as control values for each mouse.
Concerning the ipsilateral cortex of the sham mice, the variation curves of Fig. (4) showed that the T1 and T2 values did not change significantly over time. The mean T1 and T2 values were not significantly different from the control ones (T1: 1.98±0.13 s vs 1.98±0.12 s, p= 0.883; T2: 41.1 ±2.8 ms vs 41.5±2.8 ms p=0.431).
The variation curves of Fig. (4) showed that the T1 and T2 values did not change significantly over time as regards LA. However, whereas the mean LA T1 value did not significantly differ from the control one (1.85±0.16 s vs 1.89±0.15 s, p= 0.058), the mean LA T2 value, was significantly lower than the control one (31.9±2.4 ms vs 41.8±2.1 ms, p<0.001).
The comparison between T2-weighted images and T2-maps (Fig. 4d) for different mice and on different observation days, highlights the importance of the T2 effect in the LA signal intensity.
Water Diffusion Study
Water diffusion in tissues is an intrinsic three-dimensional physical process, which can be used to probe tissue structure [28]. Diffusion Tensor Imaging can be used to determine the mean diffusivity (MD) and the diffusion anisotropy, characterized by fractional anisotropy (FA).
Concerning the ipsilateral cortex of the sham mice, the variation curves of the Fig. (5) showed that the MD and FA values did not alter significantly over time. The mean MD and FA values were not significantly different from the control ones (MD: 60.4±6.8 s vs 60.5±6.8 s, p= 0,994; FA: 0.195 ±0.09 ms vs 0.188±0.09 ms p=0.657).
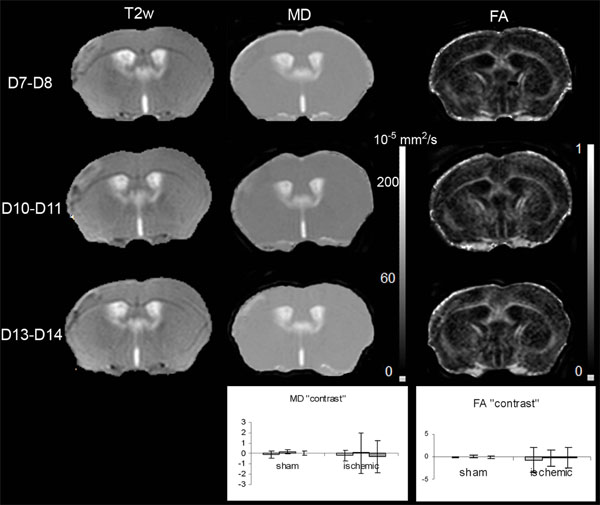
T2-weighted (T2w), and the corresponding mean diffusivity (MD) and fractional anisotropy (FA) maps, on Days 7-8, 10-11 and 13-14 after MCAo. Inserted graphs show evolution of MD and FA “contrast” for the sham (n=3) cortex and LA (n=10) as a function of time (D7-D8 light grey, D10-D11intermediate grey, D13-D14dark grey). The one way repeated measures ANOVA showed that there was no statistically significant difference against time for MD (DFrsham=4; Fsham= 1.707; psham=0.291; DFrLA=18; FLA= 0.106; pLA =0.900) and FA (DFrsham=4; Fsham= 1.448; psham=0.336; DFrLA=18; FLA= 0.449; pLA =0.645) “contrast” values.
Concerning LA, the variation curves of the Fig. (5) showed that the MD and FA values did not change significantly over time. The mean MD and FA values were not significantly different from the control ones (MD: 58.7±6.8 s vs 58.9±9.6 s, p= 0,947; FA: 0.188 ±0.09 ms vs 0.181±0.09 ms p=0.160).
Histology and Immunocytochemistry
The infarcted tissue assessed on Cresyl violet stained sections, was located in the left parieto-temporal cortex, and extended roughly from -1 to + 2 mm from the bregma, matching the lesion monitored by MRI (Fig. 6a, b). In all the ischemic mice, at D7-8 and D13-14 after ischemia, histology showed a loose connective tissue matrix with sparse dead neurons and vascular segments filled the infarct region; a narrow region of high cell density ran along the border infarct, grossly separating the damaged tissue from healthy tissue and penetrated the infarct. This region was found in every examined section. In order to characterize this high cell density, we performed immunohistochemistry using microglia, astrocytes and vessel antibodies.
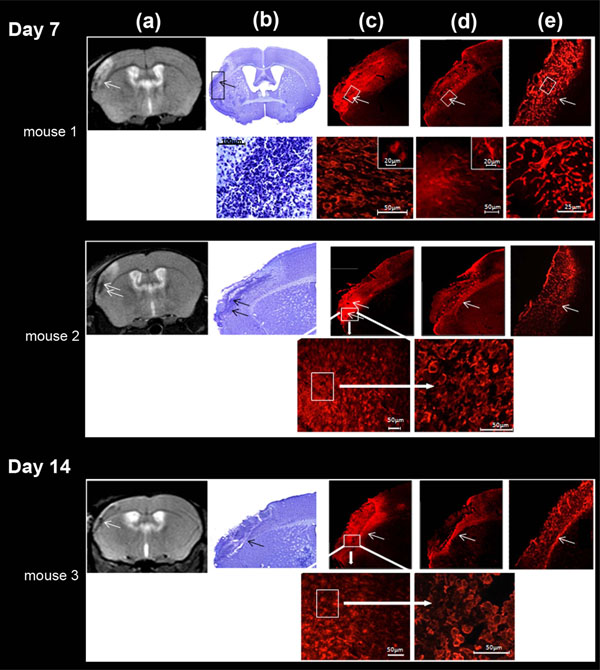
Correlation between MRI T2-weighted image (a), cresyl violet staining (b), microglial immunocytochemistry (c), astrocyte immunocytochemistry (d) and laminine immunocytochemistry (e) in LA (arrow) of the ischemic lesion, defined on MRI, at days 7 and 14. These different regions were magnified for mouse 1 (day 7) (bottom row); microglial cells were further taken at two different magnifications (intermediary and high magnifications) for mouse 2 (day 7) and mouse 3 (day 14) (bottom row) . High microglial cell (Iba1-positive labeling) density was found in LA; Iba1 cells were activated and characterized by a typical amaeboid shape. Astrocytes (GFAP-positive labeling) were activated exclusively at the outside border of the infarct and phenotype characterized by thick and ramified branches. GFAP cells were far less numerous than Iba1 cells. Laminin positive cells were uniformly found in the whole infarct area and not specifically at the border of the infarct. LA matched preferentially with high microglial cell density.
Iba1-positive labeling indicative of microglial cells, was visible throughout the brain, but was denser in the vicinity of the lesion boundary. There, accumulation of amoeboid cells, displaying a phagocytic activity, was prominent, and penetrated the infarct; ramified microglia reminiscent of resting microglia was seen in the close vicinity, outside the infarct. Moreover, the Iba1 staining inside the infarct matched the irregular low intensity signal area evidenced on MRI (Fig. 6c). In constrast, highly ramified GFAP-positive cells indicative of reactive astrocytes, formed a dense, intricate network of thick astrocytic fibers near the lesion border, as previously described [33], but did not enter the infarct (Fig. 6d). Whereas, laminin-positive labeling was only found within the ischemic core and did not reach the infarct border (Fig. 6e).
At Days 13- 14 after MCAo, the area of the infarct had decreased and identifying the different subareas became difficult.
DISCUSSION
The first general observation concerning the MR results described above is that, during the subacute phases of a murine stroke model induced by a permanent middle cerebral artery occlusion, signal intensity variations were observed in the infarct core in T2-weighted images of all the assessed injured mice. Areas, defined as LA, showed a reduced signal intensity that seemed to be due to the large drop of T2 relaxation time in the corresponding tissues. We tracked here the temporal and spatial progression of the MRI signal observed after the early stages of the stroke (i.e. between the end of the first week and the end of the second week) in the damaged cerebral hemisphere of mice brains injured by permanent focal ischemia. Indeed, to monitor later measurements after week 2 was not possible due to spatial resolution, small size of the mouse brain and because at that time, infarct volume had considerably decreased.
A decrease in T2 relaxation time can usually be attributed to factors, such as iron accumulation, or to an increase in the tissue membrane pool or in cellular protein concentrations [34, 35]. Similar low signal intensity areas had previously been identified in T2*-weighted images after an embolic stroke [36], and interpreted as angiogenesis, since they were correlated with increased vessel density on the corresponding histological sections. In our study, the contrast-to-noise ratio between LA and the corresponding contralateral area, CNR(LA), was lower in T2*-weighted than in T2-weighted images, whereas the contrast-to-noise ratio between a blood vessel and normal brain tissue, CNR(BV), measured in the naive animals was higher in T2*-weighted than in T2-weighted images. Moreover no significant variation of T1 was observed in LA, and no laminin-positive labeling could be found in LA: the T2 value decrease does not therefore seem to be due to microhemorrhages or angiogenesis.
Comparison between proton density- and T2-weighted images also indicates that the decrease in LA signal intensity could not have been due to a marked reduction in water content. Finally, when the Cresyl-violet stained sections were compared to MR images, the high density cellular distribution zones of infarct matched LA. Moreover, the location and timing of the emergence of LA corresponded closely to Iba1-positive cells invasion, i.e. to the presence of activated microglia, inside the infarct core. By contrast, GFAP-positive cells, namely astrocytes, were observed at the boundary lesion but remained outside the infarct in all the mice (Fig. 6d). If both these cellular types were present at the rim of the infarct, it is clear that there was a considerable higher microglial cell density compared to those of astrocytes. However, inside the infarct, the irregular LA could only be attributed to microglial cells. Our results are consistent with published results on transient focal ischemia in rats [37] using positron emission tomography (PET). They found a strong [11C]PK11195 PET signal at 4 and 7 days after ischemia, in the core and in the periphery of the infarct, corresponding to respectively reactive microglia, and reactive astrocytes.
This major increase in microglia could produce a local increase in the membrane pool and cellular proteins, by raising cellular density and tortuosity in the extracellular compartment. We would expect these processes to be characterized by a fall in ADC [38], however, this seems to be ischemia model- and/or species-dependent [21].
In our study we did not detect significant changes in diffusivity or in fractional anisotropy. However, high Standard Deviations in the MD and FA measurements, due to partial volume effects resulting from the low resolution power used in the DTI experiments, may have obscured changes that could have occurred.
It has already been reported that the extent of cerebral infarction induced by MCAo can be accurately and reproducibly estimated by T2-weighted MRI, and that it does not increase between 24 and 72h [31]. In our study, the ischemic injured area was seen, at Day 2, in T2-weighted images as a hyperintensity signal, assumed to correspond to the edema. On D7, T2-weighted MRI showed that this initial infarct zone consisted of subareas: the core of infarct with heterogeneous signal intensity areas, and a surrounding area with normal intensity.
In a previous similar study, Schroeter et al. [21] used histology and immunocytochemistry methods to differentiate three subareas within an infarction induced by photothrombosis. They tried to track the dynamic changes using MRI, and did show astroglial scar formation and phagocyte accumulation. However, as they admitted, their MR results did not provide an exact match between histological zones and the corresponding image areas, even though they did observe some changes in images and in MR measurements. They were also unable to delineate the astroglial scar, probably once again due to the MR resolution used.
In the present investigation, MRI enabled us to examine the signal progression in the injured area, and to correlate these findings with subsequent cellular responses. We focused particularly on the T2-weighted low signal intensity area (LA), which has been precisely described here for the first time in this kind of murine stroke model using T2-weighted MRI.
Our histological results and immunostaining show that this decrease in T2 values can be correlated with an increase in cellular density, which is due to the inflammatory response. Indeed, the inflammatory reaction induced by focal brain ischemia is dominated by both resident microglia and circulating monocyte precursors [39, 40]. The arrival of monocytes precursors in the injured brain areas has already been monitored in previous studies, using USPIO contrast agent, and shown to occur before the 7th day post-stroke [13-15, 39]. In our study, the MRI results after D7 from sham mice showed that electrocoagulation of the middle cerebral artery induced a transient modification of MRI signal, possibly due to tissue heating or to the craniectomy procedure in the sham mice. But, in any case, it did not lead to the formation of LA specifically shown in ischemic mice. However, we can not completely exclude that this procedure induces per se a microglial response in addition to the brain reaction to ischemia.
A considerable body of evidence exists demonstrating the functional plasticity of microglia in terms of their morphological transformation, but no study has so far investigated their in vivo reaction. The microglia undergoes rapid activation and transformation after any change in their environment, which is a major handicap when attempting to study these cells ex vivo. Our MRI approach can contribute to a better understanding of the dynamics of the microglial reaction to focal ischemia.
“Activated” microglia have two opposing effects on the severity of ischemic damage: a neuroprotective effect as a result of their secretion of several neurotrophins and the elimination of microorganisms and deleterious debris, and a neurotoxic effect as a result of releasing radical oxygen species, nitric oxide or inflammatory cytokines [41-44]. An in vivo, time-related MRI study of the peri-ischemic microglial reaction could therefore be of major interest in experimental cerebral ischemia studies.
CONCLUSION
The data reported here provide the evidence that MRI can be a useful tool for the non-invasive monitoring of subacute-phase changes occurring after a permanent focal cerebral ischemia, and for detecting microglia of the infarct core. This is the first time, to the best of our knowledge, that a T2-weighted low intensity area in the infarct core has been so precisely described, characterized by its main MR parameters, and matched against with histological results. Non-invasive MRI monitoring, or surveying, of this inflammatory reaction could be useful for assessing the effectiveness of new stroke treatments.
ABBREVIATIONS
CONFLICT OF INTEREST
The author confirms that this article content has no conflicts of interest.
ACKNOWLEDGEMENTS
This work was supported by grants from the French Ministry of Research (Programme Interdisciplinaire Imagerie du Petit Animal), and by grants from the “Centre National de Recherche Scientifique”, the “Institut National de la Santé et de la Recherche Médicale”, and University Paris 7. Dr. Y. Tomita was funded by the “Institut National de la Santé et de la Recherche Médicale”. We thank Monika Ghosh for revising the English text.

