All published articles of this journal are available on ScienceDirect.

Dysfunctional Cortical Connectivity During the Auditory Oddball Task in Patients with Schizophrenia
Authors Info & Affiliations
Abstract
Background:
We studied the imaginary coherence (IC) of gamma frequency oscillations between brain regions of male schizophrenia patients during an auditory oddball task using magnetoencephalography (MEG) and electroencephalography (EEG).
Methods:
Subjects were 10 right-handed male schizophrenia patients, evaluated by the positive and negative symptom scale (PANSS), and 10 healthy controls. Functional connectivity during the auditory oddball task was reconstructed in low (30-50 Hz) and high (50-100 Hz) gamma bands, and represented by imaginary coherence (IC) based on significant oscillatory power changes. We calculated correlations between PANSS scores and IC.
Results:
In the high gamma band, IC between left occipital and right prefrontal lobe areas during the time window 750-1000 ms from stimulus onset showed negative correlations with total negative scores, total positive scores, the sum of positive and negative scores in PANSS, conceptual disorganization, and social avoidance scores. In the low gamma band, IC between the same areas from 250-500 ms also showed a negative correlation with the conceptual disorganization score. In the same time window, IC between left occipital and right frontoparietal lobe areas in the low gamma band showed a positive correlation with hallucinatory behavior; IC between right temporal pole and left prefrontal lobe areas showed a positive correlation with delusion scores, although these ICs were decreased relative to controls.
Conclusions:
Functional disconnection of high and low gamma bands in auditory oddball task may play an important role in the auditory processing in schizophrenia patients.
INTRODUCTION
Reduction of P300 amplitude in ERP (event related potential) study during the oddball task is one of the most replicable biological observations in patients with schizophrenia [1-13]. We therefore investigated gamma band activity in the P300 ERP component during the classical odd ball task, using electroencephalography (EEG) and magnetoencephalography (MEG) in male schizophrenia patients by reciprocal cortico-cortical connections [14]. Isolated ganglia of invertebrates also show significant gamma responsiveness even upon very simple stimuli [15]. Some scientists suggest that neuronal gamma synchronization is related to higher brain functions [16, 17], and is central for cognition [18], including perceptual binding, attentional selection [19], and working memory maintenance [20] by providing a temporal structure for information processing [21]. The neural synchrony hypothesis in the gamma band has been supported by large number of studies. However, the involvement of gamma band oscillations in elaborate aspects of information processing is arguable. In studies using adult cats anesthetized with a mixture of ketamine and xylazine suggested that gamma oscillations are intrinsic properties of thalamocortical and cortical networks and are present during states such as sleep and deep anesthesia, where conscious cognitive processing is absent, and that there is an overemphasized interpretation of gamma band, relating this activity only to complex processing [22, 23]. Furthermore, we have to be cautious about electromagnetic activity from non-neuronal sources such as muscles that may be picked up by extracortical EEG/MEG sensors. For example, [24] demonstrated that the transient enhancement of spontaneous microsaccades, typically occurring around 200 ms after the onset of visual stimuli, causes a transient broadband increase of high-frequency power in the scalp EEG that is likely generated by ocular muscles. In addition, a strong link between gamma band oscillations and facial muscle activity during cognitive tasks was confirmed by showing that such oscillations disappear despite normal cognitive performance when the muscles are paralyzed [25]. However, Trujillo et al. observed significant long-range gamma synchronization patterns for meaningless faces (inverted and scrambled faces), and confirmed the neural synchrony hypothesis [26]. Therefore, we investigated “local power changes” in low (30–50 Hz) and high (50–100 Hz) gamma bands during classical auditory oddball task in schizophrenia patients. Several studies have shown abnormalities in gamma band oscillations using EEG and MEG in patients with schizophrenia [27-29]. Reduced gamma phase synchronization has been observed in schizophrenic patients during tasks that do not require Gestalt perception [30-32]. Schizophrenia patients showed reduced EEG power at 40 Hz to auditory stimulation [33]. Light, et al. suggested that schizophrenia patients have frequency-specific deficits in the generation and maintenance of coherent gamma-range oscillations, reflecting a fundamental degradation of basic integrated neural network activity, and that gamma band responses represent a hierarchy of integrative brain responses from relatively automatic, stimulus-driven sensory information processing to higher-order cognitive operations [34]. The gamma ASSR (auditory steady state response) deficits showed a left hemisphere bias in patients with first episode schizophrenia [35].
High gamma band activity (60-200Hz) has an important role in cortical computation through establishing correlations between the modulation of high gamma oscillations and specific cognitive functions; high gamma activity is impaired in neuropsychiatric disorders like schizophrenia. Impairments in long-range synchronization in schizophrenia are probably related to changes in white matter volume and organization, as long distance synchronization of oscillatory responses is mediated by reciprocal cortico-cortical connections [14]. In order to study functional connectivity, we examined coherence in the gamma band only in male schizophrenia patients, because a gender difference in gamma band activity has been reported in schizophrenia [31, 36].
The present study had two goals. First, we investigated whether male schizophrenia patients exhibit abnormal “local power changes” in low (30–50 Hz) and high (50–100 Hz) gamma frequency oscillations while performing the conventional auditory oddball task. Second, we investigated “global interactions” in low and high gamma bands using seeds determined by the significant oscillatory power changes, and examined correlations between scores on the PANSS [37] and functional connectivity.
METHODS
Subjects
Ten right-handed male patients with schizophrenia (mean age, 30.9±5.0 years) were examined (Table 1). The patients were diagnosed according to DSM-IV-TR criteria (American Psychiatric Association, 2000); five were inpatients and five were outpatients who had been medicated with neuroleptics for 2–15 years. Their overall psychopathology was evaluated with the PANSS [37]. We tested for correlations between coherence in the gamma band and PANSS score using correlation analysis. All patients were screened by medical history, laboratory testing, and magnetic resonance imaging (MRI) or CT. Ten healthy right-handed male volunteers (mean age, 28.5±4.6 years) without psychiatric illness were used as controls. All subjects gave written informed consent after receiving oral and written explanations of the nature of the study. The ethics committee of Fujimoto Hayasuzu Hospital approved the experiments and confirmed that all experiments were performed in accordance with relevant guidelines and regulations.
Experimental Design
The standard auditory oddball paradigm was performed with a stimulus sequence in which the target tone was 2000 Hz with a probability of 20% and the non-target tone was 1000 Hz with a probability of 80%. Both stimuli were delivered binaurally by a sound simulator for a duration of 100 ms with a rise/fall time of 10 ms, an intensity of 80 dB SPL, and a constant interstimulus interval (ISI) of 2.3 s. Subjects were asked to silently count the number of target stimuli. Three sessions were recorded, each consisting of approximately 20 target stimuli. Short breaks were given to the subjects between sessions but head movement was not allowed during the testing or breaks. All subjects detected more than 90% of the stimuli.
MEG and EEG Recording
MEG data were recorded in a magnetically shielded room at Fujimoto Hayasuzu Hospital using a 160-channel whole-head MEG system (Yokogawa Electric Corporation, Kanazawa, Japan). The sensing coils in this system were 15.5 mm in diameter, with a 50-mm baseline and 23-mm separation between each pair of sensing coils. The subjects lay in a supine position with their eyes closed. MEG data were recorded through a 0.16–200 Hz band-pass filter with a sampling rate of 1000 Hz. Epochs containing eye movements were excluded from further analysis.
We also used EEG to confirm P300 activities. EEG was concurrently acquired in accordance with the international 10–20 system of placement at FP1, FP2, F3, F4, C3, C4, P3, P4, O1, O2, F7, F8, T3, T4, T5, T6, Fz, Cz, and Pz. All electrodes were referenced to linked earlobes. Electrode impedance was held below 5 kOhm. EEG data were recorded through a 0.53–120 Hz band-pass filter with a sampling rate of 500 Hz.
Localization of Oscillatory Power Changes in MEG
In the following analyses of oscillatory power changes and functional connectivity, we used only MEG data. To localize the ERD/ERS of gamma bands, we adopted a dual-state adaptive spatial filtering approach [38-41]. First, the magnetic field data of each subject for each stimulus condition were divided into two frequency bands of interest: low-gamma (30-50 Hz) and high-gamma (50-100 Hz). Second, the current density of the active period and the baseline period for each voxel with 7-mm grid spacing was obtained by adaptive spatial filtering, using a single spherical volume conductor model based on the individual MR image. The baseline period was defined as the time between 250 and 0 ms before stimulus onset, and the active period of interest was defined as continuously moving 250 ms windows from stimulus onset to 1000 ms after stimulus onset. Finally, we calculated the ratio of the current density of the active period to that of the baseline period as a measure of the power changes.
Functional Connectivity Analysis in MEG
Source-space analysis involves solving the inverse problem, estimating the time courses of activity in specific brain regions, and then examining the coherence between different regions. In source-space coherence analysis (or source-coherence imaging), a typical procedure involves first setting a reference point, called the seed point, and computing the coherence between the time courses from the seed point and another voxel’s location, referred to as the target location in this paper. A two-step procedure is required. In the first step, voxel time courses are estimated using an inverse algorithm. In the second step, the coherence measure is computed using the voxel time courses estimated in the first step. In this paper, the coherence is computed between the time courses of the seed voxel and each of the target voxels. By scanning through all target locations in a brain, a 3-D mapping of source coherence, a source-coherence image, with respect to the seed location can be obtained.
Source-space coherence analysis can be confounded by spurious coherence due to the leakage properties of the inverse algorithm employed. Such spurious coherence is typically manifested as an artifactually large peak around the seed voxel, called seed blur, in the resulting coherence images. This seed blur often obscures important details of brain interactions. To remove such spurious coherence, this paper adopted the imaginary part of the coherence, which is called the imaginary coherence (IC). The use of IC was originally proposed by Nolte et al. [42] to remove the spurious coherence caused by volume conduction in EEG sensor-space coherence analysis and was extended to MEG source-space coherence analysis by Sekihara et al. [43]. We adopted this technique and used IC as a functional connectivity measure since a large value of IC guarantees a reflection of the true brain interaction, whereas artifacts from volume conduction and seed blur are expected to yield small IC (Nolte et al. [42]).
We define the time course from the seed voxel as us(t) and the time course from a target voxel as ur(t); the spectra of the seed and the target voxels are denoted as σs(f), and as σT(f), respectively. The IC IST (F) is obtained by computing the correlation of these spectra
where the superscript * indicates the complex conjugate, and the bracket <.> indicates the ensemble average. In practical applications, this ensemble average is computed by averaging across multiple trials.Since we were interested in the interactions between areas with significant oscillatory changes, we defined two seed points in Montreal Neurological Institute (MNI) standard coordinates from the anterior cingulate cortex and the right temporal pole regions based on the group analysis results of oscillatory power changes. In the functional connectivity calculation, these seed points were warped from MNI standard coordinates to each individual subject’s coordinates by a linear-transform matrix using SPM8 (http://www.fil.ion.ucl.ac.uk/spm/).
IC was calculated for low-gamma (30-50 Hz) and high-gamma (50-100Hz) bands and for the active periods of interest defined as continuously moving 500 ms windows from stimulus onset to 1250 ms after stimulus onset. For source reconstruction, we used the same adaptive spatial filtering and voxel spacing as for localization of oscillatory power changes. We used a short-time Fourier transform with a Hanning window for spectral estimation.
Group Analysis
The significance of oscillatory power changes and IC across subjects was tested with Statistical Non-Parametric Mapping (SnPM; http://www.sph.umich.edu/ni-stat/SnPM/). The functional images were normalized to template brain images created by the MNI template in SPM8. A paired t-test between patients and controls corresponding to target stimuli was performed using a nonparametric pseudo-t statistic incorporating variance smoothing with a Gaussian kernel (full width at half maximum) of 20 mm. Voxels with differences at p < 0.05 (Familywise error rate, FWE) were considered statistically significant. Three-dimensional images were made on the MNI template brain using MRIcroGL (http://www.cabiatl.com/mricrogl/), and visualized as lateral (R-LAT and L-LAT), superior (SUP), anterior (ANT), posterior (POST), and medial (R-MED and L-MED) images. We tested correlations between IC and PANSS score using correlation analysis [37].
RESULTS
Oscillatory Power Changes During the Auditory Oddball Task in the Examination of MEG
In the examination of MEG,, functional maps during the oddball task showed deviation of ERD power in the low (30-50 Hz) and high (50-100 Hz) gamma bands in patients with schizophrenia compared to normal controls at FWE p<0.005 level , using SnPM Multisub paired test (2 conditions, 1 scan per condition; permutations: 512). Fig. (1). Low gamma ERD (30-50 Hz) power was significantly decreased in the right inferior temporal lobe and a small area on the left of the midline frontal lobes at 0-250 ms; it was also significantly decreased in the left midline dorsal frontal area, a bilateral small midline parietofrontal area, and a small area of the left upper temporal lobes at 250-500 ms. High gamma ERD (50 -100 Hz) power was significantly decreased in a small area of the left occipital lobe at 500-750 ms. No significant increases in ERD and ERS power were found.
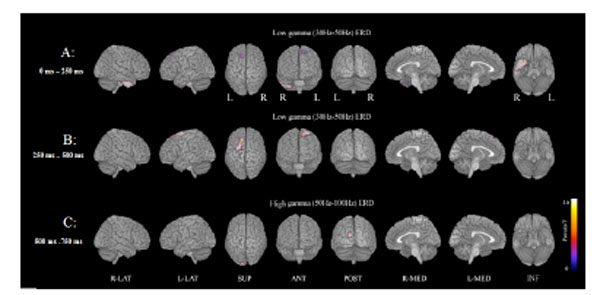
MEG examination shows deviation of ERD power corresponding to target stimuli in the low (30-50 Hz) and high (50-100 Hz) gamma bands in patients with schizophrenia compared to normal controls (A paired test, FWE p < 0.005).
A: Low gamma ERD (30-50 Hz) power is significantly decreased in the right inferior temporal and a small area on the left of the midline frontal lobes at 0-250 ms.
B: Low gamma ERD power is significantly decreased in the left midline dorsal frontal area, a bilateral small midline parietofrontal area, and a small area of the left upper temporal lobes at 250-500 ms.
C: High gamma ERD (50-100 Hz) power was significantly decreased in a small area of the left occipital lobe at 500-750 ms.
Decreased IC (Imaginary Coherence), and Correlation Between IC and PANSS Scores During the Auditory Oddball Task in the Examination of MEG
On the basis of functional maps of ERD and ERS power at low and high gamma bands during the auditory oddball task, we calculated numerical values of IC between seeds and target areas; seeds were selected in decreased areas in ERD and ERS power at the low and high gamma bands in each patient, and targets to the obtained seeds were manually searched in all other channels in the brain. IC in low and high gamma bands in each area in patients was compared to that of control subjects. Separate results for low and high gamma bands showed significant decreased IC in patients; Fig. (2) shows decreased IC areas between seeds and targets during the auditory oddball task (FWE: p<0.05) for each of four time windows.
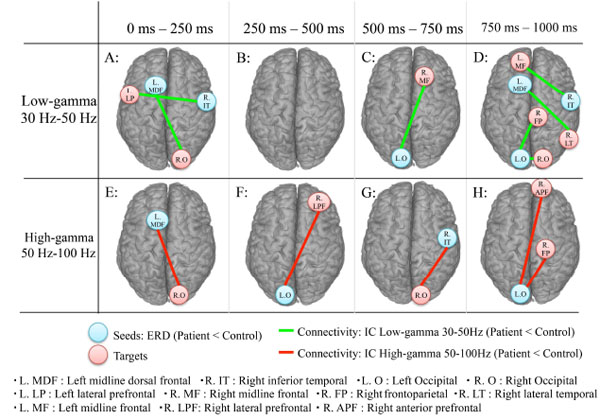
MEG examination shows decreased imaginary coherence (IC) between seeds and target areas in the brain during the auditory oddball task (FWE: p0.05) for each of four time windows. A-D: low gamma band. E-H: high gamma band.
A. IC decreases can be seen in low the gamma band between left midline dorsal frontal (seeds: L. MDF) and right occipital (targets: R O) areas and between right inferior temporal (seeds: R. IT) and left lateral prefrontal (targets: L. LP) areas from 0-250 ms.
B. For the low gamma band, no IC decreases can be seen during the 250-500 ms time window.
C. IC decreases can be seen in the low gamma band between left occipital (seeds; L. O) and right midline frontal (targets: R. MF) areas (500-750 ms).
D: 750-100 ms time window. IC decreases in the low gamma band are seen between left occipital (seeds: L. O) and right frontoparietal (targets; R. FP); between left occipital (seeds: L. O) and right occipital (targets: R. O); between left midline dorsal frontal (seeds: L. MDF) and right lateral temporal (targets: R. LT); and between right inferior temporal (seeds: R. IT) and left midline frontal (targets: L MF) areas.
E: IC decreases can be seen in the high gamma band between the left midline dorsal frontal (seeds: L. MDF) and right occipital (targets: R.O) areas during the 0-250 ms window.
F: IC decreases can be seen in the high gamma band between left occipital (seeds: L. O) and right lateral prefrontal (targets R. LPF) areas from 250-500 ms.
G: IC decreases can be seen in the high gamma band between right inferior temporal (seeds; R. IT) and right occipital (targets; R. O) areas from 500-750 ms.
H: IC decreases can be seen in the high gamma band between left occipital (seeds; L. O) and right anterior prefrontal (targets: R. APF) areas, between left occipital (seeds: Lt. O) and right frontoparietal (targets; R. FP) areas during 750-1000 ms.
Next, correlation coefficients between IC and PANSS scores were calculated in low and high gamma bands during the auditory oddball task in patients with schizophrenia. Significant correlations were found between PANSS scores and decreased IC in both the low and high gamma bands (Figs. 3-6). IC in the high gamma band between left occipital and right prefrontal lobe areas was negatively correlated with the conceptual disorganization score during the time window 750-1000ms (Fig. 3-B). Active social avoidance scores were negatively correlated with IC in the high gamma band between the left occipital and right prefrontal lobe areas during the same time window (Fig. 3-C). A significant negative correlation was observed between sum of positive scale scores and IC in the high gamma band between left occipital and right prefrontal lobes (Fig. 3-D); similarly, the IC in the high gamma band between left occipital and right prefrontal lobes from 750-1000ms was negatively correlated with the sum of negative scale scores (Fig. 3-E). A significant negative correlation was observed between the sum of negative and positive scale scores and IC in the high gamma band between left occipital and right prefrontal lobes from 750-1000ms (Fig. 3-F). IC in the low gamma band between left occipital and right prefrontal lobe areas during the earlier time window of 250-500ms was negatively correlated with conceptual disorganization (Fig. 4-B). Hallucinatory behavior scores was positively correlated with the IC in the low gamma band between left occipital and right frontoparietal lobe areas during the time of 250-500ms (Fig. 5-B). A significant positive correlation was also found between delusion and IC in the low gamma band between right temporal pole and left prefrontal lobe areas during the same time window of 250-500ms (Fig. 6-B).
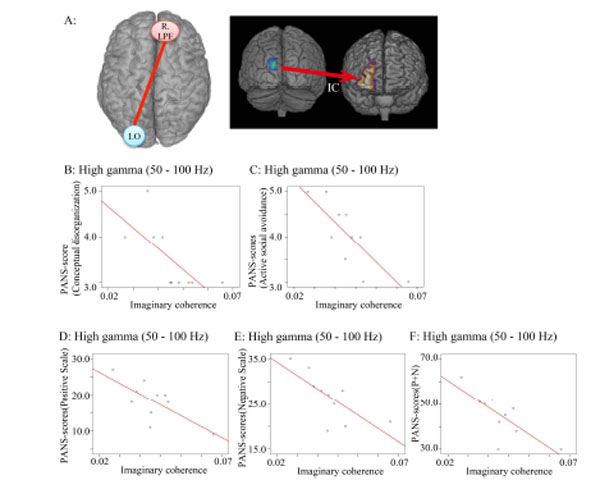
Correlation coefficients between PANSS scores IC in the high gamma band (50-100 Hz) during the auditory oddball task. Only significant correlations are shown.
A. IC between left occipital lobe (L. O) (seeds; MNI: X=-13, Y=-98, Z=26) and right lateral prefrontal lobe (R. LPF) areas (targets) was measured in the high gamma band during the 750-1000 ms window. This IC was used for all correlations in this figure.
B. Conceptual disorganization scores and IC (r=-0.701; p=0.024).
C. Active social avoidance in PANSS scores and IC (r=-0.807; p=0.005).
D: Sum of positive scale scores in PANSS and IC (r=-0.715; p =0.02).
E: Sum of negative scale scores in PANSS and IC (r=-0.724; p =0.018).
F: Sum of negative and positive scale scores in PANSS and IC (r=-0.773; p =0.009).
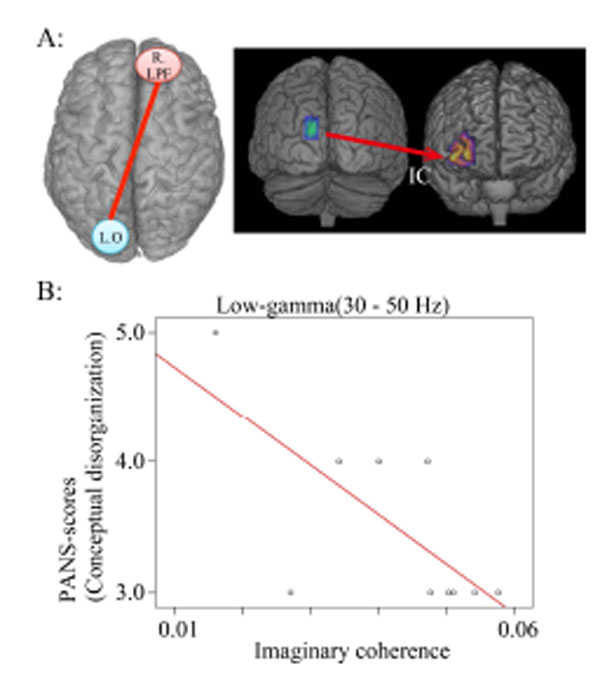
Correlation coefficients between hallucinatory behavior IC in the low gamma band during the auditory oddball task.
A. IC between left occipital (L. O) (seeds in MNI coordinates: X=- 13, Y=-98, Z=26) and right lateral prefrontal lobe (targets: R. LPF) areas are measured in the low gamma band during 250-500 ms.
B: Conceptual disorganization and IC (r=-0.706; p =0.023).
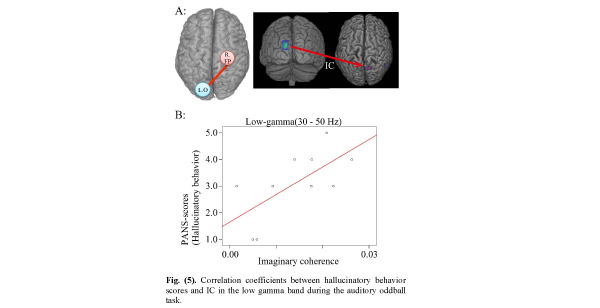
Correlation coefficients between hallucinatory behavior scores and IC in the low gamma band during the auditory oddball task.
A. IC between left occipital (L. O) (seeds in MNI coordinates: X=- 13, Y=-98, Z=26) and right frontoparietal (targets: R. FP) lobe areas during the time window from 500-750ms.
B. Positive correlation between hallucinatory behavior and IC. (r=0.666; p =0.035).
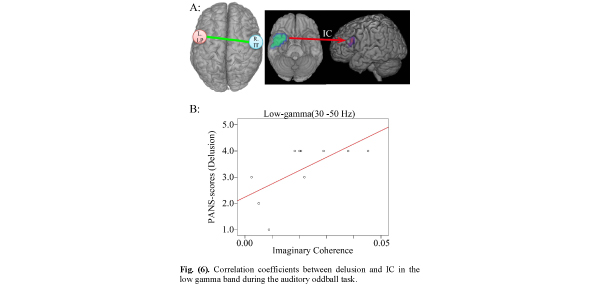
Correlation coefficients between delusion and IC in the low gamma band during the auditory oddball task.
A. IC between right inferior temporal pole (R. IT) (seeds in MNI coordinates: X=50, Y=14, Z=-32) and left lateral prefrontal (targets: L. LP) lobe areas are measured during 0-250 ms.
B. Positive correlation between delusion and IC between right temporal pole and left prefrontal lobe areas (r=0.655 p=0.04).
DISCUSSION
Obtained IC (imaginary coherence) in the patients with schizophrenia was respectively compared to those of normal controls in low and high gamma bands during the auditory oddball task. Separate results for low and high gamma bands showed significant decreased IC during the auditory oddball task (FWE: p<0.05) for each of four time windows (Fig. 2).
These findings may suggest that functional disconnection between some of the cortical areas within gamma frequency oscillations was related to symptoms of schizophrenia (Figs. 3, 4, 5 and 6) and reflect possible disconnection in selected neuronal networks. In addition, dysfunction in the high and low gamma bands may have different effects depending upon time from stimulus onset, Finally, the results suggest that the ICs in both bands have a complicated relationship to each other in the psychopathology of schizophrenia.
Only a few connections showed decreased IC, and this finding is difficult to interpret as true disconnection. However, abnormalities in IC in high and low gamma bands may be related to the disconnection hypothesis in cognitive symptoms of schizophrenia [44-50]. The notion of disconnection derives not only from neurophysiological data but also from cognitive models of schizophrenia dating back to Eugen Bleuler [44, 47]. According to Bleuler, the most elementary disturbance of schizophrenia is a lack of integration and loosening in associations, that is, splitting and destruction of thoughts, emotion, will and subjective affection [51]. Integration is generally understood in terms of effective connectivity, which refers explicitly to the influence that one neural system exerts over another, either at a synaptic or population level. Breakdowns of multiple constraint organization in brain units, such as neuron, group of neurons, brain system, or brain region could correlate with different symptomatic profiles in schizophrenia [52]. Decrease of functional connectivity among remote neural assemblies was shown in schizophrenia patients in the study of alpha activity, and from this perspective, the disorganization was interpreted as a disorder of the metastable balance between large scale integration (remote functional connectivity) and independent processing (local functional connectivity) in the cortex [53]. Large-scale integration may be conducted through the formation of dynamic links mediated by synchrony over multiple frequency bands [54]; neuronal communication is mechanically subserved by neuronal coherence, and activated neuronal groups oscillate and undergo rhythmic excitability fluctuations that produce temporal windows for communication [55, 56].
Negative Correlation Between Total Scores in PANSS and IC Between Left Occipital and Right Prefrontal Lobe areas in the High Gamma Band
The sum of total positive and total negative scores on the PANSS showed significant negative correlation with IC between left occipital lobe (seeds) and right anterior prefrontal lobe areas (targets) in the high gamma band during the 750-1000 ms time window. This finding suggests that the dysfunction in connectivity between left occipital lobe and right anterior prefrontal lobe areas may play an important role in the symptoms of schizophrenia. In addition, both positive and negative scores in PANSS each showed a significant negative correlation with dysfunction in connectivity between the left occipital lobe and right anterior prefrontal lobe areas. This may indicate that the distinction between positive and negative symptoms is not reflected in the connectivity between left occipital lobe and right anterior prefrontal lobe areas.
Moreover, symptoms in schizophrenia were related to dysfunction in connectivity primarily during the time window 750-1000 ms after stimulus onset, suggesting that dysfunction in connectivity was not only associated with the brain areas but also time after stimulus onset. It has been reported that high gamma band activity plays an important role in cortical computations through establishing correlations between the modulation of oscillations in the 60-200 Hz frequency and specific cognitive functions, and that high gamma band activity is impaired in neuropsychiatric disorders, such as schizophrenia [28]. Our results also showed that the timing of functional disconnection in the high gamma band may be related to symptoms of schizophrenia.
Negative Correlation Between the Conceptual Disorganization Score in PANSS Items and IC Between Left Occipital and Right Prefrontal Lobe Areas
Previous neuroimaging studies demonstrated structural and functional abnormalities in the frontal lobe regions for schizophrenia [57,58]. Fluoro-deoxy-glucose [F19] positron emission tomography (FDG-PET) showed reduced metabolism in the frontal area and increased metabolism in the occipital lobe (anterior/posterior gradient) [59-63]. Thus, dysfunction in the connectivity between left occipital and right anterior prefrontal regions in this study (Fig. 3) presumably reflected abnormalities in communication between anterior and posterior areas during cognitive processing and long-range coordination. In addition, conceptual disorganization scores showed a significant negative correlation with the dysfunction in connectivity between left occipital and right prefrontal lobe areas in the low gamma band (30-50 Hz) during a time window 250-500 ms from onset (Fig. 4). This finding suggests that conceptual disorganization was associated with not only the high gamma band, but with the low gamma band as well. However, a difference in time windows between dysfunction in the high and low gamma bands was noted as follows: 750-1000 ms for the high gamma band and 250-500 ms for the low gamma band. This suggests that conceptual disorganization was also related to the time window after stimulus onset.
Negative Correlation Between Active Social Avoidance Score in PANSS Items and IC Between Left Occipital and Right Prefrontal Lobe Areas
Both the active social avoidance scores and the conceptual disorganization scores were related to dysfunction in connectivity between the left occipital and right anterior prefrontal areas. However, the part of the right anterior prefrontal area related to social avoidance was located in a different area than that related to conceptual disorganization; it was located more laterally than the anterior prefrontal area related to conceptual disorganization. In addition, we found no other correlations in the low gamma band for active social avoidance, although conceptual disorganization showed a significant correlation to dysfunction between left occipital and right prefrontal brain areas during a window 250-500 ms from stimulus onset. This finding suggests that the active social avoidance symptom arose from a different dysfunction in connectivity than that of the conceptual disorganization symptom.
Positive Correlation Between Hallucinatory Behavior Score in PANSS items and IC Between left Occipital and Right Frontoparietal Lobe Areas
Although the IC between left occipital and right frontoparietal lobe areas was significantly decreased in the low gamma band 250-500 ms after stimulus onset, the IC showed a significant positive correlation with hallucinatory behavior on the PANSS inventory (Fig. 5). This suggests that the hallucinatory behavior score is associated with dysfunction in connectivity between the left occipital and right frontoparietal lobe areas. Furthermore, it suggests that the more IC was increased between left occipital and right frontoparietal lobe areas, the more the hallucinatory behavior score was increased, as long as the IC was decreased relative to control subjects. However, two problems arise. First, what happens if only low gamma frequency oscillations during 250-500 ms are involved in hallucinatory behavior, and second, how do high gamma frequency oscillations behave in that time? We believe further investigation is necessary before these questions can be answered.
Positive Correlation Between Delusion Score in PANSS Items and IC Between Right Temporal Pole and Left Prefrontal Lobe Areas
When IC was decreased relative to control subjects, the IC between right temporal pole and left prefrontal lobe areas showed significant correlations with delusion scores. Many studies have shown structural and functional abnormalities in temporal lobe brain regions in schizophrenia [13,58,64,65]. Schizophrenia patients showed smaller anterior, but not posterior, hippocampal volumes, and larger P50 and M50 gating ratios than controls [66]. The hippocampus is essential for spatial navigation and episodic memory and is related to network oscillations for coding, storing and recalling information [21, 67]. Gamma oscillations in the hippocampus are higher than in other brain regions, owing to the simple laminated architecture of the hippocampal circuit. Studies of rat hippocampus showed that gamma oscillation emerges from an interaction between the intrinsic oscillatory properties of interneurons and the network properties of the dentate gyrus [68], and intrahippocampal gamma oscillations emerge in the CA3 recurrent system, which entrains the CA1 region via its interneurons [69].
In addition, transient coupling between low- and high-frequency brain rhythms coordinates activity in distributed cortical areas, providing a mechanism for effective communication during cognitive processing in humans [70]. Frequency changes of gamma and theta waves are positively correlated [68]; the phase of the low-frequency theta (4-8Hz) rhythm modulates power in the high gamma (80-150Hz) band with stronger modulation occurring at higher theta amplitudes, and different behavioral tasks evoke distinct patterns of theta/high gamma coupling across the cortex [70-72]. Disturbances in oscillations in high gamma bands in this study may be related to cross-frequency coupling between gamma and theta oscillation. We reported that the ERS power in the theta band (4–8 Hz) during the oddball task in the schizophrenia patient group was significantly increased in the left temporal pole at 250–500 ms, and was significantly increased in the dorsal and medial frontal and anterior portions of the anterior cingulate cortex in both hemispheres, and the left lateral temporal regions at 500–750 ms, compared to the control group [13]. Dysfunction in the gamma band in schizophrenia, probably due to cross-frequency coupling, may reflect disturbances in the encoding of new information related to the hippocampal theta rhythm induced in the cortex via hippocampo-cortical feedback loops or vice versa.
Limitations and Possibility of Future Investigation in IC in Gamma Frequency Oscillations Using MEG
The interrelation between psychopathology of schizophrenia and brain activity is one of the most important and interesting problems in psychiatry. Therefore, our findings obtained by examination of coherence in gamma frequency oscillations in schizophrenia patients represent a new perspective for approaching this problem. However, our findings must be circumspectly interpreted. In fact, interpretation of our findings encounters some fundamental problems, such as questions of how normal scores in PANSS have correlations with brain activity; whether they are different from correlations for patients with schizophrenia or not; whether gamma band oscillations are totally involved in elaborate aspects of information processing or not; whether we over-emphasize the interpretation of gamma band, relating this activity only to complex processing or not; whether large-scale gamma synchronization reflects binding processes that are specific for Gestalt perception or not; and whether gamma phase synchronization should be considered as a binding mechanism that is specific for the encoding of Gestalt-features or not.
The obtained results could also reflect medication used and not schizophrenia itself. All patients were medicated by antipsychotics, and those effects must be considered. However, effects of antipsychotic drug are difficult to evaluate. General slowing of EEG frequencies has been reported as a consequence of neuroleptic medication, but differences in slow wave activity in patients on and off neuroleptics might be the consequence of medication or of symptom differences [73]. The latency in P300 does not appear to be related to medication [74], and changes in P300 amplitude do not seem to be affected by antipsychotic medication [8]. Attenuation of the P300 in the frontal areas was greater in unmedicated patients and during the first episode of schizophrenia [75]. 5-HT promotes the theta rhythm and facilitates learning [76]. Further investigation is required to determine the relationship between medication and gamma frequency oscillations.
Findings in this study were only obtained during the auditory oddball task, but not during resting conditions, although patients suffer from psychotic symptom in resting conditions as shown in PANSS scores. Therefore, strictly speaking the design of study makes it difficult to answer questions on the direct relationship between the symptoms of schizophrenia and functional connectivity in the brain, and further investigation is requested.
Finally, ten subjects in this study may be insufficient to establish interrelation between psychopathology of schizophrenia and reduced coherence in gamma frequency oscillations in the brain activity. Although our study was performed by manual data processing of coherence, which took enormous time and effort, measurement of coherence in the low and high gamma activities using MEG may be indispensable in clinical psychiatry, if more advanced technology is developed.
In conclusion, dysfunction in IC in low (30–50 Hz) and high (50–100 Hz) gamma frequency oscillations, using newly developed coherence analysis of MEG data, was related to some symptoms in male schizophrenia patients during the classical auditory oddball task. Functional disconnection of high and low gamma bands in auditory oddball task may play an important role in the auditory processing in schizophrenia patients. MEG examination of the gamma band using IC analysis opened a new perspective to study correlations between symptoms of schizophrenia and dysfunction in connectivity in the brain.
This study was supported by Grants from Yokakai Association. All authors report no biomedical financial interests or potential conflicts of interest.
CONFLICT OF INTEREST
The authors confirm that this article content has no conflicts of interest.
ACKNOWLEDGEMENT
Declared none.

