All published articles of this journal are available on ScienceDirect.

Advancement in Diabetic Retinopathy Diagnosis Techniques: Automation and Assistive Tools
Abstract
Introduction:
Diabetic retinopathy (DR) is a condition in which the retina of the human eye is impaired. If not properly treated, the condition may spread throughout the eye and result in irreversible blindness. There is a shortage of qualified ophthalmologists in developing nations, and there is very low knowledge of this condition. However, it is feasible to provide initial treatment to patients by integrating automated instruments and treating the illness before it reaches an incurable stat.
Objectives:
Identifying the various processes involved in identifying diabetic retinopathy, including preprocessing, feature extraction, segmentation, and classification. The work being discussed focuses on different detection approaches for diabetic retinopathy, specifically on CAD (Computer-Aided Diagnosis) models that are based on various AI (Artificial Intelligence) and image processing technologies.
Computer-aided diagnosis (CAD) systems are designed to assist medical professionals in the diagnosis of various diseases, including diabetic retinopathy. CAD systems use various algorithms and image processing techniques to analyze medical images and extract relevant features for classification. By using AI and image processing technologies, CAD systems can help to automate and standardize the diagnostic process, improving accuracy and efficiency.
Methodology:
To analyze the different strategies for detecting diabetic retinopathy, reputable publications and conferences are mined for research materials. The papers will be from the most recent years and will be categorized depending on the methods employed, such as machine learning, deep learning, etc. Each study is evaluated based on its technique, findings, dataset, and pros and cons.
Results:
The data shows that journals account for most of the work in this study (51%), with conferences accounting for 40% of the work and book chapters accounting for 9%. In addition, the data depicts a year-by-year study of work relevant to diabetic retinopathy detection. The major data is available on Google Scholar compared to Elsevier and Science Direct for research precision. Google Scholar has 60% data, Elsevier has approximately 10%, and Science Direct has approx 30% data on diabetic retinopathy detection.
Conclusion:
The conclusion suggests that to achieve high accuracy in detecting diabetic retinopathy, hybrid techniques should be developed in the future. This may involve combining multiple approaches, such as machine learning algorithms, image processing techniques, and human expertise, to create a more comprehensive and accurate diagnostic tool. By using a hybrid approach, it may be possible to overcome individual techniques' limitations and improve the accuracy of diabetic retinopathy detection. Further research and development in this area may lead to more effective screening and treatment for diabetic retinopathy, ultimately improving patient outcomes.
1. INTRODUCTION
The increasing prevalence of diabetes on a global scale has necessitated the implementation of population-centric diabetic retinopathy (DR) diagnosis strategies to provide rapid and responsive retinal imaging for extremely large subject groups while minimizing inappropriate recommendations to retinal specialists. Identifying diabetic retinopathy involves many processes, including pre-processing, feature extraction, segmentation, and classification. In this work, the different detection approaches for diabetic retinopathy are discussed. In this work, CAD (Computer-Aided Diagnosis) models based on several AI (Artificial intelligence) and image processing technologies are addressed. To aid researchers, we also highlight the limits of existing CAD frameworks and potential developments. Additionally, this study compares possible CAD systems to established systems in terms of universal metrics so that they may be assessed statistically. The comparisons show that more advanced CAD systems are needed to help doctors make the right diagnosis of DR disease.
1.1. Diabetic Retinopathy
Diabetes-related retinopathy is the leading cause of visual loss globally. Several abnormalities in the fundus of the eye influence the retinal microvasculature at the onset of this condition [1]. These abnormalities include microaneurysms and/or pinpoint hemorrhages, excessive fluid and protein leakage from blood vessels, exudates, and capillary closure. The dynamics of microaneurysms increase the risk that laser eye surgery must be developed concurrently. Lesions caused by DR are often considered reversible, and retinopathy may progress gradually in the early stages of the disease. Repeated screening of people susceptible to these early lesions is expected to be recognized as an emerging discovery for enhancing retinopathy recovery. The primary symptoms of diabetic retinopathy [2] include fluctuating and flashing vision, blurred vision, and abrupt vision loss. Even in individuals with NDPR symptoms, fundus imaging may detect numerous retinal abnormalities, such as MAs (microaneurysms), hard exudate, and hemorrhages. PDR is the most advanced phase of DR. Neovascularization is the primary characteristic of this stage. This phase may result in severe blindness in individuals [3, 4]. Patients may have substantial vision loss during this phase if new abnormal vessels leak blood into the vitreous hemorrhage or if traction retinal division is present. DME is one of the leading causes of blindness in diabetic people. DME may manifest at any stage of DR, distorting visual images and diminishing eyesight. Self-diagnosis of diabetic retinopathy will save both time and money. In addition, several image preprocessing approaches have been suggested to diagnose DR [5, 6].
1.1.1. Methods for Detection of Diabetic Retinopathy
The progression of DR, the leading cause of visual loss, differs from person to person. DME (diabetic macular edema) and PR (proliferative retinopathy) are two of the most important visual pressure complications (proliferative retinopathy). This is the primary cause of the significant increase in demand for cutting-edge treatments and procedures. These methods are anticipated to investigate the early phases of diabetic retinopathy skillfully and correctly. In modern times, the scientific community has devised several ways to diagnose DR quickly.
1.1.1.1. Screening of Diabetic Retinopathy
Eye disorders like DR are the most common cause of irreversible blindness in diabetic people. Early detection and treatment of DR significantly prevent negative outcomes such as decreased eyesight. OCT (Optical coherence tomography) is the best way to find DR because it can scan a larger area of the retina and has a higher axial resolution [9].
1.1.2. Retinal Imaging
Adaptive optics (AO) are employed to enhance optical methods. The noise in the front wave output is removed to achieve this. Using AO retinal imaging, ill and healthy eyes may be evaluated for space, mosaicism, and cell thickness. The retinal picture monitors the provoking diseases for the next fundus imaging segment. FA (Fundus fluorescein angiography) and OCT are the most commonly used techniques for retinal tomography. These sensory imaging systems play a pivotal function in treating patients with provocative instances for the precise characterization of the following [10, 11]. As an invasive technique, FA employs fluorescein. OCT is a costly imaging technique, unlike OCT fundus photography.
1.1.3. CAD-based Diabetic Retinopathy Detection
The purpose of CAD (computer-assisted diagnosis) is to identify DR and healthy photos using various criteria such as the area of Mas, EXs, textures, veins, node points, etc. Contextual information plays an important role in pharmacological imaging. Fundus imaging modalities have identified and differentiated lesions with high luminance using contextual information. On a CT scan, coronary calcification and hard EXs are detected based on this pertinent information [12, 13].
1.2. Diabetic Retinopathy Detection Process
A CAD framework is used to detect Diabetic Retinopathy. This framework can discriminate between pictures of DR and healthy retinas. A standard approach to DR (Diabetic Retinopathy) identification based on image processing consists of the following stages: preprocessing, Dark Object Segmentation, Spot Lesions Classification, and Rule-based Grading. Fig. (2) demonstrates a general DR detection technique [14]. The following steps are involved in the diagnosis of diabetic retinopathy:
1.2.1. Input Image
The input picture is the colored retinal image. Typically, a fundus imaging device captures a picture of the eye's retina. The result is a binary image. This graph shows how common spot lesions are and how bad diabetic retinopathy is [15].
1.2.2. Pre-processing
The preprocessing step assists in preparing retinal fundus images for segmentation. Due to the variation in picture quality based on image capture settings, image preprocessing is necessary. For instance, sometimes, picture capture occurs in complicated situations. This results in photos with uneven illumination, noise, or low contrast. These sorts of photos have a negative effect on the performance of segmentation algorithms [16]. Therefore, many picture preprocessing techniques must be applied to the acquired RGB image. Several prevalent preprocessing techniques are mentioned below:
1.2.3. Green-channel Extraction
With this technique, the colorful test images are separated into two groups depending on their size. Then, each image is downsized to 600 pixels by 800 pixels. With the components of color photography, the green channel produces the highest local contrast between pixel values (i.e., RGB). Due to the specific properties of microaneurysms and hemorrhages [17, 18], the green-channel IG of the RGB picture is eliminated first. The green image contains just 256 levels, although the majority of color visuals have 224 levels. Both computation time and storage space are reduced by this modification.
1.2.4. Optic Disc Removal
Various elements, such as the optic disc and fovea, are eliminated from the image of the retina at this step. Fovea appears as a black spot and is located in the middle of the retina of the eye [19, 20]. Typically, an optical disc has certain characteristics. These characteristics are distinguished by their great intensity, spherical form, and persistent magnitude. These characteristics indicate its specific location inside the image. There may be a few black lesions on the optic disc [21, 22]. These objects are sometimes misidentified as MAs or HAs. Therefore, ablation of the optic disc contributes greatly to the disappearance of these perplexing things. Due to the placement of the picture capture equipment, OD occurs in the center third of the image. Consequently, the approaches for optic disc removal consider the middle third of the green intensity picture as a region of interest (ROI) (region of interest). The picture of the retina of the eye is then processed using a filtering technique. The median filter is a common preliminary filtering technique for retinal pictures. The median filter prepares a picture without blurring sharp edges like the edges of the OD or retina.
1.2.4.1. Background Removal
The primary objective here is to reduce the background lighting differences in a picture. This method streamlines the analysis of foreground artifacts. This will represent the brightest portion of the picture. Initially, it is necessary to enhance the picture's contrast in order to get an optimum converted image for subsequent image analysis operations [23, 24]. Multiple factors contribute to the image's low contrast. Low or irregular illumination conditions, nonlinearity, or a limited camera dynamic range are significant issues (or imaging sensor). Researchers have developed many techniques for enhancing the contrast of collected photos over time. AHE (Adaptive Histogram Equalization), HE (Histogram Equalization), top-hat transform, bottom-hat transform, decorrelation stretch transform, CLAHE (Contrast-limited Adaptive Histogram Equalization), etc., are all techniques that are often used.
1.2.4.2. Dark Spot Segmentation
In this procedure, many measures are used to competently segment the dark spot lesions. Microaneurysms and hemorrhages are often classified as black spot lesions. These procedures include h-maxima transformation, thresholding, and feature extraction, respectively [25, 26].
1.2.4.3. H-Maxima Transformation
This stage applies the h-Maxima transform to the preprocessed pictures for further processing. This step's primary purpose is to reduce the quantity of brightness levels. Diminished luminance adds greatly to the subsequent actions. If 'I' is an intensity picture, the h-maxima transform suppresses all maxima in 'I'. This picture now includes values below a certain threshold, h. This is indicated by:
 |
In the above formula, RIδ denotes the morphological reconstruction using image dilation I. In general, all images have different quality levels. The quality of an image depends on the condition in which it is captured [14, 27].
1.2.4.4. Thresholding
This stage applies a thresholding technique to the intensity picture Hh in order to segment both MAs and HAs. Thresholding is a prevalent picture segmentation technique. The primary objective of this method is to generate a binary picture with pixel values of either 1 (dark spot) or 0 (light spot) (background). On the other hand, conventional thresholding methods can not provide exact results for all photos. Typically, a multilayer thresholding strategy is used to conduct the binarization process competently. A multilayer thresholding procedure is used on the images in this method before converting them to black and white. This method simplifies the choice of threshold values. This type of thresholding cuts down on the number of intensity levels in a grayscale image so that it can be turned into an indexed image [28].
1.2.4.5. Feature Extraction
The thresholding technique causes blood vessels and excessive pixels to appear as false positives in the resulting binary image. Therefore, various post-processing techniques should be used to refine the picture and secure the necessary items. Typically, these items consist of MAs (Microaneurysms) and HAs (Haemorrhages).
1.2.4.6. Dark Spot Classification
Using key characteristics, it is possible to classify a variety of spot lesions. These characteristics include size, form, unevenness, sharpness of edge, intensity, color, and depth, among others. These lesions are diagnosed as cotton-wool patches, hard exudates, drusen, and microaneurysms. Numerous academics have given numerous classification methods for the risk-based categorization of disorders [29].
1.2.4.7. Severity Level Grading
The risk degree of diabetic retinopathy problems may normally be graded on four scales. As the scale rises, the severity of this illness grows. The first classification is “normal” or “no evident retinopathy.” This level indicates the retinal health of the eye. The second level is denoted by the term “moderate NPDR.” This level shows the existence of just microaneurysms (MAs) in the eye's retina. The likelihood of a large increase over a long period is minimal at each level. The subsequent stage is designated “moderate NPDR.” This level represents a significant increase in severity. The last stage of “severe NPDR” is the most dangerous stage of the DR (Diabetic Retinopathy) condition.
1.2.4.8. Classification Algorithms
After extracting the important characteristics from the retina picture, the following step is to apply a classification algorithm to these features so that the illness may be categorised according to its risk level. The values obtained from measuring all the extracted characteristics are sent to various classifiers. The following are some prevalent categorization algorithms:
1.2.4.9. Support Vector Machines
Typically, SVMs are used for classification purposes. However, this approach may be used to solve classification and regression issues. This method is capable of handling a multitude of continuous and categorical variables [30]. In this method, a hyperplane is formed in the multidimensional space to enable the separation of all classes. This method creates the optimal hyperplane repeatedly. This hyperplane is often used to reduce mistakes. This approach is based on the exploration of a maximum marginal hyperplane (MMH). This hyperplane can partition the dataset into classes optimally. In this approach, the data points closest to the hyperplane are denoted by support vectors [31]. These points calculate margins to enable a more efficient description of the separation line. These factors have a vital impact on the construction of a classifier. These data points effectively segregate the provided dataset. The margin is shown by the distance between the two closest spots. This method picks a hyperplane from the support vectors in the given dataset that has the largest margin.
1.2.4.10. K Nearest Neighbor Classifier
(K-Nearest Neighbors) is a widely used machine learning (ML) method. This algorithm performs classification operations with proficiency. This method is an algorithm for supervised machine learning. This method may serve several functions, including intrusion detection, data mining, and pattern recognition. This approach cannot be utilized in practical situations due to its non-parametric character. This indicates that this method makes no assumptions about data arrangement [32]. This method utilizes some previously collected data. This information is called “training data.” This data conducts a feature-based categorization of coordinates into groups. This method calculates the distance between points in a data set. The term for this distance is the Euclidean Distance. Using the following formula, the distance between data points may be calculated:
 |
In this formula, the variable ‘n’ represents the number of dimensions or features in machine learning. According to the assumption, the data point located at the minimal distance from the test point belongs to the same class a test point has. This formula does the same in n number of dimensions. Therefore, this formula can be easily implemented with n number of features.
1.2.4.11. Decision Tree
The decision tree is a popular categorization and prediction technique. The decision tree's configuration resembles a tree. In this design, each internal node represents a feature test. The branches of this tree indicate the tested outcomes [33]. Moreover, each leaf node is assigned a class label. This is the last node in the tree. The source set is partitioned into subgroups for tree learning based on a feature value test. This procedure is performed for every resulting subset. This process is known as recursive partitioning. The recursion ends when a subset at a node gives the same value as the target variable, or when partitioning no longer adds values to the predictions. The construction of this classifier requires no subject expertise or parameter setup. Consequently, this classifier simplifies the knowledge discovery analysis process. This classifier is capable of processing large amounts of data. This classifier often produces very exact results.
2. LITERATURE REVIEW
2.1. Diabetic Retinopathy Detection based on Feature Extraction
Harini R et al. introduced a novel method based on FCM and morphological algorithms [34] in 2016. The SVM (Support Vector Machine) classifier was used to categorize the DR (Diabetic Retinopathy) pictures based on certain parameters. The given method had 96.67 percent accuracy, 100 percent sensitivity, and 95.83 percent specificity. Arisha Roy et al. proposed the FCM (Fuzzy C Means) to identify exudates and the Convex Hull method to remove and detect OD (2017). The SVM (Support Vector Machine) model was used to categorize typical retinal fundus pictures [35]. This framework had a classification accuracy of 96.23 percent. The results demonstrated that the proposed framework was effective. Choudhury et al. (2016) proposed Fuzzy C Means and morphological approaches to extract characteristics and categorize whether a patient was normal or diabetic using SVM (Support Vector Machine) [36]. The findings showed that the recommended method was 97.6% effective. Sarwinda et al. (2017) developed a CLBP model to identify DR (diabetic retinopathy) using the STARE database [37]. The EM-PCA was applied to identify characteristics, and the KNN (K-Nearest Neighbor) classifier was developed. The results of the tests demonstrated that the developed model gave excellent sensitivity of around 98% and specificity of approximately 97%. Yu et al. (2017) proposed a CAD (computer-aided diagnosis) to diagnose DR (Diabetic Retinopathy) [38]. The CNN (Convolutional Neural Network) model was used to detect the exudates pixel-by-pixel. The morphological method was used to extract candidate locations for possible exudates. Based on the experimental findings, the accuracy of the predicted model was determined to be 91.92 percent, while its sensitivity and specificity were determined to be 88.5% and 96%, respectively. Hatua et al. (2021) devised a rapid and dependable solution using the Hadoop architecture for detecting DR (Diabetic Retinopathy). Using PCA (Principal Component Analysis) [39], the dimension of HOD characteristics was attenuated. The KNN (K-Nearest Neighbors) was aided with picture classification. The findings demonstrated that the new framework is superior to current methodologies. Randive et al. (2018) studied a model in which SDLTP (spherical directional local ternary pattern) was applied [40]. This method was used to extract the directional property in the 3D plane and to reduce the length of feature vectors using PCA (principal component analysis). The experimental results demonstrated that the analyzed model improved accuracy and precision. Table 1 compares known feature extraction strategies for the identification of diabetic retinopathy disease.
2.2. Diabetic Retinopathy Detection based on Segmentation
The decision tree is an important categorized and forecasting tool. The decision tree's configuration resembles a tree. In this approach, each internal node represents a feature test. The branches of this tree indicate the tested outcomes [34]. In addition, each leaf node receives a class label. This is the last node in the tree. The source set is separated into subgroups based on a feature value test for tree learning. This procedure is performed on each subset produced. This technique is known as recursive partitioning. The recursion ends when a subset at a node produces the same value as the target variable or partitioning no longer adds values to the predictions. This classifier's design does not need domain expertise or parameter setup. As a result, this classifier speeds up the knowledge discovery and analytical process. This classifier can process enormous amounts of data. This classifier often produces very exact results. This methodology used the Kirsch method to identify the edge and employed thresholding and HE (histogram equalization) to remove noise. As a consequence, it was discovered that the early DR detection concentrated only on the hard exudates and indicated them in the different pictures. Palavalasa et al. (2018) devised a novel approach for detecting hard exudates in relation to the lesion level [9, 41-44]. The exudative lesions were discovered using the approach of background subtraction. The sensitivity was 0.87, the F-score was 0.78, and the PPV was 0.76. Bui et al. (2017) proposed an automated segmentation approach with the goal of finding cotton wool patches in retinal images for the DR condition [25]. An NN algorithm was constructed for the learning process, while k-fold cross-validation was performed to evaluate the recommended technique. This algorithm has a sensitivity of 85.9 percent, a specificity of 84.4 percent, and an accuracy of 85.54 percent, as determined by testing. Praveena et al. (2019) developed an intermediate approach known as Super-pixel-based segmentation to identify DR (Diabetic Retinopathy) [45]. This method was consistent with human visual perception and could address the problem of insufficient data. The experimental findings demonstrated that the developed technology outperformed conventional methods. The comparison of segmentation strategies for DR illness is shown in Table 2.
| Author | Year | Technique Used | Dataset | Outcomes |
|---|---|---|---|---|
| Harini, et al. [34] | 2016 | FCM | DIARETDB0, DIARETDB1 | The presented approach obtained accuracy, sensitivity and specificity of 96.67%, 100% and 95.83% respectively. |
| Roy, et al. [35] | 2017 | FCM (Fuzzy C-Means) | MATLAB | This framework obtained classification accuracy of 96.23%. This classification accuracy defined the effectiveness of the recommended framework. |
| Choudhury, et al. [36] | 2016 | SVM (Support Vector Machine) | MATLAB | The results depicted that the suggested approach provided the efficacy of 97.6%. |
| Sarwinda, et al. [37] | 2017 | Complete Modelling of Local Binary Pattern | STARE database | The CLBP-SC achieved better sensitivity of 98% and specificity of 97%. |
| Yu, et al. [38] | 2017 | CNN (Convolutional Neural Network) | MESSIDOR | The experimental results acquired an accuracy of 91.92% from the projected model, its sensitivity and specificity were evaluated as 88.5% and 96%, respectively. |
| Author | Year | Technique Used | Dataset | Outcomes |
|---|---|---|---|---|
| Anupama, et al [41]. | 2017 | Image processing technique | DIARETDB1 | The presented technique performed well with regard to accuracy and efficiency. |
| Kumar, et al. | 2016 | Advanced segmentation schemes | MATLAB | The experimental results demonstrated that the introduced method provided the accuracy of 87% for the sensitivity and 93% for the specificity |
| Deperlıoğlu, et al [9]. | 2018 | HSV algorithm, V transform algorithm and histogram equalization | Kaggle | The overall accuracy was counted as 97%. This approach provided the sensitivity of 96.6%, specificity of 93.3%, recall of 93.3% and F-score of 93.3%. |
| Yaşar, et al [43]. | 2018 | Kirsch method and histogram equalization | DIARETDB1 | In the result, it had been observed that the early DR detection focused only on the hard exudates and marked these exudates on the various images. |
| Palavalasa, et al [44]. | 2018 | Background subtraction method and De-correlation method | DiaretDB | The sensitivity was counted as 0.87, F-score counted as 0.78 and PPV as 0.76. The recommended approach acquired more accurate and high-performance results than other existing methods. |
| Bui, et al [25]. | 2017 | An automated segmentation algorithm | DIARETDB1 | The tested outcomes revealed that this algorithm could perform the segmentation of cotton wool with sensitivity, specificity and accuracy of 85.9%, 84.4% and 85.54% respectively. |
| Author | Year | Technique Used | Dataset | Outcomes |
|---|---|---|---|---|
| Omar, et al [46]. | 2017 | An algorithm | DIARETDB1 database | The results depicted that the blood vessel and haemorrhages detection was counted as 98% and the detection of exudates was counted as 100%. |
| Alzami, et al [47]. | 2019 | RF (Random Forest) | MESSIDOR | The testing outcomes revealed that the fractal dimensions had the ability to differentiate normal patients and DR patients. |
| Yalçin, et al [14]. | 2018 | CNN (Convolutional Neural Network) | MESSIDOR | This approach showed accuracy rate of 98.5%. In contrast to the conventional techniques in which the feature set was generated manually, the presented algorithm constructed by itself |
| Suryawanshi, et al [48]. | 2017 | A dual-layer feed-forward network | MATLAB | The presented technique yielded a maximum accuracy rate |
| Wan, et al [50]. | 2018 | AlexNet, VggNet and GoogleNet | Kaggle | This recommended technique provided a high accuracy for classification that was counted as 95.68%. |
| Author | Year | Technique Used | Dataset | Outcomes |
|---|---|---|---|---|
| Kumar et al. [54] | 2018 | Histogram equalization (HE) and morphological process | DIABETDB1 | The presented technique provided asensitivity of up to 96% and a specificity of around 92% for detecting the DR disease. |
| Bhardwaj, et al. [55] | 2018 | pre-processing methods | DRIVE and STARE | The results revealed that the suggested approach provided the PSNR value within 25dB to 29dB. |
| Sharma, et al. [56] | 2021 | Weighted KNN (K-Nearest Neighbour), Cubic SVM and Simple Tree | DIARETDB0 and DIARETDB1 | The Weighted KNN (K-Nearest Neighbour) provided 85.8% accuracy; Cubic SVM (support vector machine) provided 87.2% and 88.6% from Simple Tree. |
| Prasannan, et al. [57] | 2018 | AHE (Adaptive Histogram Equalization) and NLM (non-local means) | MATLAB | The introduced algorithm provided an error rate of 0.12, specificity of 0.75 and precision of 0.80 |
| Andonová, et al. [58] | 2017 | CNN (convolutional neural network) with 4 convolutional layers | MESSIDOR dataset | The projected technique was proved applicable. |
2.3. Diabetic Retinopathy detection based on Classification
Omar et al. (2017) developed a detection technique for DR. All DR characteristics were categorized into multiple phases [46]. Using this method, these characteristics were identified. After testing, the detection of blood vessels and hemorrhages was determined to be 98 percent, while the detection of exudates was determined to be 100 percent. Alzami et al. (2019) developed a fractal dimension-based technique for detecting DR (Diabetic Retinopathy) [47]. This approach incorporated the RF (Random Forest) and used a MESSIDOR to execute the trials. The test results demonstrated that the suggested approach could distinguish between normal individuals and DR patients. Yalcin et al. (2018) studied a novel technique for the early detection of DR (Diabetic Retinopathy) using retinal pictures based on deep learning [14]. CNN was used in this strategy to categorize retinal pictures. This technique demonstrated a 99.5% accuracy rate. To do this, this algorithm's training phase uses both the CPU and GPU [48]. According to Suryawanshi et al. (2017), DR (Diabetes Retinopathy) is the leading cause of visual loss in diabetic people. This condition was caused by the presence of many lesions in the human eye. This study used a GLCM-based texture-based method for many lesions. This study also used a dual-layer feed-forward network with sigmoid output neurons (NN) to train the current scheme in order to optimize the accuracy rate of the presented approach by addressing the classification problem in pattern recognition. Wan et al. (2018) targeted CNN for the identification of diabetic retinopathy [49]. In addition, to transfer learning and hyper-parameters, AlexNet, VggNet, and GoogleNet were used to evaluate the performance of these models in classifying images of diabetic retinopathy. These models were trained on the publicly accessible platform Kaggle. The classification accuracy of this suggested strategy was 95.68 percent. Karami et al. (2017) presented a strategy based on Dictionary Learning (DL) to automatically diagnose DR (diabetic retinopathy) illness from digitally obtained retinal fundus images [50]. To identify the DR, the K-SVD (K-singular value decomposition) technique was applied. Thirty colored retinal fundus pictures were used for evaluating the presented approach. The method achieved an accuracy rate of 70% for normal photos and 30% for diabetic images. Firke et al. (2021) created a CNN (convolution neural network) to detect diabetic retinopathy [51]. This method used a picture to determine whether or not the patient had DR. There were 3,789 color retinal pictures used in the studies in order to train the developed model. The developed model had an accuracy of approximately 96.15 percent, sensitivity of approximately 79%, and precision of up to 89 percent. Suriyal et al. (2018) proposed a smartphone application called TDNN (Tensorflow Deep Neural Network) for the realistic detection of diabetic retinopathy [52]. On a total of 16,798 fundus pictures of the retina, this framework underwent training and development. The last layer categorized the result as either diabetic retinopathy or normal. This model's final accuracy was 73.3 percent. Jena et al. (2018) introduced the CNN method for detecting the leading cause of visual loss in DR (diabetic retinopathy) [53]. This recommended neural network consists of six convolutional layers. In addition, ReLu activation and maximum pooling were employed. The provided model was compared to other current methodologies, and a high-performance outcome was achieved. The given model has a DR illness detection rate of approximately 91.66 percent. The Table 3 compares the various methodologies used for the categorization of DR illnesses.
2.4. Diabetic Retinopathy Detection based on Pre-processing
Kumar et al. presented a method that used preprocessing approaches like green channel extraction, histogram equalization (HE), and morphological processes. The LSVM (linear support vector machine) was used to classify illnesses. The current approach for diagnosing DR disease has a sensitivity of up to 96% and a specificity of around 92% [54, 55]. Bhardwaj et al. (2018) advised using preprocessing approaches to identify diabetic retinopathy (DR). Multiple techniques were used to identify DR in color pictures of the retina automatically, and their advantages and disadvantages were studied. Several methods were used to examine retinal photographs. A range of image preprocessing processes were used to create the fundus images. A comparison was made between the suggested method and existing strategies in terms of MSE (mean square error), PSNR (peak signal-to-noise ratio), and RMSE (root-mean-square error) (root mean square error). In the simulation, many datasets, including DRIVE and STARE, were used. The findings showed that the recommended method yielded a PSNR value of between 25 and 29 dB. Sharma et al. (2021) proposed a system for automating the technique to identify DR (diabetic retinopathy) in which the fundamental image processing stages were merged with a greater emphasis on preprocessing so that picture characteristics could be retrieved [56]. The photos were categorized using the ML (Machine Learning) method. Weighted KNN (K-Nearest Neighbor) provided 85.8 percent accuracy, Cubic SVM (support vector machine) provided 87.2%, and Simple Tree provided 88.6%, according to the study. Prasannan et al. (2018) proposed a technique in which the picture was preprocessed using AHE (Adaptive Histogram Equalization) and NLM (non-local means) was used to denoise the image [57]. Various criteria, including accuracy, error rate, specificity, and precision, were used to evaluate the performance of these algorithms. In contrast to conventional methods, the proposed approach offered an error rate of 0.12, a specificity of 0.75, and an accuracy of 0.80. Andonová et al. (2017) proposed a CNN (convolutional neural network) technique with 4 convolutional layers for categorizing photos as diabetic or normal [58]. The MESSIDOR dataset was used to assess the proposed approach. The primary objective of this technique was to preprocess, transform, and normalize the photos to improve their quality and maximize the quantity of input data. The proposed method was shown to be applicable. Huang et al. (2020) devised an innovative and efficient process to identify bleeding from coarsely-annotated fundus pictures in DR (diabetic retinopathy) [59]. In this method, the picture is preprocessed, data refinement is taught, and the item is identified. The CNN (convolutional neural network) technique was used for this purpose. The IDRiD dataset was used to train the intended method. The findings of the trial indicated an average IoU of around 0.8715. Table 4 compares the various preprocessing procedures used for the diagnosis of diabetic retinopathy.
3. MAJOR FINDINGS
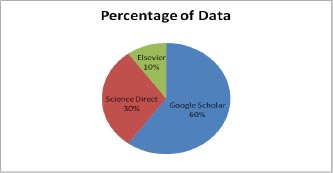
This section gives the format for the state-of-the-art review, a step-by-step technique for the previously covered literature. This study focuses on classifying and analyzing the available literature on diabetic retinopathy detection. This review identifies pertinent research publications from credible electronic sources and leading conferences on the subject. Inclusion and exclusion criteria were then used to minimize the number of articles under consideration. The final research papers were then selected based on a number of characteristics. This material is the result of exhaustive research. Various electronic database sources were studied for this research, including prominent electronic databases such as Google Scholar, Elsevier, and Science Direct. The relevant work of diabetic retinopathy detection algorithms is collected from the vast collection of data provided by search engines using inclusion criteria that are mostly dependent on the methodologies. The data indicates that journals account for the majority of the work in this research (51 percent), followed by conferences (40 percent) and book chapters (9 percent). In addition, the statistics illustrate a year-by-year analysis of work important to the diagnosis of diabetic retinopathy. Google Scholar offers the most information compared to Elsevier and Science Direct. On diabetic retinopathy detection, Google Scholar holds 60% of the data, Elsevier has around 10%, and Science Direct has approximately 30%. The data distribution is shown in Fig. (1).
In Fig. (1), the percentage of data sharing is shown in figure approx 60 percent of data is available on Google Scholar, 30 percent is available on Science Direct and a very less amount of data that is 10 percent is available on Elsevier.
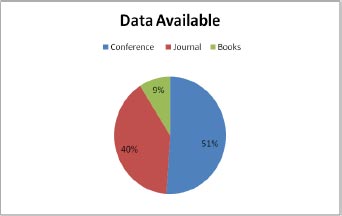
As shown in Fig. (2), the data are available through conferences, journal and books. The conference has approx. 51 percent of the total data, 40 percent data is available through journals, and 9 percent is available through books.
CONCLUSION
Diabetic Retinopathy (DR) is the most significant pandemic of the 21st century. Diabetes mellitus is the primary cause of this condition. In this illness, the complications of DM (Diabetes Mellitus) damage the retina of the eye. This illness is the leading cause of visual impairment in the United States of America. This disease's symptoms include blurred vision, difficulty distinguishing colors, floaters, and even complete blindness. To avoid diabetic retinopathy, diabetics need to get their eyesight examined at least once a year. Above fifty percent of the literature on diabetic retinopathy is examined to be published in conferences, and Google Scholar provides access to widely published studies. Science Direct is a highly regarded publishing company that generates around 30 percent of diabetic retinopathy publications. It is determined that all previously reported algorithms share four steps: preprocessing, segmentation, feature extraction, and classification. In the future, hybrid classification strategies must be provided to increase the performance of diabetic retinopathy detection models.
CONSENT FOR PUBLICATION
Not applicable.
FUNDING
None.
CONFLICT OF INTEREST
Dr. Ayush Dogra is the Editorial Advisory Board member for the journal The Open Neuroimaging Journal.
ACKNOWLEDGEMENTS
Declared none.

