All published articles of this journal are available on ScienceDirect.

Correlation of MRI Findings with ODI and VAS Score in Patients with Lower Back Pain
Authors Info & Affiliations
Abstract
Background:
In clinical practice, there is a very common discrepancy between the clinical findings of patients with lumboischialgia and the radiological findings.
Objective:
This research aimed to determine the degree of correlation between the ODI index and the VAS scale with degenerative changes in the lumbar spine found using MRI.
Methods:
The study included 100 patients, who were referred for an MRI of the lumbar spine and who had a clear clinical picture of lumboischialgia. Patients underwent MRI. Degenerative changes in the lumbar spine and discs were analysed. Patients were asked to answer the questions in the questionnaire about the subjective feeling of pain and functional status, and ODI and VAS scores were calculated.
Results:
There has been a statistically significant correlation found between the answers to the survey questions and the VAS score (p < 0.001). There was a significant correlation obtained between the level of degeneration and the disability index (p = 0.022), while the correlation with the VAS score has not been found to be significant (p = 0.325).
Conclusion:
This study has demonstrated a significant correlation between the VAS pain score and the ODI, as well as a significant correlation between the level of degeneration on MRI scans and the disability index; however, the correlation of MRI scan results with VAS score has not been found to be significant.
1. INTRODUCTION
Back pain is one of the most common reasons for going to the doctor. It is also a major public health problem because it is the most common cause of absenteeism and a large number of sick days. It is of particular importance that an increasing number of people develop chronic forms of disability. According to the 2007 Eurobarometer survey “Health in the European Union”, almost one-third of respondents felt musculoskeletal pain that impaired the quality of everyday life. The World Health Organization reports that “back pain is the most common of all musculoskeletal conditions, affecting almost everyone at some point and about 4–33% of the population at any given time”. Lumbar pain syndrome is now the leading cause of disability in the world.
Magnetic resonance imaging (MRI) is the method of choice for diagnosing the cause of lumboischialgia, given that it has the highest sensitivity and specificity compared to other imaging methods [1]. Currently, MRI is the imaging modality of choice, as it has the advantage of not using ionizing radiation and has good visualization capabilities, especially for soft tissue [2].
When it comes to advanced imaging techniques, MRI is ideal for evaluating patients with back pain, due to anatomical details, excellent tissue contrast, and the fact that it does not use ionizing radiation [3]. According to the recommendations of the American Association of Physiologists, the American Pain Society, and the American College of Radiology, MRI or computerized tomography (CT) should be performed in patients with back pain who have severe or progressive neurologic deficits or symptoms suggestive of a specific systemic disease, such as cauda equine syndrome, fractures, infections, or malignant diseases. Imaging is considered for patients whose back pain has not reduced after 6 weeks of drug treatment and physical therapy. According to the recommendations of these associations, patients with acute back pain should not undergo diagnostic imaging in the first 4-8 weeks, if there is no suspicion of a serious spinal disease [4-6].
Degenerative changes in the spine have high medical and socioeconomic importance. Imaging the degenerative spine is a common challenge in radiology because the pathogenesis of this degenerative process represents a biomechanically related continuum of changes, which can be identified with different imaging modalities [7].
In clinical practice, there is a very common discrepancy between the clinical findings of patients with lumboischialgia and the radiological findings, which is particularly important, because it can be problematic in the treatment of patients, especially when deciding on surgical treatment. There are many clinical tests for lumboischialgia, but the ODI (Oswestry Disability Index) and VAS (Visual Analogue Score) are the most widely used and most reliable, and include questions related to the intensity of lumbar spine pain and the nine most common daily activities. This research aimed to determine the degree of correlation between the ODI index and the VAS scale with degenerative changes in the lumbar spine found using MRI.
2. MATERIALS AND METHODS
The research was conducted as a randomized prospective clinical study from July until December 2019 at the Radiology Clinic of the University Clinical Center Sarajevo, in accordance with principles of the Declaration of Helsinki [8] on the rights of patients involved in biomedical research, with complete permanent protection of the identity and all personal data of patients, and in accordance with the regulation of identification data. Patients had no financial or any other interest with respect to participating in the research. No patient was included in the study without a signed informed consent.
The study was designed with the intention of analyzing only those patients who have a clinical diagnosis of lumbar/sciatica. The available medical documentation was used, from which we gained insight into the clinical findings (findings of a neurologist, orthopedist, or neurosurgeon), laboratory, and demographic data. The study included 100 patients of both sexes, aged between 18-65 years, who were referred for an MRI of the lumbar spine, and had a clear clinical picture of lumboischialgia (lumbago, ischialgia, or lumboischialgia). The study did not include patients younger than 18 and older than 65 years, patients without a clinical diagnosis of lumboschialgia, patients with a previous spine surgery or with other conditions that could interfere with the clinical picture of lumboschialgia in a way significantly affecting the score result (e.g., condition after stroke, amputation, a severe form of diabetes with neuropathy, etc.), patients with lumboschialgia or ischialgia caused by some other pathological process on the lumbar spine (inflammatory processes, tumors, trauma) and not degenerative changes, patients who have refused to participate in the research, and patients with metallic foreign bodies, an implanted pacemaker, and claustrophobia. The trial coordinator ensured allocation concealment from the clinical investigators by providing the research radiologist with a sealed envelope for the named patient prior to the baseline assessment of his/her MRI findings. When describing the MRI findings, the radiologist did not know which finding belonged to which questionnaire on the subjective feeling of pain and functional status. The researcher who was given the sealed envelope with the completed ODI and VAS questionnaires had no insight into the analyzed MRI images of the patient.
Patients underwent MRI on 1.5 Tesla (Magnetom, Avanto, Siemens Toshiba Titan) and 1.5 Tesla GE (Signa Excite) machines in the supine position, with Excite pillow under both the knees and an appropriate coil for the spine. A standard L-S spine protocol was used, with the following sequences: T1 and T2 turbo spin echo (TSE) sagittal, T2 TSE coronary, and spin-echoed sequence - T2 trim sagittal, and T1 and T2 TSE transverse term thickness of the layers on the recordings was 3.5-4 mm, with a distance between the layers of 0.5-1 mm. For sagittal images, the field of view was 24 to 32 cm, and for axial images, it was 20 to 24 cm, with a base resolution of 384. The flip angle was 90º, and the matrix was 256×192. Degenerative changes in the lumbar spine and discs were analyzed on all MRI scans. Patients were asked to answer the questions contained in the questionnaire about the subjective feeling of pain and functional status, and ODI and VAS scores were calculated. VAS scores have been presented on a scale of 0 - 10, with zero indicating no pain, 5 moderate pain, and 10 unbearable pain. The total ODI points have been divided by 50 and multiplied by 100 to get the percentage of incapacity. If the percentage was 0-20%, it was considered minimal disability; the percentage from 21-40% was considered as moderate disability, 41-60% was considered severe disability, 61-80% was taken as being disabled, and 81-100% represented immobile or exaggerating symptoms.
2.1. Statistical Analysis
All collected data were analyzed using the statistical program SPSS, version 16. Descriptive statistics was used to determine the arithmetic means (x̄), medians (x͂), standard deviations (SD), and standard errors. ANOVA, χ2 test, and Student's T-test were used. The degree of correlation was tested using the Pearson or Spearman correlation coefficient. Linear regression was used to quantitatively assess the correlation of two or more variables. The Shapiro-Wilk test was used to assess the normal distribution of continuous variables. The significance of the difference for independent continuous variables that did not follow a normal distribution was tested with the Kruskal-Wallis test if there were more than two examined groups. Statistical significance was accepted at the level of p<0.05.
3. RESULTS
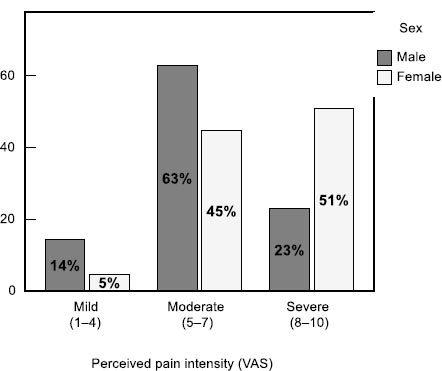
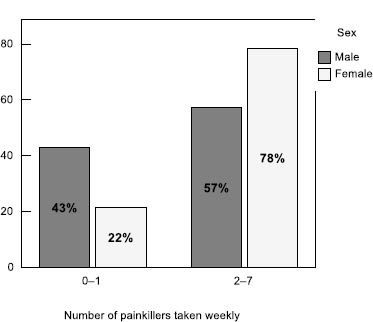
100 patients, 35 men and 65 women, were included in the study. The mean age of the patients was 47.6 years (σ = 10.6 years). Female patients were older than males (p = 0.001). The median age of women was 50.2 years, and for men, it was 42.8 years. In the examined sample, female patients felt more pain. The median intensity of pain in women was 8, which is why they took pills every day. In men, on the other hand, the median VAS was 6, and they took pills 3 times a week, which was significantly less compared to women (p < 0.001). In both sexes, back pain lasted 10 h a day (IQR = 15 h). The proportion of female patients (51%) having severe pain was significantly higher than the proportion of male patients (23%) (p = 0.015). Differences between the sexes also existed in the number of pills taken by patients during one week (p = 0.037).
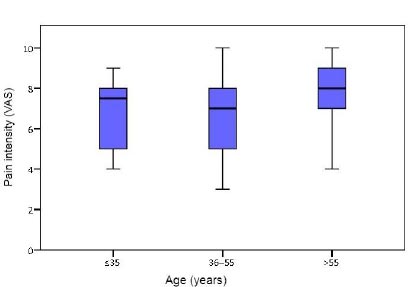
The intensity of pain in the spine was higher in older patients (p = 0.046). In most patients, the pain was more intense when walking than when lying down. Out of the total number of patients, 35% of them felt the same pain regardless of whether they were lying down or walking, while in most cases, the pain was twice or several times greater (Table 1, Figs. 1, 2).
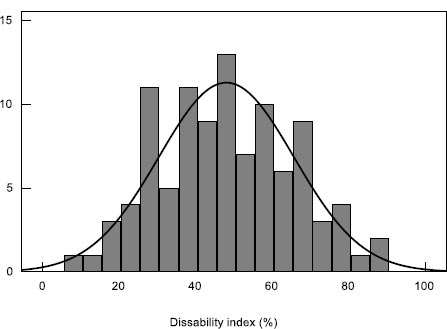
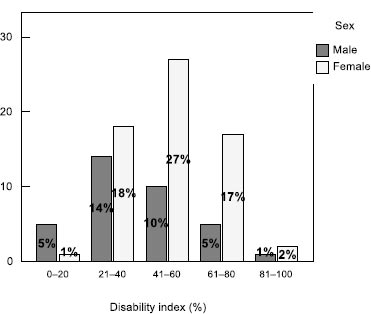
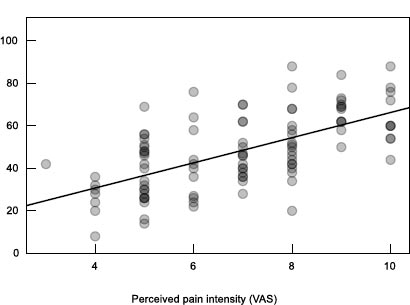
Physical abilities to perform daily activities were assessed using the Oswestry Disability Index (ODI) questionnaire (Table 2). There was a statistically significant correlation obtained between the answers to the survey questions and the VAS (p < 0.001). The slope of the linear regression curve was characterized by the parameter a = 7.2. The dispersion of the actual results in relation to the curve has been described with R2 = 0.336. The final results of the index (x̄ = 48%, σ = 19%) have been expressed as a percentage of disability (Fig. 3).
There was a significant correlation obtained between answers to survey questions and VAS (Spearman's ρ test, p < 0.001) (Fig. 4).
| - | Gender | Total | ||||||||||
|---|---|---|---|---|---|---|---|---|---|---|---|---|
| Male | Female | - | ||||||||||
| x̃ | Q1 | Q3 | IQR | x̃ | Q1 | Q3 | IQR | x̃ | Q1 | Q3 | IQR | |
| What is the intensity of your back pain (VAS)? | 6 | 5 | 7 | 2 | 8 | 5 | 9 | 4 | 7 | 5 | 8 | 3 |
| How many days a week do you take pain pills? | 3 | 0 | 7 | 7 | 7 | 2 | 7 | 5 | 4 | 1 | 7 | 6 |
| How many hours a day does your back hurt? | 9 | 3 | 20 | 17 | 12 | 8 | 20 | 12 | 10 | 5 | 20 | 15 |
| - | Back Pain Intensity (VAS) | Total | |||||||
|---|---|---|---|---|---|---|---|---|---|
| Mild pain (1–4) | Moderate pain (5–7) |
Severe pain (8–10) |
- | ||||||
| n | % | n | % | n | % | n | % | ||
| 1. Personal care (washing, dressing, etc.) | I can take care of myself normally without causing additional pain | 3 | 38% | 2 | 4% | 0 | 0% | 5 | 5% |
| I can take care of myself normally, but it causes extra pain | 3 | 38% | 21 | 41% | 6 | 15% | 30 | 30% | |
| It is painful to take care of myself and I am slow and careful | 2 | 25% | 19 | 37% | 9 | 22% | 30 | 30% | |
| I need help but I succeed in most self-care | 0 | 0% | 6 | 12% | 21 | 51% | 27 | 27% | |
| I need daily help with many aspects of self-care | 0 | 0% | 3 | 6% | 4 | 10% | 7 | 7% | |
| I do not dress (I stay undressed), I wash hard, and I stay in bed | 0 | 0% | 0 | 0% | 1 | 2% | 1 | 1% | |
| 2. Lifting | I can lift heavy things without additional pain | 1 | 13% | 0 | 0% | 0 | 0% | 1 | 1% |
| I can lift heavy things but it causes extra pain | 2 | 25% | 7 | 14% | 1 | 2% | 10 | 10% | |
| The pain prevents me from lifting heavy things from the floor, but I succeed if they are properly positioned, e.g., on the table | 3 | 38% | 21 | 41% | 10 | 24% | 34 | 34% | |
| The pain prevents me from lifting heavy things, but I manage to lift light to moderately heavy things | 2 | 25% | 16 | 31% | 12 | 29% | 30 | 30% | |
| I can only lift light things | 0 | 0% | 4 | 8% | 14 | 34% | 18 | 18% | |
| I cannot lift or carry anything at all | 0 | 0% | 3 | 6% | 4 | 10% | 7 | 7% | |
| P08. Walking | The pain does not prevent me from walking any distance | 1 | 13% | 4 | 8% | 2 | 5% | 7 | 7% |
| The pain does not prevent me from walking more than 1 km | 5 | 63% | 25 | 49% | 8 | 20% | 38 | 38% | |
| The pain does not prevent me from walking more than ½ km | 2 | 25% | 9 | 18% | 4 | 10% | 15 | 15% | |
| The pain does not prevent me from walking more than ¼ km | 0 | 0% | 10 | 20% | 17 | 41% | 27 | 27% | |
| I can only walk with a cane or crutches | 0 | 0% | 2 | 4% | 6 | 15% | 8 | 8% | |
| I spend most of my time in bed and have to crawl to the toilet | 0 | 0% | 1 | 2% | 4 | 10% | 5 | 5% | |
| P08a. How many steps can you walk on your toes? | 0 | 0 | 0% | 3 | 6% | 10 | 24% | 13 | 13% |
| 2 | 1 | 13% | 6 | 12% | 5 | 12% | 12 | 12% | |
| 5 | 1 | 13% | 6 | 12% | 8 | 20% | 15 | 15% | |
| 10 | 0 | 0% | 3 | 6% | 6 | 15% | 9 | 9% | |
| As much as I want | 6 | 75% | 33 | 65% | 12 | 29% | 51 | 51% | |
| P08b. How many steps can you walk in heels? | 0 | 0 | 0% | 8 | 16% | 12 | 29% | 20 | 20% |
| 2 | 0 | 0% | 8 | 16% | 7 | 17% | 15 | 15% | |
| 5 | 1 | 13% | 4 | 8% | 5 | 12% | 10 | 10% | |
| 10 | 1 | 13% | 2 | 4% | 4 | 10% | 7 | 7% | |
| As much as I want | 6 | 75% | 29 | 57% | 13 | 32% | 48 | 48% | |
| P09. Sitting | I can sit on any chair as long as I want | 0 | 0% | 0 | 0% | 0 | 0% | 0 | 0% |
| I can sit in my favorite chair as long as I want | 3 | 38% | 4 | 8% | 2 | 5% | 9 | 9% | |
| The pain prevents me from sitting for more than 1 hour | 3 | 38% | 22 | 43% | 4 | 10% | 29 | 29% | |
| The pain prevents me from sitting for more than ½ hour | 2 | 25% | 14 | 27% | 17 | 41% | 33 | 33% | |
| The pain prevents me from sitting for more than 10 minutes | 0 | 0% | 11 | 22% | 13 | 32% | 24 | 24% | |
| The pain prevents me from sitting at all | 0 | 0% | 0 | 0% | 5 | 12% | 5 | 5% | |
| P10. Standing | I can stand as long as I want without additional pain | 0 | 0% | 1 | 2% | 0 | 0% | 1 | 1% |
| I can stand as long as I want but it gives me extra pain | 1 | 13% | 2 | 4% | 1 | 2% | 4 | 4% | |
| The pain prevents me from standing for more than 1 hour | 0 | 0% | 12 | 24% | 3 | 7% | 15 | 15% | |
| The pain prevents me from standing for more than 30 minutes | 3 | 38% | 15 | 29% | 7 | 17% | 25 | 25% | |
| The pain prevents me from standing for more than 10 minutes | 4 | 50% | 21 | 41% | 26 | 63% | 51 | 51% | |
| The pain prevents me from standing at all | 0 | 0% | 0 | 0% | 4 | 10% | 4 | 4% | |
| P11. Sleeping | The pain does not prevent me from sleeping well | 5 | 63% | 12 | 24% | 2 | 5% | 19 | 19% |
| I can sleep well only with the use of tablets | 2 | 25% | 17 | 33% | 6 | 15% | 25 | 25% | |
| Even when I use tablets I get less than 6 hours of sleep | 0 | 0% | 10 | 20% | 9 | 22% | 19 | 19% | |
| Even when I use tablets I get less than 4 hours of sleep | 1 | 13% | 4 | 8% | 16 | 39% | 21 | 21% | |
| Even when I use tablets I get less than 2 hours of sleep | 0 | 0% | 7 | 14% | 7 | 17% | 14 | 14% | |
| The pain prevents me from sleeping at all | 0 | 0% | 1 | 2% | 1 | 2% | 2 | 2% | |
| P12. Social life | My social life is normal and does not cause any additional pain | 3 | 38% | 7 | 14% | 3 | 7% | 13 | 13% |
| My social life is normal but it increases the pain level | 4 | 50% | 13 | 25% | 3 | 7% | 20 | 20% | |
| The pain has no significant impact on my social life, except that it limits occupations, such as dance, etc. | 1 | 13% | 10 | 20% | 5 | 12% | 16 | 16% | |
| The pain has limited my social life and I do not go out very often | 0 | 0% | 17 | 33% | 19 | 46% | 36 | 36% | |
| The pain has limited my social life to my house | 0 | 0% | 4 | 8% | 9 | 22% | 13 | 13% | |
| I have no social life because of the pain | 0 | 0% | 0 | 0% | 2 | 5% | 2 | 2% | |
| P13. Traveling | I can travel anywhere without additional pain | 2 | 25% | 2 | 4% | 1 | 2% | 5 | 5% |
| I can travel anywhere but it causes me extra pain | 1 | 13% | 9 | 18% | 4 | 10% | 14 | 14% | |
| The pain is severe but I can handle trips longer than 2 hours | 3 | 38% | 19 | 37% | 9 | 22% | 31 | 31% | |
| The pain limits me to trips of less than 1 hour | 1 | 13% | 8 | 16% | 3 | 7% | 12 | 12% | |
| The pain limits me to short, necessary trips of less than 30 minutes | 1 | 13% | 10 | 20% | 13 | 32% | 24 | 24% | |
| The pain prevents me from traveling except to the doctor and the hospital | 0 | 0% | 3 | 6% | 11 | 27% | 14 | 14% | |
| P14. Sex life | My sex life is normal and does not cause additional pain | 2 | 25% | 6 | 13% | 1 | 3% | 9 | 10% |
| My sex life is normal but it causes extra pain | 6 | 75% | 25 | 54% | 8 | 22% | 39 | 43% | |
| My sex life is almost normal but very painful | 0 | 0% | 11 | 24% | 19 | 53% | 30 | 33% | |
| My sex life is very limited because of the pain | 0 | 0% | 2 | 4% | 6 | 17% | 8 | 9% | |
| I have almost no sex life because of the pain | 0 | 0% | 2 | 4% | 1 | 3% | 3 | 3% | |
| The pain prevents any sexual life | 0 | 0% | 0 | 0% | 1 | 3% | 1 | 1% | |
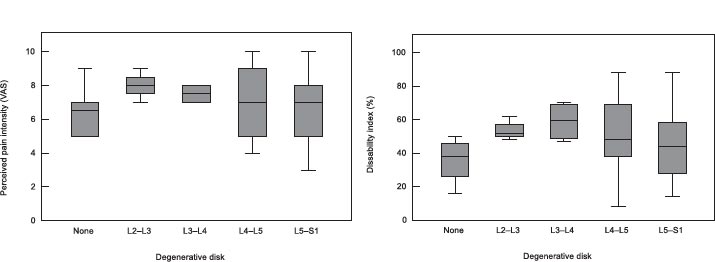
Interpretation of magnetic resonance imaging (MRI) findings included evaluation of disc degeneration, its location, and classification. In the examined group of patients, there was a significant correlation found between the level of degeneration and the disability index (p = 0.022), while the correlation with the VAS was not significant (p = 0.325). Disc degeneration at higher levels (e.g., L2–L3 or L3–L4) had a greater impact on patients' quality of life. Analysis of the level of disc degeneration in different groups of patients showed no significant differences between the sexes (p = 0.552), and the most common degenerations were at the level of L4–L5 and L5–S1, representing a total of 87% (Figs. 5, 6). On the other hand, patients younger than 35 years had less often disc degeneration, which was visible in the graph (p = 0.048). There was a significant correlation obtained between the level of degeneration and the disability index (Spearman's ρ-test, p = 0.022), while the correlation with the VAS was not significant (p = 0.325). Degenerations at higher levels had a greater impact on the quality of life of patients (Fig. 7).
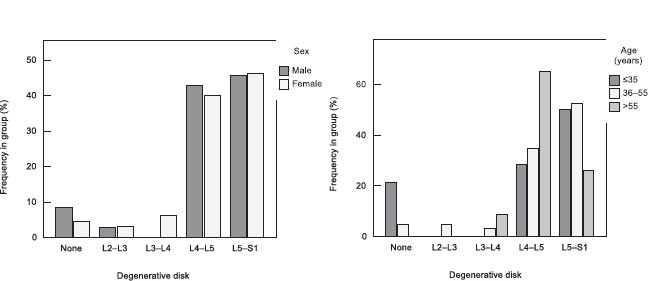
There was no significant difference found in the frequency of different levels of disc degeneration between the two sexes (Pearson's χ2 test, p = 0.552); (b) there was a significant difference obtained in the frequency of different levels of disc degeneration between the age groups (Pearson's χ2 test, p = 0.048); patients younger than 35 years did not have disc degeneration to a significantly lesser extent (Fig. 8).
4. DISCUSSION
Back pain is an increasingly common condition in the world, especially in low- and middle-income countries, which has a significant negative impact on the quality of life of sufferers. The growing impact of back pain on a global level is evidenced by recent research that shows that it is now among the ten biggest causes of disability [9, 10]. This research was conducted to examine the correlation between the degree of degenerative changes of the lumbar spine on MRI and lumbar-ischiatic complaints measured by the ODI index and the VAS scale. In our study, female patients felt more pain, with a median pain intensity of 8, which is why they took pills daily. In men, the median VAS was 6, and they took pills 3 times a week, which was observed to be significantly less compared to women (p < 0.001). In both sexes, back pain lasted 10 hours a day. A study conducted in 2014 in Spain reported the prevalence and intensity of all forms of chronic pain, including lumboschialgia, to be higher in women, which correlated with the results of our research [11].
In our research, in most cases (34%), pain prevented respondents from lifting heavy things from the floor, but they succeeded if they were appropriately positioned, e.g., on the table; in 38% of cases, the pain did not prevent from walking up to 1 km, during which the patients felt slight pain. However, pain prevented most of the patients from standing longer than 10 minutes (51%). The largest number of respondents (25%) could sleep only with the use of tablets. In the study by Kosa et al., the average ODI score was 58.84 (9.51), and the mean VAS score of the patients was 73.26 (24.37) mm, with both parameters increasing with age. A positive correlation was found between the VAS score and the ODI (r=0.49, P <.001), which correlated with the results of our research [12].
Kemppi et al. conducted a study to assess the relationship between the functional status of patients with back pain and the perceived importance of pain-related daily functions as assessed by the Oswestry Disability Index. Patients with back pain gave more importance to most functional abilities needed in daily life and self-management than pain intensity. However, when patients reported their current experience with function, the greatest difficulty was lifting. The authors concluded that the development of outcome measurement instruments for patients with back pain could benefit from taking the patient's perception into account [13].
Changes in disc degeneration are associated with the aging process, and a greater and increased prevalence has been found in older age groups of the population. The aging process causes an increased amount of keratin sulfate and collagen type 1 in the nucleus, with changes in the structure and composition of the extracellular matrix. Moreover, the hydration and structural framework of the disc are distorted, which further alters the behavior and function of the disc, making the disc more susceptible to injury. A disrupted segment of the spine due to disc degeneration causes pain.
In this study, a significant correlation (p = 0.022) was observed between the level of disc degeneration and the disability index in the examined group of patients, while the correlation with the VAS was not found to be significant (p = 0.325). Disc degeneration at higher levels (L2–L3 or L3–L4) had a greater impact on the patients' quality of life. Analysis of the level of disc degeneration in different groups of patients showed no significant differences between the sexes (p = 0.552), and the most common degenerations were at the level of L4–L5 and L5–S1, representing a total of 87%, which was found to be in agreement with other studies, in which the most commonly affected levels were L4/L5 and L5/S1 [14, 15]. In the study by Middendorp et al., in the majority of patients, 93.9% changes in the lumbar disc were at the level of L4/5, and in 89.8% of patients, changes in the lumbar disc were at the level of L5/S1. ODI scores ranged between 0 and 91.11% (arithmetic mean of 32.77% ± 17.02%). The largest group of patients (48.39%) had a moderate functional disability (ODI score between 21 and 40%) [16]. There was a weak but statistically significant positive correlation between IDD and ODI for both assessed levels of the lumbar region, which correlated with the results of our study. Increased lumbar disc degeneration on MRI goes along with increased ODI. Therefore, MRI is a strong indicator of the patient's clinical condition. However, back pain cannot be explained by imaging alone. Clinical correlation is imperative for adequate diagnostic progress in patients with back pain [16]. Associations between the degeneration of the intervertebral disc and the severity of pain symptoms in the lumbar spine were also found in the study by Takatalo et al. [17]. In the study by Bechar et al., the highest correlation with pain symptoms was found in the least degenerated disc, while the most negative correlation was found in the second most degenerated disc with Pearson correlation value ρ = 0.47−0.48, which was considered to be associated with a minor inflammatory condition of the severely degenerated disc [18]. Vagaska et al. showed degenerative features of the lumbar spine to be common in patients with nonspecific chronic LBP, with L4/5 being the most affected, as in our study. A significant correlation was observed between the severity of degenerative changes in certain structures of the lumbar spine (correlation coefficient ranging from 0.325 to 0.573), while no correlation was established between the severity of degenerative changes and pain [10].
In Jiang and Chen's research, the VAS and ODI scores of patients with chronic LBP in the groups with some degenerative disc changes were significantly higher than those in the group without any disc changes (p <0.05). The degrees of degeneration of L4/5 and L5/S1 were significantly higher than the degrees of other intervertebral discs (p <0.05), which was also found to be in correlation with the results of our study [19]. The main conclusion from a recent meta-analysis found little correlation between the VAS pain score and ODI, so extensive research was recommended to further assess the correlation between these two measures [20]. This study thus aimed to do this by clearly demonstrating the positive correlation between these two measures, supporting the need for further research into this topic.
The most significant limitation of this study was its multicenter nature, which may have led to variation in the demographic characteristics of patients and treatment modalities that may have caused different outcomes, especially with respect to treatment choice. In the future, a study should be conducted including a larger sample of patients of both genders and patients who use only the same type of therapeutic modalities. The patient cohort size for this study was moderate but strong enough due to the single radiologist involved in the analysis, maintaining the consistency of data.
CONCLUSION
This study has demonstrated a significant correlation between the VAS pain score and the ODI. This supports their simultaneous use in clinical practice. The paper determined the degree of incapacity and the intensity of pain of patients with lumboischialgia with the help of clinical tests for lumboischialgia, i.e., ODI index and VAS scale. Female patients were found to have a significantly higher disability index than males and to feel more pain.
LIST OF ABBREVIATIONS
| MRI | = Magnetic resonance imaging |
| CT | = Computerized tomography |
| ODI | = Oswestry Disability Index |
| VAS | = Visual Analogue Score |
| TSE | = Turbo spin echo |
| SD | = Standard deviations |
| ODI | = Oswestry Disability Index |
ETHICS APPROVAL AND CONSENT TO PARTICIPATE
This research was conducted after the obtainment of the approval of the ethics committee of the University Clinical Center Sarajevo (0302-56/13).
HUMAN AND ANIMAL RIGHTS
No animals were used in this research. All procedures performed in studies involving human participants were in accordance with the ethical standards of institutional and/or research committee, and with the 1975 Declaration of Helsinki, as revised in 2013.
AVAILABILITY OF DATA AND MATERIALS
The data supporting the findings of the article is available in the Clinical University Center Sarajevo, Department of Radiology.
ACKNOWLEDGEMENTS
Declared none.

