
Increased Brain Activation During the Processing of Spatially Invalidly Cued Targets
Abstract
In a spatial central cue Posner´s paradigm, positions in the vertical meridian were cued in order to evaluate the neuro-cognitive consequences in the processing of validly cued (VC) and invalidly cued (IC) targets. Sixty-four EEG channels were recorded and analyzed showing that IC targets produced an enhanced P3 component with respect to VC targets. With the purpose of reinforcing the idea of increased activation during IC targets and to define the areas in which the increased activation would occur, source localization was applied to the ERPs. LORETA and single dipole localization showed that the early P3 presented a localization in the dorsal part of the anterior cingulate cortex (dACC), while the late P3 was fitted by single dipole more posterior than the early P3, and LORETA added a source in the parahippocampal gyrus in addition to the already activated dACC. LORETA results also showed a differential activation of the inferior frontal gyrus when IC targets were processed. The previous results suggest that subjects prepare to accomplish the task upon specification of the cue. Therefore, when the IC target appears, it induces the activation of the frontal cortex including areas related to the conflict monitoring system and to the processing of unexpected events. The IC targets also induce the revision of internal models about the task, possibly by activation of the temporo-mesial surface. All the obtained current source differences indicate that a higher brain activation during IC trials with respect to VC trials occurs.
INTRODUCTION
The Contingent Negative Variation (CNV) is a slow negative potential indexing the preparation for an expected stimulus. The CNV occurs when a warning stimulus (S1) provides some information about the characteristics of an imperative stimulus (S2). During the S1-S2 period it is possible to observe task-specific preparatory activation of the motor and sensory areas that would be potentially needed to complete the task upon the information conveyed by the S1. Moreover, it is also possible to observe the activation of fronto-medial and fronto-parietal areas, which probably sustain the attentional endogenous effort during the CNV period [1-6]. The sensory-motor preparation is specific for the required response and for the stimulus sensory features. Therefore, the CNV period would represent the establishment of the neural set needed to complete the task indicated by the S1. A consequence of the task-specific preparation indexed by CNV is that the prepared neural set can be correct or incorrect depending on whether the S1 represents the characteristics of the S2 validly or invalidly. This fact is clearly demonstrated in the central cue Posner paradigm, in which the central cue can validly (VC trials) or invalidly (IC trials) indicate the spatial position of the upcoming target. A cost-benefit pattern appears associated to the invalidity or validity of the cue [7]. This effect is due to the preparation of the incorrect response for invalidly cued target stimuli [8, 4], but also to the activation of sensory specific areas [3-5].
It has been shown that, as a consequence of the incorrect preparation, there is an increase of the P3b component during invalid trials [8-12]. The effect on P3 is preceded by spatial attentional effects on the P1 and N1 components [1, 9-11]. Moreover, a P3a component has been recently described during invalid trials [12]. The presence of the P3a component during invalid trials has been interpreted as a novelty reaction to the IC stimulus.
On the other hand, there are an extensive number of results about the neural consequences of conflict monitoring [13] which have not been considered for attentional cueing paradigms. For instance, the so-called Error Related Negativity (ERN) [14-16] has been associated not only to the post-processing of errors, but also to the monitoring of the simultaneous activation of possible competing responses [13, 17]. The dorsal anterior cingulate cortex (dACC) would be one of the essential components of this conflict monitoring system [18, 19]. If the dACC is activated during IC trials, this activation would index the conflict arising from noticing the inaccurate spatial prediction of the target.
Several fMRI experiments have studied the central cue Posner paradigm [20-23]. The studies of Hopfinger et al. [20] and Small et al. [21] focused on the preparatory aspects rather than in the direct comparison of Valid vs. Invalid trials and, therefore, they are not related to the aim of present report. The studies of Vossel et al. [23] and Thiel et al. [22] computed direct comparisons between Invalid and Valid targets and, for this reason, they are more suited for direct comparison with present results than the other studies. Vossel et al. [23] obtained a higher activation in the invalid targets with respect to valid targets in the right hemisphere in areas including the inferior frontal gyrus, the middle and superior temporal gyrus, the posterior part of the superior temporal sulcus and the parahippocampal gyrus, and bilateral activation in the intraparietal sulcus (including the right supramarginal gyrus). Moreover, the left thalamus also showed a higher activation in the invalid targets with respect to valid targets. Similar results, although more bilateral, were obtained in a previous report by the same group [22]. The latter studies already showed an increased frontal activation in invalid trials with respect to valid trials. Vossel et al. [23] assigned to the reorienting of attention this extra activation of invalid targets with respect to valid targets. The localization approach that we will follow in present analysis would allow matching the EEG localization techniques with the fMRI results, but at the same time, would allow to separate different windows of activation based on the better time resolution of the EEG with respect to fMRI.
Given that the reported late ERPs effects of the invalidity of the cue have always been an increase of ERPs (P3a and P3b increase, already described in previous paragraphs), it is possible that source localization would reveal increased current sources (increased brain activation) when IC targets processing is compared to VC targets processing. In addition, this approach would provide some insight about the possible cognitive operations involved in the processing of spatial invalid predictions. For instance, the activation of the dACC during IC targets would be an indication of the activation of the conflict monitoring system.
The specific objectives would be (i) to test the ability of the LORETA algorithm to compute the differential brain activation during the processing of invalidly and validly cued targets, using a broad time window in which global differences in the processing of IC and VC targets would arise, and (ii) to compute the brain sources differentially activated by IC and VC targets in the medial brain wall in the time windows of the P3a and P3b by means of LORETA and single dipole localization algorithm in order to test if the dACC is activated by invalidly cued targets. The possible activation of other areas would suggest the recruitment of other cognitive processes. The two objectives are aimed to reinforce the idea of higher brain activation during IC trials with respect to VC trials. These objectives would be obtained from the reanalysis of a previously reported data set [12]. The main reason justifying the present reanalysis is that source localization would allow to give insight of the brain areas involved in the processing of IC targets that cannot be reached by Event Related Potentials (ERPs) analysis. In this sense, the LORETA and dipole localization algorithms have been previously used to add temporal information to the anatomical information [3, 4, 5]. The simultaneous use of two localization techniques (LORETA and dipole analysis) would allow to cross-validate the obtained brain localizations.The possibility of obtaining fine temporal and coarse spatial resolutions from the ERPs associated to the analysis of invalid cues is the main reason that justifies the reanalysis performed in this report, which is based on previously presented data [12].
METHODS
Subjects
Fourteen subjects (9 female and 5 male, 10 right-handed) between 21 and 36 years old (mean 24.5) took part in the experiment. The experiments were conducted with the informed and written consent of each subject following the rules of the Helsinki Convention.
Stimuli and Behavioral Paradigm
The stimulus presentation was computer-controlled (EEVOKE, ANT). Participants were seated 60 cm in front of a computer screen. They were instructed to fix their eyes on a white square in the center of the screen. The white square was on during the whole experiment in order to keep the central fixation. The complete trial period included a central directional cue that was on for 200 ms, and then, an attentive wait period lasting randomly between 1800 and 2000 ms (Fig. 1). The reason of choosing a variable attentive period was to focus the attentional resources of subjects on the spatial dimension rather than on the temporal dimension. Finally, a peripheral target subtending a visual angle of 0.91º and situated 8.3º eccentrically in the vertical meridian appeared (Fig. 1). Given that the directional central cue could indicate the correct or the incorrect direction in which the target would appear, two different conditions arose: validly cued targets (VC) [82% of trials) and invalidly cued targets (IC) [18% of trials). The higher number of VC trials with respect to IC trials is important in order to obtain validity effects [7]. If the probability of a target to appear in the upper or the lower hemifield is computed independently of the type of trial in which it is inserted, then the targets appear randomly with a probability of 0.5 in the upper or lower hemifield. The latter probability will be considered as the objective probability of a target to appear in the upper or lower hemifield, in opposition to a subjective probability that is induced by the central cue.
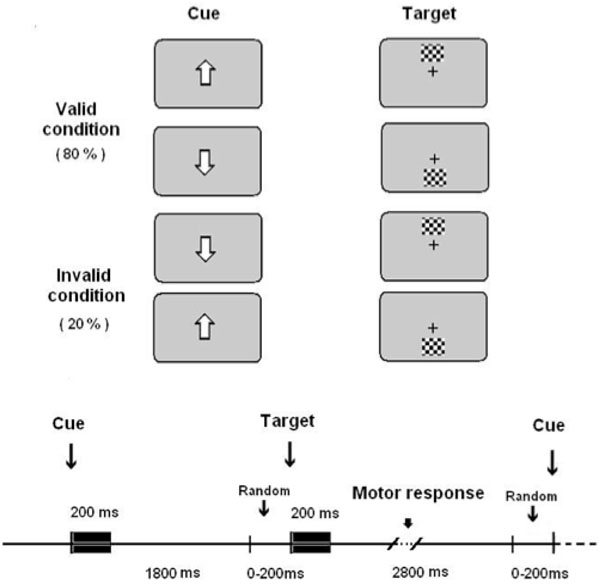
Experimental paradigm.Validly and invalidly cued targets were presented (upper part of the figure). They presented the temporal sequence showed in the lower part of the figure.
The subjects used the right hand to respond to the targets by pressing a joystick button. They used the index finger to respond to the targets presented in the upper visual field and the thumb to respond to the targets presented in the lower visual hemifield. The intertrial intervals were randomly selected between 2800 and 3000 ms. Subjects were presented with a total of 240 trials.
There were no training trials. However, given the simple nature of the task, no learning effects can be expected.
Behavioral Statistical Analysis
The behavioral results of this experiment have been previously described [12] and reflect the typical cost-benefit (validity/invalidity) effect described by Posner [7].
EEG Recording, Processing and Analysis
The EEG was recorded from 64 scalp sites of an extended version of the International 10-20 system, using tin electrodes mounted in an electrode cap (electrocap). All the electrodes were referred to the left mastoid. Impedance was maintained below 5,000 Ohms. Data were recorded in DC, the amplification gain was 20,000 (ANT amplifiers). They were acquired at a sampling rate of 512 Hz, using a commercial AD acquisition and analysis board (ANT). Recordings were averaged off-line using an artifact-rejection protocol based on voltage amplitude. All the epochs for which the EEG exceeded 100 microvolts in any channel were automatically discarded. 75% of invalid trials and 70.7% of valid trials were accepted for the analysis .
ERPs were obtained for each subject by averaging the EEG, using the switching on of the target as a trigger. The baseline was the interval 200-0 ms before target stimulus. The algebraically linked mastoids were computed off-line and used as reference for analysis purposes. Eye movements and blinks were monitored using the electrodes installed in the 64 channel cap, once careful checking of the sensitivity of AF7-AF8 to monitor horizontal eye movements and prefrontal electrodes (Fp1, Fpz and Fp2) to monitor vertical eye movements and blinks was carried out.
EEG Statistical Analysis
The statistical analysis of early P3 (time window of 250-300 ms) and late P3 (300-360 ms) have been previously described [12], showing a higher amplitude in the invalid condition with respect to the valid condition. Although the number of IC trials is much lower than the number of VC trials and, therefore, more noise is expected in the IC condition with respect to the VC condition, the increased noise in the IC trials should not affect the results given that the noise can be positive or negative over the real voltage value for the P3 in both IC and VC. This is not the case for the Event Related Spectral Power (ERSP), in which noise is always positive and the unequal number of trials between conditions can be critical.
Source Analysis
For source localization, two different approaches were used: single dipole localization on the difference waves [24] and the computing of the statistical differences between IC and VC trials in the current source space provided by the LORETA software [25, 26]. It must be remarked that both localization techniques have the limitations inherent to the inverse problem. However, if both techniques provide a similar result, it would be an additional support for the validity of the obtained inverse solutions. Rather than focusing on the merit of each approach, the similarity of results would allow cross-validating both localization techniques. The Brain Electrical Source Analysis (BESA) algorithm [24] was used in order to test the main source differentiating IC and VC trials by means of single dipole localization. For that, we used the difference wave obtained by subtracting the VC trials voltage from the IC trials voltage. The single dipole was fitted independently for each of the analyzed components and all dipole parameters were free to change. The use of the difference wave was justified because we were mainly interested in testing the differences between both conditions. The fitting was performed on the grand average in order to compare the dipole fitted to the statistical comparison performed on the group of participants with the LORETA technique.
Moreover, the Low Resolution Tomography (LORETA) [25, 26], which obtains non-invasively the activated areas, was used to find intracerebral differential sources of the possible P3a and P3b components when IC and VC trials were compared. This method computes a unique solution for the 3-D intracerebral current density sources imposing the constraint of the smoothest source configuration as the valid solution. This constraint is physiologically justified because the contribution to the scalp voltages of adjacent synchronized neural areas is higher than the contribution of non-synchronized areas. One of the main advantages of this method is that, by establishing tomographic brain imaging with the excellent time resolution of the EEG method, enables brain dynamics in the sub-second range to be studied.
The LORETA version employed in this study uses 2394 voxels that take account of gray matter and hippocampus in the Talairach digitized human brain. In order to determine whether a source was differently statistically activated or not for IC targets with respect to VC targets, pairwise comparisons between sources in the invalid and valid condition were computed, by using the non-parametric method as described by Holmes et al. [27]. This method uses the pseudorandomization t-test and is corrected from the problems of false positives arising from multiple comparisons. Areas with P < 0.1 or p< 0.05 were accepted as being differentially activated after the multiple comparison correction.
The LORETA analysis was applied to the whole epoch [100-700 ms) to equate the conditions in which fMRI signals are obtained. Afterwards, to take advantage of the better time resolution of EEG with respect to fMRI, a more narrow window to analyze the P3a (250-300 ms) and the P3b (300-360 ms) periods was selected.
All the activated sources will be reported for the whole epoch analysis . However, and in order to be more selective for the proposed objectives, we will only report the results on the medial surface for the P3a and P3b analysis . Please notice that we are not interested in obtaining the P3a and P3b sources, but in the differential activation between both IC and VC conditions, particularly in the possibility of detecting the differential activation of conflict monitoring related areas. Given that some of the previously described sources for conflict monitoring related ERPs are located in the medial side of the hemisphere, we will only mention the statistical differences for sources located in the medial surface. In fact, it must be remarked that one of the motivations to use source localization techniques was to show if the obtained sources overlap with areas previously related with conflict monitoring as the Anterior Cingulate Cortex [13, 6].
RESULTS
Fig. (2) shows the increased positivity in anterior (possibly P3a) and posterior (possibly P3b) P3 for the invalid condition with respect to the valid condition (statistics previously described in Gómez et al. [12]).
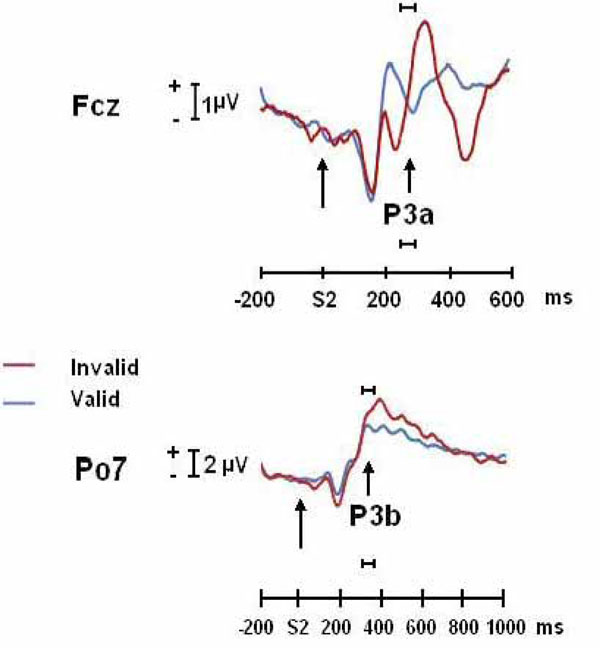
ERPs (FCz and PO7) of invalidly and validly cued targets conditions for the P3a and P3b components. The horizontal bar indicates the time windows in which Loreta and dipole analysis were computed.
The LORETA analysis of the whole epoch yielded statistically significant differences in the left superior parietal lobe and precuneus, the right inferior frontal gyrus, the right anterior middle and superior temporal gyrus, the right superior occipital gyrus (in the vicinities of the posterior middle temporal gyrus) and the right insula (see Fig. 3 and Table 1). With respect to the brain medial wall activation, the bilateral medial frontopolar cortex (including anterior cingulate), the right parahippocampal gyrus and the right posterior cingulate cortex were activated (the latter two areas forming a single cluster). The obtained medial frontopolar cortex activity will not be discussed in present report because any residual ocular activity would be located by LORETA in frontopolar locations.
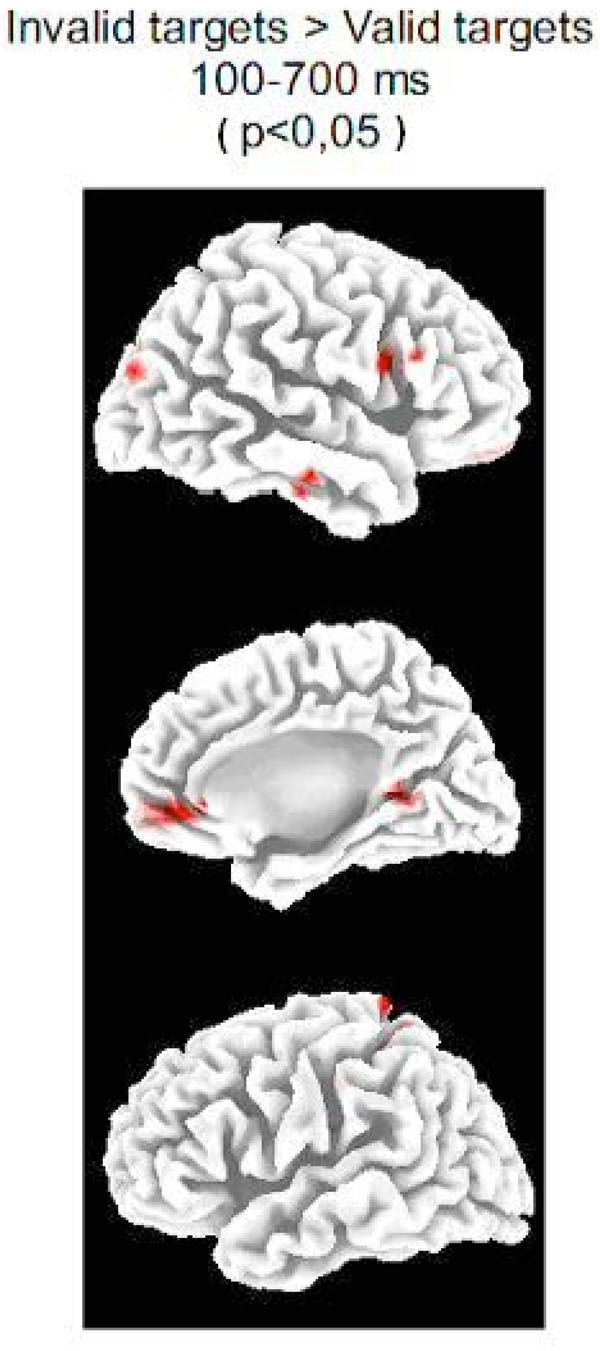
Source analysis .Statistical differences (the p-value appears in parentheses) of the LORETA solutions of IC and VC targets for the whole post-target epoch (100-700 ms) in the mesial and lateral surfaces of both hemispheres. Notice the statistically significant increase of activity in the Superior Occipital Gyrus (BA19) and Inferior Frontal Gyrus (BA 44 and 45) in the invalid condition with respect to the valid condition (see Table 1 for a complete description of areas activated differentially in the IC targets with respect to the VC targets).
Areas Presenting Statistically Significant Differences when Comparing LORETA Solutions Obtained for the ERPs of IC Targets and VC Targets. The Analyzed Time Window Corresponds to 100-700 ms. The Areas Indicated in this Table are Correlative to the Red Coloured Areas in Fig 3. (Except for the Insula which is not Visible in Fig. 3). The p-values Appear in Parentheses.
| LEFT LATERAL | RIGHT LATERAL | |||
|---|---|---|---|---|
| Posterior → Frontal | Frontal → Posterior | |||
| 100-700 ms | BA 7 | Superior Parietal Lobe | BA 44,45 | Inferior Frontal Gyrus |
| ( p<0.5) | BA 7 | Precuneus | BA 19,21,22 | Middle & Sup. Temporal Gyrus |
| BA13 | Insula | |||
| BA19 | Superior Occipital Gyrus | |||
| MEDIAL LEFT | MEDIAL RIGHT | |||
| 100-700 ms | BA 32 | Anterior Cingulate | BA 10 | Medial Frontal Gyrus |
| ( p<0.5) | BA 10 | Medial Frontal | BA 32 | Anterior Cingulate |
| BA 30 | Posterior Cingulate | |||
| BA 30 | Parahippocampal Gyrus |
BA: Brodmann area.
For the late positive components window, the LORETA analysis yielded statistically significant differences in the brain mesial surface (for further details see Fig. 4 and Table 2). The early P3 latency (possibly a P3a component) presented statistically significant differences between VC and IC conditions in the frontopolar medial cortex, the dACC (underlying the Supplementary Motor Area), the paracentral lobule and the lingual gyrus. For the late P3 latency (possibly P3b component), the differences between IC and VC targets were in the frontopolar medial cortex, the dACC, the precuneus and the parahippocampal gyrus. For both analyzed components, other non-reported differences were obtained in areas situated in the lateral surface. These results will not be discussed in present report given that it would exceed largely its main focus. Our main interest, from the localization point of view, was to show if the ACC cortex was activated differentially in IC and VC conditions, in order to demonstrate that the conflict detection area in the medial surface was activated in IC condition. The reason why the statistically significance was lower in the P3 windows with respect to the previously analyzed whole epoch would lie in the different timing for reaching the P3 peak of activity in different subjects, producing a diminished statistical effect.
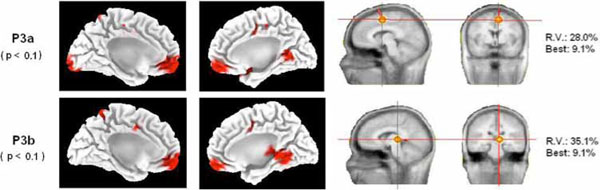
Source analysis .Left side of the figure: statistical differences (the p-value appears in parentheses) of the LORETA solutions of IC and VC targets for the P3a and P3b components in the mesial surface of both hemispheres. Notice that both components present a statistically significant increase of activity in the BA 24 (dACC) in the invalid condition with respect to the valid condition (see Table 2). Right side of the figure: single dipole localization of the difference wave obtained by subtracting the ERPs of the valid condition from the ERPs of the invalid condition. A single dipole is fitted for the time windows of the P3a and P3b. Notice that the P3a dipole fitting was located inside or in the proximities of the dACC cortex. The P3b single dipole was located more posterior. Best: residual variance (RV) obtained in a single time point of the considered time window.
Areas Presenting Statistically Significant Differences when Comparing LORETA Solutions Obtained for the ERPs of IC Targets and VC Targets. The Analyzed Time Windows Correspond to those Showed in Fig. 4. Only the Areas in the Medial Surface of the Hemispheres are Reported. The Areas Indicated in this Table are Correlative to the Red Coloured Areas in Fig. 4. The p-values Appear in Parentheses
| LEFT | RIGHT | |||
|---|---|---|---|---|
| Posterior → Frontal | Frontal → Posterior | |||
| P3a: | BA 18,17 | Lingual Gyrus | BA 11 | Medial Frontal Gyrus |
| ( p<0.1) | BA 31 | Paracentral Lobule | BA 24 | Dorsal Anterior Cingulate |
| BA 11 | Medial Frontal Gyrus | BA31 | Paracentral Lobule | |
| BA19 | Lingual Gyrus | |||
| P3b: | BA 7 | Precuneus | BA 11 | Medial Frontal Gyrus |
| (p<0.1) | BA 24 | Dorsal Anterior Cingulate | BA 24 | Dorsal Anterior Cingulate |
| BA 11 | Medial Frontal Gyrus | BA 30, 19 | Parahippocampal Gyrus |
BA: Brodmann area.
The single dipole localization showed for both components a medial location. For the time window of the P3a component, the dipole was fitted in the dACC (P3a in Fig. 4). The single dipole for the P3b was also medial but more posterior, indicating that the gravity center of brain activity is displaced from anterior to posterior sources as time processing progresses. The obtained residual variance was relatively high, but the fitting of a second dipole did not offer physiologically plausible solutions. The best fitting yielded a residual variance under 9.1% in both analyzed components. We would like to remark that, to a certain extent, the statistical solution obtained by LORETA when comparing IC and VC trials in the medial surface was relatively similar to the solution obtained by single dipole localization on the difference wave.
DISCUSSION
In a previous report, the presence of a possible P3a component and an enhanced P3b component was obtained during the processing of spatially IC targets [12]. In the present report, using the same data set, we have added evidence on the brain differential activity during the processing of IC targets with respect to VC targets. The whole epoch analysis showed activation of the middle and inferior frontal gyrus, which is related to the analysis of novel and unexpected events. The LORETA differential activation, when IC and VC trials were compared in the P3a and P3b latencies, showed an increased activation of the dACC during IC trials with respect to VC trials, suggesting that the processing of IC trials activated conflict monitoring areas. The latter result was confirmed by single dipole localization for the P3a component latency. The dACC activation during the early P3 (P3a) component was continued during the late P3 (P3b). In addition, activation of the parahippocampal gyrus was obtained using LORETA localization. All the differences in current source were always an increased amplitude of IC with respect to VC conditions. These results reinforce the proposal that IC targets produce an increased activation of anterior and posterior sources with respect to VC targets. Therefore, the IC targets processing seems to require higher brain activation than the VC targets.
Whole Epoch Analysis
The whole epoch analysis allowed to compare the LORETA differential activation induced by IC targets with respect to VC targets, with the fMRI results obtained on the same paradigm [23,22]. The LORETA results presented a striking similarity with those obtained in fMRI (described in the introduction section) [23, 22]. Particularly, the activation in the right inferior frontal gyrus is obtained with both techniques [23]. Similarly, the LORETA analysis yielded the activation of the right superior occipital gyrus in the vicinities of the posterior part of the middle temporal gyrus. The latter location falls a few millimetres caudal from the posterior part of the superior temporal sulcus activation obtained in fMRI studies [23]. Differences in localization between both techniques are expected based on the different physiology of generators and the poorer spatial resolution of EEG localization distributed source models with respect to fMRI. However, the similarities between the obtained localizations with both techniques continue to be remarkable.
Corbetta and Shulman [28] have described the existence of two different fronto-parietal networks related to the control of attention: a dorsal fronto-parietal network related to the maintaining of the endogenous spatial attention, and a right lateralized ventral fronto-parietal network related to the reorienting of attention. The dorsal fronto-parietal network is maximally active during the cue period [20, 6]. Z-LORETA analysis revealed that the CNV recorded during the cue period would be related to the activation of the dorsal fronto-parietal network [5]. The present LORETA results showed that there is an extra activation in the ventral fronto-parietal network in the processing of the IC targets with respect to the VC targets. This increased activation would be related to the processing of reorienting the attention to unexpected locations. A more complex view of the ventral fronto-parietal network [28] suggests that the activation of the middle and inferior frontal gyrus is related to the analysis of novel and unexpected events. Therefore, the extra right inferior frontal activation obtained with the LORETA technique when IC targets and VC targets are compared reinforces the idea that IC targets are processed in the brain as novel unexpected stimuli [12].
A recent paper is trying to analyze the differential implication of brain areas in the novelty (odd-ball paradigms) and the reorienting of attention, combining both processes in a single experiment [29]. The main results were: (i) an implication of bilateral temporal-parietal areas and right superior parietal lobe in the reorienting of attention function, and (ii) an activation of bilateral inferior and occipital areas, left inferior parietal lobe, the right insula and inferior right frontal regions during the appearance of distractors (novelty analysis ). The right inferior frontal gyrus and the angular gyrus seem to participate in both operations: novelty detection and reorienting of attention. The authors conclude that only the inferior frontal gyrus and the inferior parietal sulcus participate in both functions: spatial attentional reorienting and non spatial visual orienting distraction (novel unexpected stimuli). There are remarkable similarities between the results of Vossel et al. [29] and those reported in present report, such as the activation of the following areas in both reports: superior parietal lobe (left in our results), the right insula and the right inferior frontal gyrus. However, the experimental paradigm used in present experiment makes it easier to compare it with the previously discussed papers [22, 23] than with the recent paper of Vossel et al. [29]. In any case, the obtained activation in the inferior right frontal gyrus in our experiments and the Vossel et al. [29] points out to the novelty processing as one of the cognitive operations that occur in the processing of unexpected spatial targets.
In addition to the reorienting of attention and novelty analysis that would occur in the processing of invalidly cued spatial targets, it is possible that conflict monitoring and updating of the context in which the working memory is operating would occur. The advantage of using high time resolution techniques is that the time windows that better reflect these processes can be selected.
Early P3 Component
Both the ERPs and the source localization techniques point out to the presence of an anterior component in IC trials, which given its latency and topography would be considered as a P3a component [30, 12]. The presence of an anterior P3 component in this kind of paradigms has been previously observed by Eimer [8], but was not categorized as a P3a. Recently, the Current Source Density maps obtained from voltage distributions showed that a frontal current source appeared during IC targets but not during VC targets [12]. The latter results were obtained using the same set of data used in present report.
With respect to the medial wall neural generators of the early P3, LORETA sources appeared in the paracentral lobule and the dACC. The single dipole localization confirmed this result. The dACC has been shown to be one of the generators of P3a [for reviews see refs. 31 and 32]. The sources for the P3a component have also been explained by the simultaneous recording of fMRI and ERPs, using dipole localization seeded by the fMRI activity [33]. Main contributors to the P3a component would be located in the precentral sulcus and the insula. However, some localization problems can arise from the seeded fMRI dipoles, given that fMRI can not be sensitive to EEG activities that contribute to ERPs (phase resetting) [34], or, on the contrary, can be sensitive to EEG changes that do not appear in the ERP signal (i.e. alpha rhythm decrease) [35, 36]. For these reasons, the localization of EEG sources based exclusively in EEG can offer some complementary information to the fMRI seeded dipole technique. We must remark that we have avoided the description of the obtained lateral sources during the P3a (and P3b), given that we were basically interested in the determination of differential activation that would be related to conflict monitoring areas [15, 13, 18].
The P3a component is generated as a brain response to stimuli that are surprising because of their difference with standard stimulus [30, 31, 37]. From a cognitive point of view, it could be argued that the presence of a P3a component and the underlying activation of the frontal cortex in IC trials would be related to the disconfirmation of the induced contingencies between the cue and the target in the IC trials [12]. The IC target would be treated as a deviant stimulus because the endogenous expectancy (subjective probability) of the position of the target, induced by the central cue, is validated in VC trials and invalidated in IC trials. In addition to the novelty-like treatment of the targets associated to IC trials, the obtained activation in the dACC suggests that the conflict monitoring system is activated in this type of trials, possibly to trigger compensatory actions to overcome the simultaneous activation of the prepared and the executed response and/or the induced cognitive conflict [14, 18, 16, 28]. However, given the very different situations in which ERN and P3a are generated, the relationship of the obtained activation in the dorsal ACC with the conflict monitoring system would need more confirmatory studies.
P3b Component
In a previous report, using the same set of data, an increase in amplitude in the late positive component when IC trials were compared to VC trials was obtained [12]. The latter result has been previously obtained in other experiments by evaluating ERPs during VC and IC trials [9, 8, 10]. In present report, one of the obtained differential activation in medial areas for the P3b was in the dACC, but also other differential activation of IC and VC conditions appeared in the parahippocampal gyrus. In this sense, it must be remarked that the medial temporal lobe has been reported as one main contributor to P3 generation (reviewed in Yamazaki et al. [38]). The single dipole localization confirmed the more posterior localization of the P3b component with respect to the P3a component. The displacement of the equivalent single dipole from anterior to posterior sources as post-target latency increases must be interpreted as a displacement of the neuroelectric gravity center from anterior to posterior locations, rather than considering it as exact locations for the neural generators. The sources for the P3b component have also been explained by the simultaneous recording of fMRI and ERPs, using dipole localization seeded by the fMRI activity. Main contributors to the P3b component would be located bilaterally in posterior parietal cortex, inferior parietal cortex and inferior temporal cortex [32, 39]. The parietal sources were also confirmed by a distributed source model computed on individual brains [40]. Moores et al. indicated that the lack of medial temporal sources in their results was due to the inability of current source density measures to capture deep neural sources. It is well known that the amplitude of P3 increases inversely to its appearance probability [41, 42]. They interpreted this result as: “P300 reflects the process related to the revision of hypotheses about the environment that follows the recognition of an event with a low subjective probability”. Therefore, the increased P3b [9, 8, 10, 12], accompanied by the presence of a frontal activity (P3a) during IC trials, would indicate that the disconfirmation of the subjective expectancy induced by the cue induces a novelty-like treatment of the incoming target, and possibly a revision of the internal model of S1-S2 relationships. The obtained activation in the parahippocampal gyrus would be related to the revision of the task model during IC trials, given the important role of hippocampus and parahippocampal gyrus in the formation of memory traces of the environment characteristics.
Therefore, in addition to the already described novelty detection and reorienting of attention of invalidly cued targets [15, 13, 18, 12, 22, 23], and based on the neuroanatomical information of the differential effects of the analysis of IC and VC targets, we suggest that conflict monitoring activation [13-18] (dACC) and working memory update [41, 42] (parahippocampal gyrus) occur during the processing of IC targets. An optimization of the methodology used in present report would potentially permit the establishing of a functional sequence of activation based on the effective connectivity between different brain areas. At this point, it has only been possible the identification of the involved brain areas and their temporal sequence of activation.
Finally, it must be remarked that all the obtained differences in current sources between the IC and VC conditions corresponded to an increased activation of the IC condition with respect to the VC condition. This result indicates that the processing of invalidly cued targets needs to mobilize more brain resources than the processing of validly cued targets. A similar result has been obtained with fMRI [22, 29] and explained by the reorienting of attention and novelty detection in IC trials. One novel aspect from this report, derived from the better temporal resolution of EEG with respect to fMRI, is that this increased activation during IC trials can be also assigned to the conflict monitoring and the updating of the working memory processes.
ACKNOWLEDGEMENTS
We would like to thank Carmen Gómez Sos for her English language editorial assistance. Sponsorship: Spanish Ministry of Education and Science and Junta de Andalucía.

