All published articles of this journal are available on ScienceDirect.

Spectral Pattern Analysis of Propofol Induced Spindle Oscillations in the Presence of Auditory Stimulations
Abstract
This study’s primary objective is to analyze human EEG spindle oscillations during propofol-induced anesthesia and to address possible activation sources. Such an analysis also has a secondary role of investigating the short- term spectral patterns and their functional role.
Artifact-free epochs of spindle activations were selected from the electroencephalograms of patients undergoing propofol anesthesia. Power spectral analysis and source localization using standardized low-resolution-brain-electromagnetic-tomography (sLORETA) were performed. Additionally, spectrograms were obtained by means of using the Complex Morlet-based algorithm. In order to highlight the functional properties, auditory stimulations were conducted during the propofol administration. The loss of consciousness was reached at a level of 0.8-1.2 µg/mL, which also provided distinct spindle oscillations in the continuous EEG. The un-evoked (spontaneous) and evoked (auditory) conditions were examined across non-medicated and medicated conditions (propofol). The propofol administration resulted in appearance of 12-14 Hz spindle activity mostly localized in BA6, BA9, BA10, BA21, BA24 and BA37 areas. The presence of auditory stimulations slightly shifted these maximum activities to different locations. Between the medicated and non-medicated conditions, there was a significant reduction of spindle activity, which was pinpointed to BA7 (precuneus area). The findings indicate that spindle oscillations may have a dual nature. That is, spindle oscillations may be activity dependent and disruptive for large-scale information processing networks in the brain. Hence, the study of spindle oscillation may provide a basis for understanding the short-term spectral patterns of human EEG.
INTRODUCTION
Since the emergence and systematic utilization of electroencephalography (EEG) measurements, its wide range of frequency properties has been noted. Berger’s early recordings contribute to an important milestone [1], as he differentiated the natural frequencies and attributed the definition “idling rhythm” to alpha activity. Perhaps due to this early definition, the functional properties of oscillatory activity have been long regarded as a limited phenomenon, or even epiphenomenon [2, 3].
The spectral patterns that constitute EEG have recently been addressed from the cellular and molecular levels to the broader perspectives within the brain addressing the information processing as well as functional connectivity of the brain via the oscillatory processes [4-10].
Due to its immense complexity, however, brain research has proven to be problematic, especially in the interpretation of the clinical or experimental findings. A plausible way to study the functionality in the brain is to block the larger part of the activity and allow only a narrow scope of it. Though this does not seem feasible in an active human brain, examining EEG in people under certain anesthetics (e.g. propofol) may be a desired model because its administration blocks a significant amount of brain activity from occurring An additional benefit of such an approach is that these anesthetics alter the brain state, enforcing a shift from consciousness to unconsciousness. Therefore, the functional connectivity, information flow, and network properties of can further be studied.
Propofol is an anesthetic agent that is commonly used for its fast acting role. Studies have shown that propofol induces ~14Hz spindle-like oscillations [11-13]. This provides a narrow band for studying the spectral features in the EEG [11].
Similar activation levels of spindle oscillations have been reported in the extant empirical literature investigating sleep [14]. In these studies, the source localizations were studied by means of magnetoencephalography (MEG) or electrocortico-graphy (ECoG) [15, 16]. Similar mechanisms -sharing similar brain nuclei and neuromodulators (e.g. Medial Preoptic Nucleus and GABA)- have been shown in participants during sleep and under anesthesia [17], indicating a wide-range short-term spectral patterns in both conditions.
One important question to address lies in the functional prospects of these spindle activities. They have been regarded as inhibitory processes [2, 18]. The localizations of these activities have also been examined in studies of regional blood flow and energy metabolism (positron emission tomography (PET)) [19]. To our knowledge, there is no record of any functional study with an auditory stimulation during anesthesia aiming to obtain evoked spindle oscillations.
Accordingly, in this study we aim to highlight the functional properties of human EEG spindle oscillations during propofol-induced anesthesia, and their possible locations via electrophysiological parameters. Therefore the experimental results from the non-medicated and medicated EEG segments as well as evoked non-medicated and evoked spindle oscillations, their spectral features and sLORETA (standardized Low Resolution Electro-magnetic Tomography) images will be demonstrated. We hypothesize that the evoking will enforce formation of short-term spectral microstates with different temporo-spatial features than the resting condition.
MATERIALS AND METHODS
Subjects
13 participants (7 females) with an age range of 25-46 (mean 36.54) years participated in this study. The participants were patients undergoing a similar surgery protocol for lumbar disc hernia. The ethical approval has been received from the local Ethics Committee. All participants signed a consent form prior to all research procedures.
Anesthesia Procedure
The propofol administration was controlled with a target-controlled infusion mechanism (Fresenius Vial Orchestra Base Primea, Le Grand Chemin, France) where precalculated brain dosage (effect-site) would be obtained. Accordingly, the concentration levels of 0 µg/mL to 1.6 µg/mL of Propofol were obtained. Besides the various monitoring devices, the Bispectral Index Monitor (BIS; vista, Aspect Medical) was used. The BIS provides a dimensionless number from 0 to 100, which denotes the anesthesia depth. It utilizes electrophysiological (EEG) parameters including Bispectral index. The awake values range at approximately >95, and sudden drops in the index values occur with the propofol administration. At around 1.0 µg/mL of Propofol administration, the activity would be in the range approximately at 80. Commonly levels would be kept around 50-60 range to perform adequate surgery.
EEG Recording
The Neuroscan data acquisition system (Scan 4.3, Neuroscan, Nuamps, USA) was used for EEG recording. The Quik EEG Cap (Compumedics-Neuroscan, USA) which consists of 40 Ag/AgCl electrodes (channels) was placed on the participants’ heads according to a modification of the International 10–10 system.
Most of electrode impedances were kept at less than 5 kOhm. EEG channels were referenced to linked ear lobe electrodes (A1+A2), and as a ground electrode AFZ was assigned. Continuous EEG activity was taken with a sampling rate of 1 kHz, filtered between 0.5-70Hz, and stored to the hard disc for offline analysis.
A special stimulus unit developed in our lab, Embedded Microcontroller Interactive Stimulus Unit-EMISU [20] was used for the generation of stimulus and the recording of electrophysiological data. The EEG recording was achieved in the operation room by means of 40 channel EEG (Nuamps), headphones with noise cancellation feature (Creative HN-700, Republic of Singapore). MATLAB, EEGLAB, and EMISU software were used. The auditory stimuli were administered through noise cancelling head phones at a level of 85 dB SPL. The stimuli were consisted of tones 1500 Hz, 500 ms duration 30 ms rise/fall time, randomly varying intervals ranging from 2.5 to 5 sec. The auditory stimuli were administrated from the beginning of the EEG recording Fig. (1).

The EEG recording, stimulation and target controlled drug infusion (TCI) scheme during the auditory stimulus paradigm. The auditory stimuli are presented with the EMISU system and the stimulus point is marked by vertical line in the figure.
EEG Segment Selection and Data Preparation
The continuous EEG data files (.cnt) were epoched for the evoked condition or segmented for the spontaneous condition to equal data lengths. Each segment contained 601 data points (sampling rate 1000 Hz) which equaled to -200 to 400 ms for the epoched sections.
Spontaneous segment would be selected from an artifact free section with no stimulation. In a section with stimulations, then the segment would be temporally separated by 2-3 seconds pre- and post- stimuli.
The artifacts were removed by means of visual observation. These artifact-free EEG sections were baseline corrected. The obtained sweeps were than averaged. Due to hostile conditions in the surgery room, not all the channels were artifact free. For this reason 18 channels [as in ref. 21, 22] with equal distribution across anterior/posterior and hemispheric locations were fixed across all subjects (F3, FZ, F4, FC3, FCZ, FC4, C3, CZ, C4, CP3, CPZ, CP4, T5, P3, PZ, P4, T6, OZ).
sLORETA Procedures
These data segments were then transferred into sLORETA (standardized Low Resolution Electro-magnetic Tomography) protocol. sLORETA software is based on a probabilistic MNI brain volume which are converted to “corrected” Talairach coordinates, then given to the Talairach Daemon [23] (MNI152 template). The cortical regions are created by allocating the raw sLORETA values of individual voxels to their corresponding Broadmann areas (BA) or cerebral gyri on the basis of the coordinates of the digitized Talairach Atlas [23,24]. In sLORETA the coordinates of the 18 electrode positions were applied to a digitized MRI version of the Talairach Atlas (McConnell Brain Imaging Centre, Montréal Neurological Institute, McGill University). These Talairach coordinates were then used to compute the sLORETA transformation matrix. This resulted in the corresponding 3D cortical distribution of the electrical neuronal generators for each subject. The transformation matrix file in the sLORETA application was created from the X, Y, Z coordinates files. The EEG segments were transformed to “Global Field Power” (GFP) to estimate the target peaks. The advantage of GFP is that it is reference free and allows data reduction in multichannel recording. Therefore, the current density values (CDV) of maximal GFP peaks are presented at a given LORETA image. An equivalent current dipole is positioned, for which a current density (µA/mm2) is computed on each of these voxels [23, 24].
Statistical Analysis
The Shapiro-Wilk test was used for determining distribution of the groups and deciding statistical methods. The groups were in normal distribution and paired t-test was used to compare the above mentioned two conditions.
Spectral Representations
The spectrograms for the presentations of EEG data segments were obtained by means of a MATLAB routine [25]. The outline of the method is given below:
Wavelet transform of a signal s(t) gives the time-scale information found by the following formula
where the mother wavelet function φ(•) was chosen as Complex Morlet.
* denotes the complex conjugate, b is the shift parameter, the corresponding scale is given by dilation parameter a. Since most of the signal processing applications focus on the time-frequency analysis, it is essential to convert the scale information into frequency. The formula given below provides corresponding frequency Fa for a specified scale value a
with the parameters Fc denoting center frequency of the wavelet in Hz, Δ denoting the sampling period.
For obtaining the spectrogram the Central (Cz) electrode data was used as a common location in literature for similar studies (especially, in the auditory domain).
RESULTS
The participants (patients) of the study had been monitored by means of various body parameters and Bispectral Index Monitor (BIS). The depth of anesthesia was assessed by means of the BIS value and lack of responsiveness. As the EEG recordings were taken before the initiation of intububation, no other artifacts that would be expected during the surgery were observed (e.g. incision, body movements, electrocautery etc.) within that specific period. With a stepwise strategy, the infusion of propofol was maintained to increase from 0 to 1.6 µg/mL (brain concentration level) where 0.8 µg/mL was the common value when the patients lost consciousness. The auditory-evoked potentials or the accompanying BIS values is beyond the scope of the current study. Notably, however, reaching the level of loss of consciousness was also accompanied with the gradual disappearance of evoked potentials.
The level of anesthesia, evoked responses, spindle oscillations, locations, and temporal differentiations are among the numerous factors that can be addressed. In accordance with the aim of the present study, the current paper will provide results on the evoked segments with limited number of locations and time windows. The general properties of the changes in the EEG will also be presented with the illustrations.
Global Spectral Changes in the EEG During Propofol Administration
The initiation of propofol resulted in the decrease of spectral variability in the continuous EEG. Fig. (2) displays raw EEG sections with two levels of anesthesia from the non-medicated and medicated conditions. The variability further decreased when reaching to 0.8 µg/mL level, where finally almost all the activity was composed of mono-frequency spectrum 13.20 (±2.56) Hz. These spindle oscillations dominated the EEG recording during the majority of the propofol 1.6 µg/mL levels. These oscillations lasted about 1001.04 (±221.02) milliseconds and had a range of 57.93 (±17.69) µV of amplitude. The spectral plot of a selected EEG segment with a spindle is provided in Fig. (3). As can be observed from the spectrogram, the EEG activity is locked into a narrowband of oscillatory activity of 13 Hz.
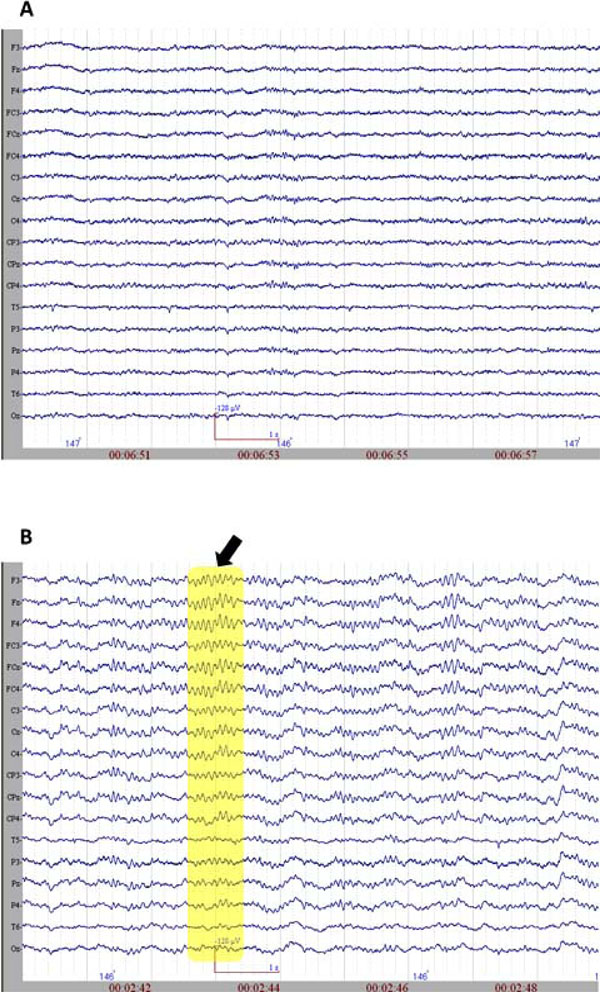
A. The raw EEG section (sample) from non-medicated group. B. The raw EEG section (sample) from medicated group. The arrow and the rectangular selection point to spindle oscillations.
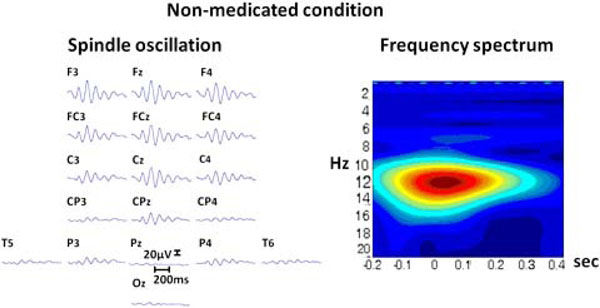
Left: The raw EEG segment from 18 electrodes (upper section represents frontal areas). with a spindle oscillation. Right: The spectrogram of the same activity from Cz electrode, vertical axis denotes frequency (Hz); horizontal axis denotes time (seconds).
Evoked Spindle Oscillation Activity
The evoked activity source localization resulted in somewhat different locations than the unevoked SO activity. The Table 1 provides the values for the MNI coordinates and the current density values. The accompanying centers of focused activity include BA7, BA11 and BA42. These areas were appointed as Regions of Interest (ROI). They were then compared to non-medicated EEG segments.
The Comparison of Maximal Current Density Values Obtained from Medicated and Non-Medicated Groups at Around 100 ms Poststimulus (GFP Peak) and MNI Coordinates are Presented for Four Locations
| Medicated (med) and non-medicated (non-med) groups’ mean current density value (CDV) maximum [µA/mm2]*10-3 1st peak activations in response to 1500 Hz sine wave (n=13). | |||||
|---|---|---|---|---|---|
| Brain region | Condition | CDV | x | y | z |
| BA 11 | Med Non-med |
4.20 3.53 |
15 | 45 | -25 |
| BA 6 | Med Non-med |
2.98 3.25 |
-5 | -25 | 70 |
| BA 7 | Med Non-med |
3.05 5.33 |
-10 | -60 | 70 |
| BA 42 | Med Non-med |
3.81 4.66 |
60 | -32 | 15 |
Possible Sources of the Spindle Oscillations
Spontaneous (Unevoked) Spindle Oscillation Activity
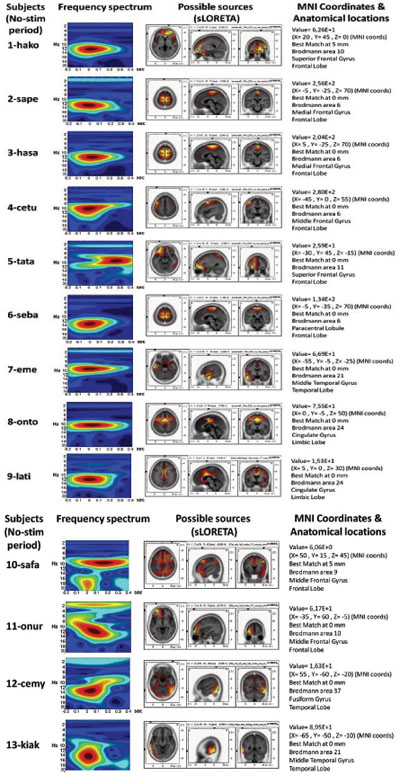
The source localization revealed BA6 as the major current density maxima in 6 out of 9 patients. The level of the propofol anesthesia is over the range of 1.2 µg/mL for these data sets (which coincided with the loss of consciousness). The spontaneous activity from every participant of the current study is included in the Appendix. The left column denotes the spectrograms. The sLORETA images and the maxima 3D coordinates as well as the Broadman areas are also provided. The locations from the maximal activity areas include, BA6 (5 subjects), BA9, BA10 (2 subjects), BA21 (2 subjects), BA24 (2 subjects), BA37. A sample is provided in Fig. (4), which presents activity at BA6 for the spindle oscillations during an unevoked condition.
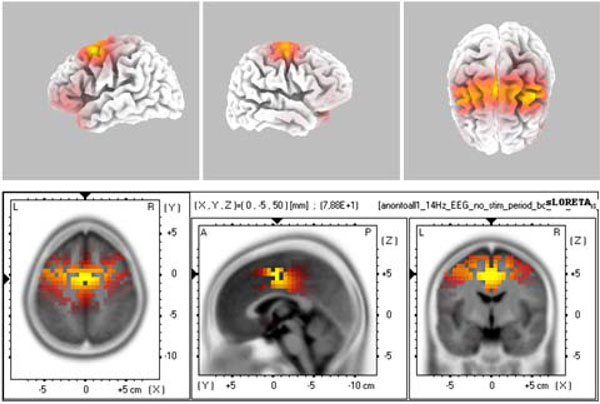
The sLORETA image of maximal evoked activity at BA6. Upper panels indicate 3D representations and lower panel presents the sLORETA images with XYZ coordinates.
Evoked Spindle Oscillation Activity
The evoked spindle oscillations displayed major activity localized at sources such as BA7 BA6, and BA10/11. These three locations (BA 6, 7, 11) and a location related to auditory cortex (BA42) were selected as regions of interest (ROI) in our study. The 3D representations were treated as set values and the GFP values were studied. Fig. (5) displays a sample source localization sLORETA image.

The sLORETA image of maximal evoked activity at BA7 (precuneus). Upper panels indicate 3D representations and lower panel presents the sLORETA images with XYZ coordinates.
Medicated/Non-Medicated vs. Evoked/un-evoked Activity
The medication and evoking changes in the sLORETA and spectrogram are provided in Fig. (6). The medicated and non-medicated sections are displayed in columns and unevoked vs. evoked activity are provided in rows. Accordingly, the drug-free panel has a spectrogram with a wide range of activity of (0.5-25 Hz), whereas the medication enforces spindle oscillations (11-14 Hz). When the stimulations are presented, the non-medicated wide range activity narrows down towards delta and theta activity. The spindle oscillations, however, were enforced towards slower oscillations partially breaking down the mono-frequency entrainment. Table 1 displays the CDV of the two groups.
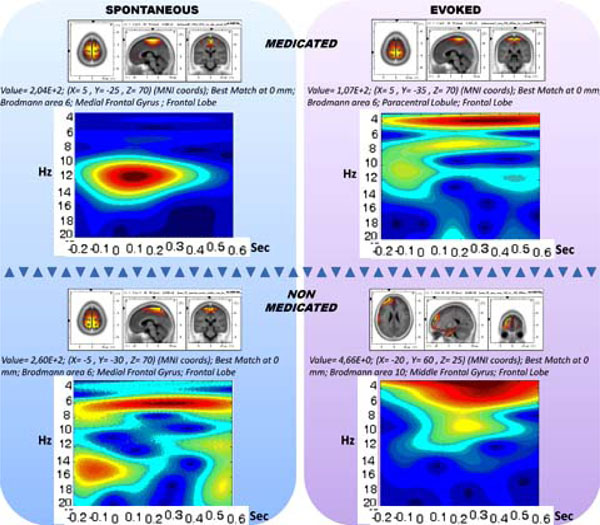
The 2X2 representation of spectrograms and sLORETAs for medicated (horizontal upper), non-medicated (horizontal lower) vs. un-evoked spontaneous (vertical left) and evoked (vertical right) conditions.
The comparison between the evoked responses in medicated and non-medicated conditions have been compared for the abovementioned four ROI. A paired t-test has shown a significant difference for BA7 location (p=0.011) Fig. (7). Accordingly, major reduction has been localized at an area with highest non-medicated activity.
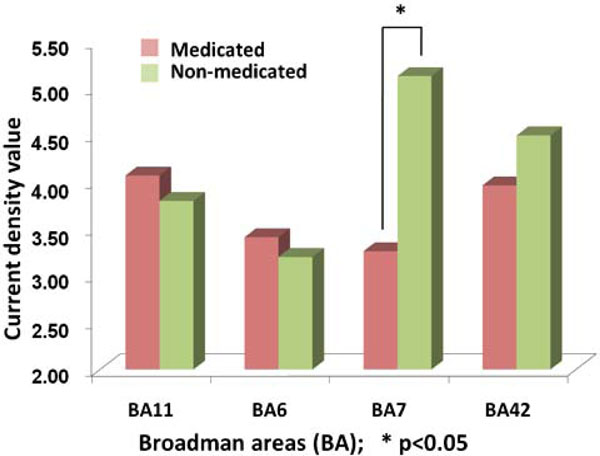
The comparison of activity obtained from Current Density Values (CDV) of sLORETA procedures in BA11, BA6, BA7 and BA42. The vertical bars denote the average CDV where left side of the pairs shows the medicated groups. The asterix highlights the statistically significant difference (p<0.05).
DISCUSSION
The current study demonstrated the gradual changes in the spectrogram of EEG during the administration of propofol. Firstly, the wide range spectral activity has shifted into a tuned activity with a predominant 12-14 Hz spindle oscillation. In addition, the auditory stimulations presented a change in the spectral pattern. Finally, the source localizations (sLORETA) of these activities were mostly addressed to BA6, BA7 and BA10 during the stimulations. The most pronounced reduction of activity, however, was obtained at BA7 the precuneus area between the non-medicated and medicated conditions.
The Spectral Properties of Spindle Oscillations
The spectrograms of the present study have revealed oscillatory activity within the upper alpha and lower beta range during the presence of Spindle Oscillations under Propofol anesthesia (around 1.2 µg/mL). It was indicated that the generators of alpha are not fully known [2]. Furthermore, it is unclear whether alpha is induced by inhibitory activity and/ or other factors such as network properties or intrinsic properties of certain neuronal populations. Taking into consideration that about 15% of cortical cells are GABAergic and that only 10% of synchronously active neurons were suggested to be capable of generating such amplitude, EEG alpha may rise from rhythmic fluctuations of inhibitory neurons. In contrast, the alpha oscillation has also been linked to evoked activity, and thus a sensory cognitive function has been determined [2, 3, 26, 27]. In a recent study, the role of alpha in attention and consciousness was discussed highlighting the same contradictory condition [18].
Are these Oscillatory Activities Locally Isolated Stand-Alone Phenomena?
Addressing this question, a study examining long-range temporal correlations in alpha and beta oscillations [28] indicated the short-term spectral relationships and their test-retest reliability. The question can also be further extended into different domains from sleep to pathologies, presenting spindle oscillations [29, 30]. In another study, beta rhythms in the range of 15-20 Hz were reported to be generated by nonreciprocal communication in hippocampus [31]. The current study revealed oscillations partially reaching to the range of beta frequency (>14 Hz). The long-range temporal correlations between alpha and beta oscillations have been reported [32], with strong test-retest reliability. This alpha-beta similarity has been addressed in another study [8], where both frequency bands displayed similarities in their profiles of local and remote functional connectivity in relationship to opioids.
In a study on sleep spindles, a center frequency of 13.5 Hz was found to be localized around occipito-parietal sulcus utilizing 151 channel MEG [15]. The existence of similar spectral activities between sleep and anesthesia has been supported with a series of studies providing both experimental data and theoretical framework [14, 16, 17, 21, 22, 29, 30]. As the current study similarly displayed the upper alpha and lower beta frequency profile, the alpha-beta relationship deserves further exploration. The evidence coming from the reports [8, 28] point to functional interplay between these oscillations. Therefore the present findings need to be addressed later in a study with components to differentiate the dynamics of double frequency range.
The Location of the Activity
The spindle oscillations activity has also been localized in the study by Wolter and colleagues [33]. The source localization in their study revealed BA6, BA10, and BA7 as major sources. Likewise, the major sources in the current study (medicated evoked) were pinpointed to similar areas. Al though similar locations have been found, we have to note few details in this comparison. First, the Wolter et al. study [33] did not use auditory stimulations, and we have slightly different localization for the spontaneous activity: BA6, BA9, BA10, BA21, BA24, BA37. Additionally, they have performed the recordings after the intubation with administration of bolus of propofol. In the current study, a target-controlled infusion was performed with a gradual increase from 0 to 1.6 µg/mL providing a time frame of around twenty minutes for the auditory stimulations just before the intubation. Therefore, we can assume that their anesthesia levels are deeper than those in our study. Interestingly, the evoked activity still lies within the proposed locations of the deep anesthesia spindle sources of Wolter et al. study [33]. On the other hand, we have observed some slight variations between the un-evoked and evoked locations. This seems to create a minor dilemma, challenging the specifity of the locations for these spindle-oscillations. The lack of specifity may be the secondary proof of the cessation of information processing with and from the outer world (auditory stimulations). A further controlled study may be planned to address this issue with a step-wise pattern. However, this seems to be hidden in the paradoxical nature of these oscillations. We have seen in the literature that some groups have come up with evoked oscillations, whereas mostly the others have stated active inhibitory processes [2, 18]. This condition points to the presence of two separate networks or a dynamically changing reciprocal network property.
The Precuneus and Relationship to Present Findings
Being located above the posterior cingulate, the precuneus is placed between the two hemispheres (BA7). The sensorimotor anterior region, cognitive/associative central region, and visual posterior region are the three subdivisions. Recently, the behavioral correlates of precuneus have been reviewed [34] from highly integrated tasks to consciousness. In that review, the neural networks of consciousness have been indicated as retrosplenial, posterior cingulate and precuneal cortices. These areas also contribute to highest level of blood glucose metabolism. Historically, the precuneus area has been reported in a study on Orangutan brain as early as 1880 [35]. Until recently, this area has been almost entirely forgotten, without a clear functional attribution. Recently, the functional connectivity (not only the anatomical) has been reported, pointing to a consciousness network being formed of above-mentioned posterior cingulate, precuneal, and retrospinal cortices [7]. The present study provided data of maximal activity at locations of precuneus (BA7) and cingulate cortex (BA23). The commonality between the present findings and the study of Vogt et al. [7] suggest that BA7 may be a plausible activity zone related to anesthesia and consciousness. Kjaer et al. [36] have provided data on the precuneus (BA7)-prefrontal (BA9) activity during consciousness. In our study, the medicated activities have been focused around these two locations even though the evoked activity [37] had been “embedded” in unconscious state.
Large Scale Network Properties
The brain information processing is a function of neural populations through functional connectivity. The results of this current study might be indirectly an interruption of this functional interrelation among different neural populations.
In the review by Bressler and colleagues, the large-scale network functions were indicated [38]. Here, spatial, temporal and coordinative selectivities were expressed. The current results also indicate coordinative functional selectivity around prefrontal and precuneus areas. The impairment of local cortical area network function may explain the loss of consciousness as well as the change in the brain responsiveness. The redirected or self-coupled short-term modulation might explain the breaking of the functional connectivity especially with the prefrontal areas. A recent study reported bidirectional feedback between thalamus and cuneus utilizing the alpha oscillation network [39]. The thalamocortical networks [4, 5, 40], the precuneal-prefrontal [36] networks and other long and short range networks fall into the scope of this current report and the present findings. A further study should assess these spatial network properties targeting structures specific to anesthesia [41, 42]. Furthermore, spatio-temporal dynamics [43, 44] may be addressed in detail.
CONCLUSIONS
The present study demonstrated spectral changes in the EEG during the administration of an anesthetic substance, propofol. The BA7 appeared to be a critical location with a role on short term spectral oscillations. The same area (precuneus) has been suggested to be related to awareness and consciousness. The propofol comes out as a strong substance that effectively changes activities in the brain from local to global temporo-spectral dimensions. The findings may indicate a dual nature of spindle oscillations, being activity dependent and also being disruptive for large-scale information processing networks in the brain. The current approach can serve as a useful model for studying the short-term spectral phenomena in the brain.
ACKNOWLEDGMENTS
The authors wish to thank Emre Cek for his support on wavelet transformations, Serhat Taslica for his extensive support on data preparation and Anna Vannucci for her editing. The study was supported by DEU. 2007KB.SAG.61/65 projects.
LIST OF ABBREVIATIONS
APPENDIX
The sLORETA and Corticograms from single subjects