All published articles of this journal are available on ScienceDirect.

Short-Term EEG Spectral Pattern as a Single Event in EEG Phenomenology
Abstract
Spectral decomposition, to this day, still remains the main analytical paradigm for the analysis of EEG oscillations. However, conventional spectral analysis assesses the mean characteristics of the EEG power spectra averaged out over extended periods of time and/or broad frequency bands, thus resulting in a “static” picture which cannot reflect adequately the underlying neurodynamic. A relatively new promising area in the study of EEG is based on reducing the signal to elementary short-term spectra of various types in accordance with the number of types of EEG stationary segments instead of using averaged power spectrum for the whole EEG. It is suggested that the various perceptual and cognitive operations associated with a mental or behavioural condition constitute a single distinguishable neurophysiological state with a distinct and reliable spectral pattern. In this case, one type of short-term spectral pattern may be considered as a single event in EEG phenomenology. To support this assumption the following issues are considered in detail: (a) the relations between local EEG short-term spectral pattern of particular type and the actual state of the neurons in underlying network and a volume conduction; (b) relationship between morphology of EEG short-term spectral pattern and the state of the underlying neurodynamical system i.e. neuronal assembly; (c) relation of different spectral pattern components to a distinct physiological mechanism; (d) relation of different spectral pattern components to different functional significance; (e) developmental changes of spectral pattern components; (f) heredity of the variance in the individual spectral pattern and its components; (g) intra-individual stability of the sets of EEG short-term spectral patterns and their percent ratio; (h) discrete dynamics of EEG short-term spectral patterns. Functional relevance (consistency) of EEG short-term spectral patterns in accordance with the changes of brain functional state, cognitive task and with different neuropsychopathologies is demonstrated.
“...there does appear to be important information about how the brain works contained in the empirically useful but inscrutable oscillations of the EEG”
—Jones S. [1].
INTRODUCTION
Ongoing spontaneous activity at the cortical level (electroencephalogram – EEG) is extensively used in brain research and for clinical purposes. It appears that as a neurophysiological phenomenon EEG has its own peculiarities, regularities and rules of organization [2-6] (for the reviews see [7-10]). Only when one knows these characteristics, it is possible to make proper use of EEG as a tool and to give adequate interpretations of the obtained data. In fact, it is impossible to design a cognitive EEG experiment not biased by assumptions (explicit or implicit) regarding brain dynamics and the statistical characteristics of EEG, particularly with respect to the extent of stationarity and temporal dynamics. In connection to this, a much deeper understanding of brain dynamics which is reflected in EEG is essential for genuine long-term progress in psychophysiological and cognitive sciences. However, studies on structural aspects of the EEG signal are sparse in literature. Therefore, it is important to fill this gap.
EEG is the result of dendritic and postsynaptic currents of many cortical neurons firing in nonrandom partial synchrony [11, 12]. It was demonstrated that neural activity patterns measurable at the macro-level by EEG are correlated with underlying neural computations [13-18]. Thus, EEG provides a direct measure of cortical activity with millisecond temporal resolution. Currently there is common agreement in the field of cognitive neuroscience that EEG does reflect conditions, functional properties and global states of brain functioning and is closely connected to information processing and cognitive activity [4, 19-23]. The interaction of large populations of neurons gives rise to rhythmic electrical events in the brain, which can be observed at several temporal scales – EEG oscillations. They are the basis of many different behavioural patterns and sensory mechanisms [24, 25].
Electrical oscillations in neural networks have been intensively studied over the past years: Basar et al. [26-28], Lopes da Silva [29], Klimesch [30-34], just to mention a few. As a result of this research, it is suggested that the oscillatory activity of neuronal pools reflected in characteristic EEG rhythms constitutes a mechanism by which the brain can regulate changes of a state in selected neuronal networks to cause qualitative transitions between modes of information processing [29]. Different oscillatory patterns may be indicative of different information processing states, and it has been proposed that the oscillatory patterns play an active role in these states [35, 36].
Since an EEG is widely referred to as a nonstationary signal with varying characteristics (for the reviews see [8, 9]), EEG oscillations are expected to be dynamic in nature [37, 38]. It means that EEG signal has different characteristics in various time moments. It was demonstrated that in the phenomenon of EEG variability, not only the stochastic fluctuations of the EEG parameters, but also the temporal structure of the signal is reflected [3, 39] (for the review see [7]). It is assumed that EEG variability or nonstationarity is the reflection of structural or piecewise stationary organization of the signal. Piecewise stationary structure of EEG is considered as a result of “gluing” of stationary casual processes with different probability characteristics (for the reviews see [7-10]) Fig. (1).
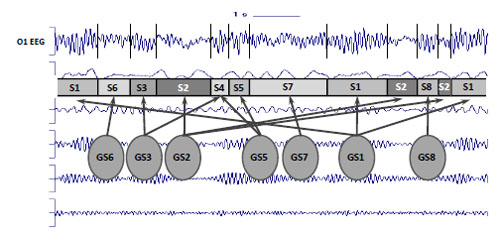
Piecewise stationary organization of EEG. S1-S8 = Piecewise stationary segments; GS1-GS8 = Generator system states; vertical bars represent boundaries of EEG piecewise stationary segments; arrows illustrates relations between generator system states and piecewise stationary segments.
The abrupt transition from one segment to another in this sense reflects the changes of the generator system state or changes in the activity of the two or more systems [3, 40]. There is growing neurophysiological evidence that brain activity involves the transient formation and disassembling of interconnecting cortical neuronal assemblies [41] which are understood to generate the EEG [42]. Each transient neuronal assembly is in the steady quasi-stationary state which signifies the functional cortical microstate [40]. Therefore, a microstate is a short-lived steady self-organised operational unit. Activity within each microstate is stable (or quasi-stable) and is likely to represent a fingerprint of the functionally distinct neuronal network mode, which emerges at the mesoscopic1 level. Such a mode is dynamically regulated by interactions within a homeostatic system that are mediated by many different neurotransmitters on one side and functional tasks or various perceptual and cognitive operations associated with a mental or behavioral condition on the other. In this context, microstates in specific neuronal networks, or cortex areas, contribute to information processing, and may be the essence of brain functioning [43-46]. Many different microstates correspond to any one particular macrostate. In such a way, the dynamics of brain activity within a given macrostate can be considered as a sequence of relatively stable brain microstates which are reflected in EEG as piecewise stationary segments [47]. Consecutive macrostates in its turn comprise a new sequence in another time-scale. Such functional EEG structure comprises hierarchical multivariability which reflects the poly-operational structure of brain activity [48, 49].
Spectral decomposition, to this day, still remains the main analytical paradigm for analysis of EEG oscillations due to the importance of oscillations as a general phenomenon of neuronal activity. The power spectral density (power spectrum) reflects the “frequency content” of the signal or the distribution of signal power over frequencies. Additionally, a power spectrum is a compact and natural representation of steady state neural activity [50]. The comparison of absolute and relative changes in frequency bands of the power spectrum has revealed important information about the electrical activity of the brain and its relationship to human behaviour [51].
However, conventional spectral analysis assesses the mean characteristics of the EEG power spectra averaged out over extended periods of time and/or broad frequency bands in order to obtain statistically reliable characteristics. In that case, averaging procedures (resulting in a “static” picture) might not only mask the original signal dynamic aspects, but also give rise to ambiguous data interpretation [52-54]. In fact, and as explored in our early work [5, 55] the total power spectrum does not characterize each of the individual power-spectra for each EEG segment Figs. (2, 3).
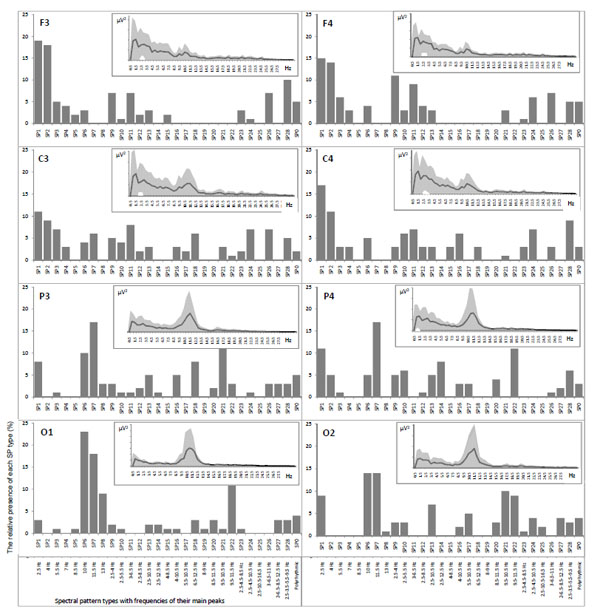
Example of mean power spectra averaged out over one-minute EEG (in the insertions), their variability (grey areas) and correspondent relative presence of each individual power spectra (vertical bars) for each EEG channel separately. EEG registered during eyes closed resting condition.
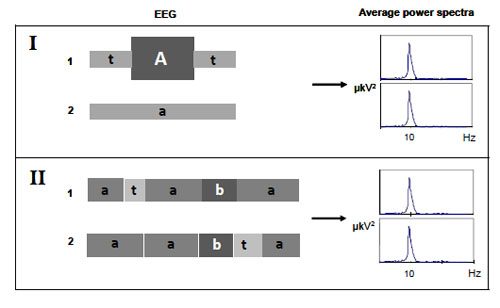
Piecewise stationary organization of EEG and average power spectrum (scheme).
Fig. (2) illustrates that averaged EEG power spectra even during resting conditions with closed eyes are characterized by very high variability (grey areas in the insertions) independently of the EEG channel. This is in line with the work of Oken and Chiappa [38] who found that the power variability of the main EEG spectral components for sequential short (5-10 sec) EEG segments is 50-100%. Such variability is due to the fact that piecewise stationary EEG segments are described by different classes of spectral patterns (SPs) [2, 3, 56]. Indeed, the same EEG channels were characterized by16-21 SP classes (vertical bars in the histograms, Fig. 2) thus reflecting multivariability of brain activity, where SP types emerge, persist for some time and then disappear to be replaced by other SP types [5]. This suggests that ongoing brain activity occurs in discontinuous steps and confirms that the cerebral cortex is continuously active even in wakefulness. The frequency of each SP type occurrence reflects the probability for the occurrence of particular neuronal dynamics which altogether constitute a dynamic repertoire of brain activity in particular functional state [6]. Averaged power spectra are “blind” to this type of information.
Figs. (3 and 4) illustrate the other major problems associated with average power spectra.
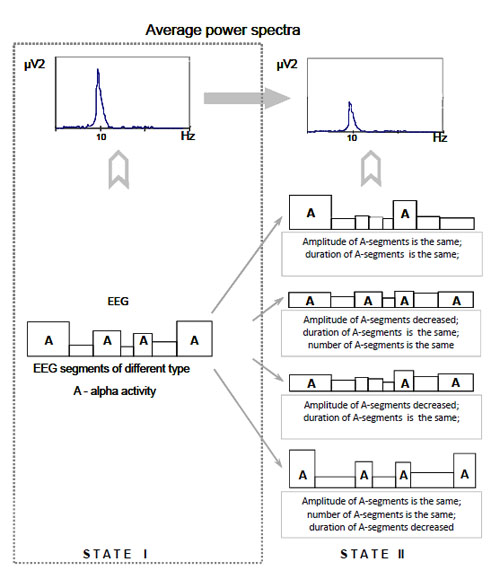
Average power spectrum effect and piecewise stationary organization of EEG (scheme). Alternative interpretations of the average power spectrum effect (changes from state I to state II) are illustrated.
The average characteristics of a signal predominantly reflect an influence of high-amplitude segments of the long EEG epochs, thereby totally obscuring the low-amplitude desynchronized segments [57] Fig. (3.I). Additionally, it is impossible to derive information on temporal dynamics of brain activity from average power spectrum Fig. (3.II). Indeed, if the EEG signals ‘1’ and ‘2’ have different temporal structure, but the same set of elemental EEG segments then the mean characteristics of such signals would be virtually the same. Therefore, averaging of EEG spectral components most likely shows the balance of diverse EEG characteristics rather than actual – “principal” – processes over the total signal. Hence, when examining the average power spectrum, it is not clear whether the observed effect is real (not the “virtual” result of averaging procedure), stable and typical for the whole analyzed signal. For example, it is not clear: (a) whether temporal stability in the total power of a particular brain oscillation reflects the stability in the number of its occurrence per, for example, minute rather than the stability of the average oscillation’s amplitude, and (b) whether the stability of total power of a particular brain oscillation is typical for the whole analyzed signal or a small portion of it.
Moreover, while analysing an average power spectrum there may be difficulties in its meaningful interpretation if the spectrum is not matched to the EEG nonstationary structure Fig. (4).
From the Fig. (4) it can be seen that to explain the average power spectrum effect (state II in comparison with state I) at least four alternative interpretations can be given. Unfortunately, it is impossible to give privilege to any of them based solely on the average power spectrum and without the information on piecewise stationary organization of the EEG.
From these examples it follows that the activity of some brain processes may be reflected in the EEG as changes of its structure without changes in the average spectral characteristics of the signal.
Additionally, the frequency bands are predefined and taken in isolation from each other in the vast majority of EEG studies. This does not permit researchers to examine behaviour of the actual/natural composition of EEG oscillations involved. At the same time, brain functioning is represented by multiple oscillations [27]. According to the superposition principle introduced by Basar et al. [26], brain activity is accompanied by superimposed multiple EEG oscillations in many frequency bands (for the review, see [28]).
All these observations have, however, been neglected in basic cognitive EEG research.
A relatively new promising area in the study of EEG during rest and cognitive processing is based on the reduction of the signal to the elementary spectra (SPs) of various types in accordance with the number of types of EEG stationary segments instead of the usage of averaged power spectrum for the same EEG [2, 3, 5, 6, 56, 58]. It has been suggested that the operational elements of behavioral and mental activity are originated in the periods of short-term metastable2 states of the whole brain or its individual subsystems (see reviews [9, 22, 43, 48, 49, 59, 60]). The results of these studies suggest that the quasi-stationary segments reflect the operational acts of nervous activity which continue to occur even without external stimulation. From this viewpoint, it is justified to use the calculation of individual spectral estimations of the elementary EEG segments.
The work of Bodenstein and Praetorious [58], Bodunov [2], Jansen et al. [3, 56] and Fingelkurts et al. [5, 6] suggested a phenomenological model of the EEG. Considering that a single EEG spectrum illustrates the particular integral dynamics of tens and hundreds of thousands of neurons in a given cortical area at a particular point in time [50], it can be suggested that the SPs within each class are generated by the same or similar dynamics with the same or similar driving force [61]. SPs from different classes, however, have had in effect different driving forces and therefore have been generated by different dynamics. Therefore, the various perceptual and cognitive operations associated with a mental or behavioural condition is thought to constitute a single distinguishable neurophysiological state with a distinct and reliable SP [62, 63]. In this case, one type of SP may be considered as a single event in EEG phenomenology.
In order to accept the hypothesis that EEG short-term SP of particular type may be considered as a single event in EEG phenomenology the following general propositions should be confirmed:
- Local EEG short-term SP of particular type should reflect the actual state of the neurons in underlying network not just a volume conduction;
- Morphology of EEG short-term SP should reflect the state of the underlying neurodynamical system i.e. neuronal assembly;
- Different SP components should reflect a distinct physiological mechanism;
- Different SP components should have distinct functional significance;
- SP components should exhibit developmental changes;
- The variance in individual SP and its components should be predominantly determined by heritable factors;
- The sets of EEG short-term SPs and their percent ratio should exhibit intra-individual stability, thus being reliable over periods of time;
- EEG short-term SPs should exhibit discrete dynamics.
- The variance in individual SP and its components should be predominantly determined by heritable factors;
In the following sections we will consider each of these propositions in detail.
Relationship Between Local EEG Short-Term SP of Particular Type, the Actual State of the Neurons in Underlying Network and Volume Conduction
The possibility for extracting physiological information on collective network activity from an EEG has been demonstrated [15-18]. Indeed, collective dynamics in complex systems that consist of interacting subunits can often be captured by a single or few macroscopic observables, which are named the order parameters [22, 64, 65]. It is assumed that a single short-term EEG SP illustrates the particular integral dynamics of tens and hundreds of thousands of neurons in a given cortical area at a particular point in time [50].
However, there is no simple (one-to-one) relation between a power spectrum computed from short epochs of ongoing EEG and the actual state of the neurons in the underlying network: many different configurations of firing neurons can give rise to a particular short-term spectrum (so called many-to-one relation). Here the relation is, at best, statistical. At the same time, the same configuration of firing neurons cannot give rise to two (or more) different short-term spectra. Thus, two different short-term power spectra very likely originated from two different configurations of firing neurons [61]. Consequently, short-term SP reflects a particular class of neurons’ activities, where each of the activities has something in common with the others within the class (one-class–to-one relation). Moreover, two classes of neurons’ activity do not overlap (otherwise the same configuration of firing neurons could give rise to two or more different short-term spectra, which is impossible).
Class-to-one relation, perhaps, serves the brain as a mechanism of multivariability reduction and increases brain adaptability [6, 66]. The same final result – oscillatory state (indexed by short-term SP), may be achieved by one of many different alternative neurons’ activities within the class, depending on the peculiarities of the situational context (homeostatic state, past activity, present needs, and contemplated consequences). In the functional terms, a “compromise” based on conserving energy resources and on agreement between intrinsic goals and motivational states permits the brain to “select” only those configurations of firing neurons that are useful in accomplishing an organism’s actual goal [54]. Thus, a solution to the integrative brain functioning is therefore defined as the settling of the entire system into a metastable state of best fit (for the review, see [9, 48]).
An important related issue is the influence of volume conduction on local EEG SP. In spite of common belief that volume conduction determines largely the local SP, close inspection of experimental, analytical and theoretical studies suggest something else.
- Several studies demonstrated that spatial resolution of EEG might be better than widely believed. It has been shown that EEG and MEG (which is free from volume-conduction effects) offer comparable spatial resolutions on the order of several millimetres [67, 68]. Indeed, dipole localization3 accuracy of 7-8 mm for EEG and 3 mm for MEG has been demonstrated using a human skull phantom [69]. The inclusion of anisotropic volume conduction in the brain was found to have a minor influence on the topology of EEG and MEG (and hence source localization) [70].
- Additionally, covariance between neighboring electrodes across cortex functional boundaries (e.g., parietal to temporal areas) was much smaller than covariance within functional regions (e.g., left parietal to midline parietal area), indicating that multiple distinct functional areas are assessed by topographic EEG [71, 72].
- The local synchronized behavior of neural assemblies leads to fluctuations in local field potentials (LFPs) that can be measured using EEG [12]. Indeed, experimental findings demonstrated that the probabilities of firing of neurons observed singly and in small groups simultaneously are in close statistical relationship to the EEG recorded in the near vicinity [14, 73, 74]. Therefore the EEG can provide an experimental basis for estimating the local mean field of contributory neurons.
- Important work came from Cook et al. [75] who demonstrated experimentally the accuracy of topographic EEG mapping for determining local (immediately under the recording electrode) brain activity (see also [76-78]). Cook et al. examined the associations between EEG power spectra and cerebral perfusion underlying the electrode to determine the accuracy with which power measure characterises local cerebral measures. Cerebral perfusion was measured with H215O positron emission tomography registered in parallel with EEG. The study demonstrated that there are statistically significant linear relationships between EEG power and perfusion in the majority of frequency bands [75]. This finding is in line with ealier study of Inouye et al. [79], where the authors demonstrated that endogenous EEG activity which originated from an underlying cortex area had contributed the most to the spectral power measured from the given EEG electrode. Whereas exogenous EEG activities which originated from other cortical areas contributed insignificanly to spectral power of the same EEG electrode. Thus the described works suggest that topographic EEG mapping can accurately reflect local brain function and it is comparable to other topographic methods.
- The skin and skull are not considered to be serious frequency filters [11]. Robinson et al. [80] demonstrated also that there is little effect of volume conduction on the shape of the EEG power spectrum below about 25 Hz and spatial filtering is significant only for frequencies above 25 Hz. Notice that approximately 98% of EEG spectral power lies below 25 Hz [81]. Therefore, 98% of spectral power is virtually unaffected by volume conduction.
- If the influence of volume conduction on the SP is predominant then one should expect the same type of SP over the whole cortex (or its bigger parts) during the same observation. However, analysis of the composition of EEG short-term SPs in different EEG channels demonstrated that each EEG channel or small group of channels has its own SP set [5]. Additionally, analysis of EEG short-term SP types in different EEG channels within the same observation revealed that the same type of SP can be observed simultaneously in two EEG channels in 70% of observations during one-minute EEG (notice that in the majority of cases these were homologous EEG channels: for example O1-O2) Fig. (5). The same type of SP characterized simultaneously three EEG channels only in 36% of observations (P<0.001-P<0.0001). For four EEG channels this value dropped significantly to 16% (P<0.001-P<0.0001). For five, six and seven EEG channels this value was very small: all were below 5% (P<0.0001-P<0.00001). The situation where eight EEG channels were characterized by the same type SP was not observed at all Fig. (5). Approximately in 2% of the observations each EEG channel was characterized by different type of SP Fig. (5).
Within-subject test-retest (indexed by the Spearman rank correlations test – R and coefficient of determination – R2) of the number of EEG channels which are characterized by the same type of SP within the same observation demonstrated very high reliability: R = 0.98-0.99, R2 = 0.96-0.98 (for different subjects). Repeated assessments were done at 1-2 week intervals for each subject.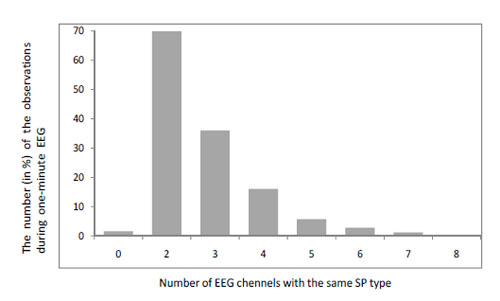 Fig. (5).
The number of EEG channels which are characterized by the same type of SP within the same observation. Data averaged across 10 EEGs (4 randomly selected subjects). Notice that the sum is 133.5%. This is because several groups of EEG channels which are characterized by different SP types can be observed simultaneously during a single observation. For example, during one observation two EEG channels can be characterized by SP of type X, another two channels - by SP of type Y and another 3 channels - by SP of type Z.
The described results suggest that different EEG channels tend to be characterized by different types of EEG short-term SPs. Therefore, EEG short-term SPs are mainly determined by underlying neurodynamic and similarity of SPs is reflects morpho-functional organization of the cortex rather than the effect of volume conduction. - The influence of volume conduction on SPs can be estimated by comparing the composition of SP types and their percent ratio for EEG and MEG registered in parallel. It is well known that MEG is free from volume-conduction effects. Therefore, if volume conduction affects largely SPs than the parameters of the composition of SP types and their percent ratio should be different for EEG and MEG registered in parallel. However, analysis of these parameters has demonstrated that composition of SP types and their percent ratio for EEG and MEG registered in parallel did not differ significantly [55], thus suggesting that volume conduction effects on SP are insignificant.
All electrodes were referred to linked ears (linked-ears reference was obtained digitally from two separate, impedance-checked channels). Raw EEG signals were amplified and filtered in 0.5-30 frequency range and digitized at a sampling rate of 128 Hz by a 12- bit analog-to-digital converter with resolution of 1µV/bit. The impedance of the recording electrodes was always below 5 kΩ. Individual SPs were calculated in the range of 0.5–30 Hz with 0.5-Hz resolution (61 values), using Fast Fourier Transform with a 2-sec Hanning window shifted by 50 samples (0.39-sec) for each channel of one-minute EEG. The types of individual EEG short-term SPs were determined with the help of a probability-classification analysis [5, 82].
Considering the aforementioned findings one may suggest the existence of statistical heterogeneity (anisotropy) of the electromagnetic field in regard to neurodynamics within quasi-stable periods in regional EEGs. Therefore an alternative view as to the dominant role of volume conduction in determination of local SP can be proposed.
Different brain regions show different dominant frequencies, and in some cases show multiple “active” frequencies. Electrical activity of each brain region is homeostatically and functionally regulated, resulting in predictable frequency composition of the background EEG. Indeed, EEG frequencies are determined by the intrinsic properties of the neurons, internal states and functions of brain regions and the overall activity of the brain. The frequency in turn defines the channel of communication [83]. That is, cortical oscillators communicate only with those oscillators that have appropriate frequencies [84]. They do not communicate with the other oscillators even though there might be synaptic connections between them. Thus, various assemblies of oscillators can process information without any cross interference. Therefore, by changing the frequency content of bursts and subthreshold oscillations, the brain determines who talks to whom at any particular moment [85]. In this sense, the brain can rewire itself dynamically on a time scale of milliseconds without changing the synaptic hardware.
Thus, particular frequency bands (indexed by spectral components) reflect different temporal scales of brain operation. When firing is periodic and synchronized in or between neurons belonging to a neuronal assembly there is one state that can be characterised by the frequency of the periodic rhythm or oscillation. This will differ from another state in which different neurons in the same area become synchronized, or the same neurons with a different frequency, for example [86]. Freeman named such synchronization of a shared carrier wave of the outputs of a large number of neurons over an area a ‘wave packet’ [78, 87]. Areas separated by distances exceeding the diameters of wave packets have differing wave forms and therefore different SP types.
It is obvious that state and behavior of each cortex area may be affected (influenced/modulated) by a mixture from multiple primary sources. However, considering that each cortex area is an active system and in each time instant it has its own state, all activities (influences) from multiple primary sources are not just mixed, summed or averaged in a given cortex area, but are integrated within the current state (activity) of this area.
In this sense local SP represents a functional source, which is defined as the part or parts of the brain that contribute to the activity recorded at a single sensor. A functional source is an operational concept that does not have to coincide with a well defined anatomical part of the brain, and is neutral with respect to the problems of source localization and volume conduction [88, 89]. In this terminology, a functional source is the lowest level of spatial resolution of a particular type of measurement.
One may argue that at times when the EEG is dominated by a certain oscillatory pattern the estimated short-term SP might have physiological meaning. Indeed, neurophysical modeling of EEG power spectra [17, 80, 90] demonstrated that frequency spectra can be computed from basic physiological quantities and that EEG spectra provide physiologically meaningful information on the neuronal substrates underlying the EEG. Experimental studies support this analytical work by showing that artificially-induced modification of the underling neurodynamic properties is associated with changes in spectral components [55, 91].
Taken together the observed studies suggest that (a) local EEG short-term SP of particular type reflects the actual state of the neurons in underlying network and is sensitive to morpho-functional organization of the cortex and (b) the degree of volume conduction influence on SP is insignificant.
Relationship Between Morphology of EEG Short-Term SP and the States of the Underlying Neurodynamical System (i.e. Neuronal Assembly)
Analysis of the shape of different EEG short-term SPs revealed that the whole SPs diversity during resting conditions (closed and open eyes) can be subdivided in 6 categories based on morphology of SPs [92]: (1) SPs with only one power peak, which occupies any one frequency bin, (2) SPs with only one power peak, which occupies any two adjacent frequency bins, (3) SPs with only one power peak, which occupies any three adjacent frequency bins, (4) SPs with all possible combinations of two power peaks, (5) SPs with all possible combinations of three and more power peaks and (6) unique SPs which are not among other categories and each of them has occurred in the EEG very rarely. As explored in our early work [5], the category of unique SPs is comprised of SPs which reflect transitory or disorganised episodes in the EEG.
Moreover, there is a stable number of SPs which contributes constantly to each category of SPs independently on condition (closed vs open eyes) [92].
Considering extensive data on how SP morphology depends on neurophysiological parameters and nonlinear measures [17, 93-100], the data on SP morphology can be interpreted functionally in terms of states of the underlying neurodynamical system i.e. neuronal assembly.
Thus, in the language of systems theory, significant sharp peaks in the spectral power characterise resonant behaviour of the system studied. One might refer to the resonant frequency channels as the ‘natural frequencies’ of the system. Indeed, neurophysical modeling of EEG power spectrum and the use of the entropy of the power spectrum demonstrated that the sharpness or broadness of the peak in the EEG spectrum reflects the degree of (dis)order in the neurodynamical system [93, 95, 96]. Here spectral entropy measures the flatness of the frequency distribution. The spectral entropy is highest for a broad, flat spectrum and lowest for an uneven narrow, peaked distribution [101]. An experimental study [92] revealed that the vast majority of EEG short-term SPs have one sharp power peak suggesting that the underlying neurodynamical system (neuronal assembly) is characterised by resonant ordered behaviour with low entropy in short-term temporal scale. Increasing sharpness of spectral peak in this sense reflects decreasing complexity or increasing order of the underling dynamical system [95]. This may be due to an enhanced neuronal synchronisation with an increase of coupling strength (i.e., the degree of cooperation) between various neuronal elements within cortical network generating the EEG signal, i.e. in-phase coherent oscillators causing a lower complexity of the CNS. At the same time, the amplitude of the peak depends on the excitation received by the population [99].
The number of peaks in the EEG spectrum is also an important functional characteristic. Thus, the number of peaks in the EEG spectrum reflects the complexity (number of neuronal assemblies) of the neurodynamical system [97, 99]. Indeed, an increased complexity may be caused by a dominance of the number of weakly coupled or independent oscillators attributed to various neuronal networks with independent frequencies [95, 102]. Thus, the number of different peaks in EEG spectrum depends on the complexity of the signal which reflects the number of active neuronal populations [18, 99]. In the experimental study [92] it was demonstrated that up to 36% of all short-term EEG SPs during resting conditions (closed and open eyes) have two or more sharp power peaks, thus reflecting the activity of two or more neuronal assemblies with resonant ordered behaviour within each individual assembly [93, 95, 97].
The functionality of the position of an individual spectral peak has been demonstrated in a number of studies. Thus, the position of an individual spectral peak in a frequency band is determined by the kinetics of the ensuing population dynamics [97, 103] or finely depends on the average gain of the excitatory and inhibitory synapses within a region, without modification in the synaptic kinetics: by increasing the average gain of fast inhibitory synapses, the peak moves to the right [99]. Additionally, it was shown that stronger intrathalamic interactions and weaker intracortical excitation are associated with higher alpha peak frequencies [17]. Smaller values of ‘synaptodendritic rate’ enhance the low-pass filter properties of the synapses and dendrites, and correspond to less high-frequency (≥ 30 Hz) activity in the EEG, whereas larger values of ‘cortical damping rate’ are associated with sharper, larger-amplitude and slightly higher-frequency peaks in the EEG spectrum [104]. Since ‘cortical damping rate’ is the ratio of the average axonal propagation speed and the typical range of cortical pyramidal axons, increased ‘cortical damping rate’ is associated with faster transmission or shorter effective ranges [17]. The location of the alpha peak in model spectra depends on the inverse of ‘the axonal delay’ – corticothalamic loop delay. More negative ‘interactions between the thalamic relay and reticular nuclei’ corresponds to power peak in beta frequency band. Sensitivity analysis [17] suggested that stronger interactions between the thalamic relay and reticular nuclei contribute to shifting of the power peak from low-frequency band to beta and gamma frequency bands. Reductions in ‘gains for excitatory cortical interactions’ tend to decrease power peak in delta frequency band and increase peak in beta and gamma power, while reductions in ‘gains for inhibitory cortical interactions’ decrease power peak in theta frequency band [17]. The empirical studies [92, 105, 106] demonstrated that the position of the individual spectral peak depends on the functional state of the brain. Thus, the position of the individual spectral peak is located around 10 Hz during closed eyes and around 1.5 Hz during open eyes.
Additionally, the position of the individual spectral peak may reflect the size of the underlying neuronal assembly. Indeed, higher frequency oscillations are confined to small neuronal assemblies, whereas very large networks are recruited during slow oscillations [107-110]. It is because most neuronal connections are local [111] and the period of oscillation is constrained by the size of the neuronal pool engaged in a given cycle [112].
Finally, several modeling studies demonstrated that EEG SP indeed depends on neurophysiological parameters thus reflecting low-level physiological processes [15-18, 100]. For example, increasing the excitatory synaptic time constant causes a slowing of the dynamics, with an excess of power at lower frequencies. Whereas increasing the excitatory synaptic maximum depolarization causes a marked increase and sharpening of the spectral mass of the lower-frequency mode. There is a noticeable change in the SP as the gain is increased, with an increase in the characteristic frequency and a broadening of the power spectrum.
Taken together the observed studies suggest that morphology of EEG short-term SPs reflects (a) the number of the underlying neuronal assemblies, (b) the degree of (dis)order in the neuronal assembly, (c) the natural frequency, size and the state of neuronal assembly.
Physiological Mechanisms of Different SP Components
EEG spectral pattern is characterized by several spectral components which are spectral powers within internationally agreed frequency bands: delta (0.1–3.5 Hz), theta (4–7.5 Hz), alpha (8–13 Hz), beta (14–30 Hz) and gamma (>30 Hz) bands [113, 114].
These spectral components represent EEG oscillations and are hypothesized to reflect cyclical variation in the excitability of neuronal assemblies [11, 12, 29, 50, 62, 63, 108, 114]. Different SP components may relate to distinct physiological mechanisms [115, 116] Fig. (6).
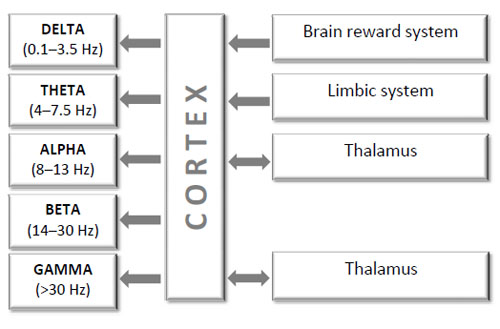
Simplified schematic block diagram of interactions among brain structures which constitute a homeostatic system that generates and regulates EEG oscillations indexed by different spectral components (healthy human). Notice that for most of the frequency bands there are still debates about their exact generators.
Indeed, individual frequency bands are distinct and their experimentally observed frequency ranges show little overlap [117]. Analysis of the wide range of neurophysiological frequencies revealed a logarithmic progression of frequency bands [117] which may offer several advantages for the physiological operation of the brain. If the center frequencies of the various oscillators had integer steps, the various bands would be vulnerable to unwanted interference due to harmonic and sub-harmonic frequencies [117]. Empirical data support this view: neighboring bands within the same brain structure do not occur together. For example, hippocampal theta oscillation does not co-occur with either sleep spindles or delta waves. Similarly, ripples and gamma oscillations are mutually exclusive. Such antagonism between neighboring bands may eliminate the possibility of unwanted interference in the overlapping frequencies [117]. In contrast, distant theta and gamma oscillations [118-120] and delta and beta oscillations [10, 121] are effectively coupled; as well sleep spindles are strongly “modulated” by the cortical slow rhythm [122].
The described logarithmic progression of frequency bands and their functional independence within the same brain structure suggest distinct neurophysiological mechanisms for the generation of EEG oscillations. Several models of neuronal populations describing the basic mechanisms for the generation of these rhythms were presented by Winfree [123], Lopes da Silva et al. [124, 125], Basar [13] and Freeman [14]. These models and several lines of evidence suggest that EEG oscillations in several frequency bands indexed by spectral components are regulated by the interaction between brainstem, limbic system, thalamus and cortex (for the review see [126]). The following processes are believed to contribute to the generation of these distinctive EEG oscillations indexed by different spectral components in a healthy human. However, one should remember that for most of the frequency bands there are still debates about their exact generators.
Delta activity:
Extreme depression of thalamic gates releases some cortical cells from the influences of sensory specific input that, together with diminished activation of the cortex by the ascending reticular activating system (ARAS), results in the production of a very slow rhythm called delta activity [126] (indexed by delta spectral component). Therefore, two source of generation of delta activity can be outlined: (a) cortical which includes anterior medial frontal cortex [127] and distributed cortico-cortical interactions [128-130] and (b) subcortical which includes the common brainstem system [131], the nucleus accumbens [132], the ventral pallidum [133], and dopaminergic neurons in the ventral tegmental area [134].
Thus, delta activity is modulated by the activity of the brain reward systems such as the brain opiate system and the dopaminergic mesolimbic pathways.
Theta activity:
GABA-mediated influences of nucleus reticularis, a thin shell of cells surrounding much of the thalamus, can hyperpolarize cell membranes of thalamic pacemaker neurons, slowing their rhythms toward theta range [126, 135, 136] (indexed by theta spectral component). In parallel with these processes, a mesolimbic system receives multimodal inputs, from the ARAS in the brainstem and collaterals of afferent sensory pathways as well as via the inferotemporal cortex, and distributes this mesolimbic theta activity to a system comprised of the entorhinal cortex, hippocampus, amygdala, septum and anterior cingulate cortex [126].
Alpha activity [126]:
Pacemaker neurons distributed throughout thalamic regions oscillate in the frequency range of the alpha rhythm (with a mean frequency of approximately 10 Hz), regulating and synchronizing the excitability of the cells in the thalamo-cortical pathways. This modulation is further distributed throughout the cortex by cortico–cortical interactions. Small spatially distributed cortical areas seem to act as epicenters from which alpha activity spreads through cortical neuronal networks by interneuronal connections, generating the alpha rhythm (indexed by alpha spectral component) that dominates the resting EEG power spectrum seen in recordings from many scalp regions.
Thus, alpha rhythms are mainly modulated by thalamo-cortical and cortico-cortical interactions [115, 137, 138], where slow alpha oscillations represent the activity in the thalamo-cortical network and fast alpha oscillations reflect the activity in the cortical networks [30, 139].
Beta activity [126]:
The ARAS receives inputs via collaterals of afferent activity from the sensory pathways. Activation of this system by incoming stimuli causes the brainstem reticular formation to inhibit the nucleus reticularis, opposing the GABAergic inhibitory action of nucleus reticularis by acetylcholine and releases its inhibitory actions on the thalamus. The frequency of the thalamic oscillators is increased. Cortical activity is desynchronized in some regions and cortico-cortical interactions generate the beta rhythm (indexed by beta spectral component).
Gamma Activity [126]:
When both somatic and apical synapses or ventrobasal plus centralis lateralis are stimulated concurrently, that is when exogenous and endogenous inputs are co-incident, cortico-thalamic discharges are markedly enhanced, and activity at the gamma frequency back-propagated to the cortical regions where co-incidence had occurred. This feedback from the cortico-thalamic volley binds the distributed fragments and causes coherent cortico-thalamo-cortical loops to reverberate at the frequency of the gamma rhythm (indexed by gamma spectral component).
Investigations on various neuronal classes demonstrated that firing pattern of one neuronal type may be transformed, under certain physiological conditions, into another type [108]. Indeed, the same neuronal network can switch from one type of oscillation to another. Cellular mechanism for this process has been suggested [136]. By changing the resting level of thalamic neurons, the same thalamocortical circuits would be capable of generating low-frequency oscillations, as well as fast oscillations. The model also predicts that the kinetics of GABA inhibitory postsynaptic potentials as well as the intrinsic properties of reticular cells are critical in determining the frequency of oscillations [140]. Thus, intrinsic neuronal mechanisms would dominate for generating the slow waves (0.5-4 Hz), whereas synaptic interactions with cortical and the thalamic reticular nucleus would be required for faster oscillations in the frequency range of 7-14 Hz [141].
Notice, that research has shown that neural populations in the cerebral cortex, hippocampus or cerebellar cortex are all tuned to the very same frequency ranges (for the review see [142]). These findings support the suggestion that all brain networks communicate by means of the same set of frequency codes of EEG oscillations.
Taken together these observations suggest that various EEG oscillations indexed by different spectral components are generated by distinct neurophysiological mechanisms.
Functional Significance of Different SP Components
EEG oscillations indexed by spectral components are phylogenetically preserved, suggesting that they are functionally relevant [112]. What can their functions be?
Neurophysiologically different EEG frequencies appear to be related to the timing of different neuronal assemblies, which are associated with different types of sensory and cognitive processes [143]. Thus, different spectral components reflect functionally different components of information processing acting on various temporal scales.
It was demonstrated that lower frequency oscillations allow for an integration of neuronal effects with longer delays and larger variability in delays and larger areas of involvement [117]. Neural representations based on these oscillations could therefore be complex. In contrast, high frequency oscillation bands allow for a more precise and spatially limited representation of information by incorporating synaptic events from closely located regions with short synaptic delays and limited variability [117].
Neighboring frequency bands within the same neuronal network are typically associated with different brain states and compete with each other [30, 31, 110, 144, 145]. On the other hand, several rhythms can temporally coexist in the same or different structures and interact with each other [108, 110].
As there is extensive data on the frequency-dependent functional significance of oscillatory brain activity [30-32, 76, 130, 139, 146-152; to mention just a few], spectral components should reveal which types of brain functions are involved in a given state, condition or task Fig. (7).
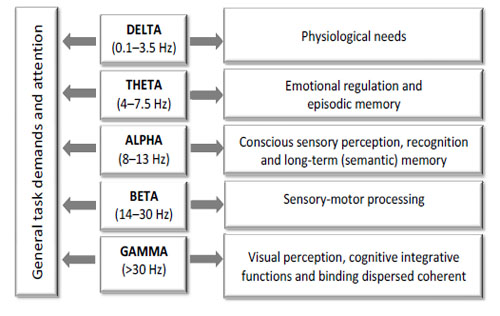
EEG oscillations indexed by different spectral components and associated sensory and cognitive processes in a healthy human.
It is assumed that EEG oscillations are of fundamental importance for mediating and distributing “higher-level” processes in the human brain [31, 32, 152]. Generally, the lower frequencies (3-9 Hz) are associated with general activation, intermediate activity (9-11 Hz) is associated with cognitive integration and higher frequencies (11-15 Hz) relate to sensory-motor processing [153]. The following functions are believed to be associated with distinctive EEG oscillations indexed by different spectral components in a healthy human.
Delta activity (indexed by delta spectral components):
Delta activity is expected to be sensitive to internal stimuli signalling danger for survival (such as hypoxia, hypoglycemia, fatigue, sustained pain), as well as to the stimuli signalling a need for sexual activity (e.g. the level of sex hormones). Indeed, in healthy humans, hypoglycemia is associated with increase delta power [154]. Also, increase of delta oscillations has been observed during sexual arousal and orgasm [155, 156]. In healthy subjects, absolute delta power has been found to decrease after food consumption in the morning after fasting from the previous night [157]. Thus, delta oscillations are associated with behaviour oriented to the acquisition of biologically important goals such as physical maintenance, survival, dominance and mating [158, 159].
Besides physiological functions delta activity participates in mediation of cognitive functions. It was demonstrated that delta activity is related to information detection [26, 129, 150, 160]. Thus, increases in delta activity occur only in those tasks requiring attention to internal processing, whereas attention to external stimuli decreases delta activity [161].
Theta activity (indexed by theta spectral components):
Theta system is expected to be associated with emotional regulation and memory. Indeed, during emotional arousal, neurons in the amygdala produce theta activity [162, 163]. Frontal theta is more marked in subjects who are less neurotic and less anxious [164-167]. The hippocampal theta in humans is involved in discrimination of emotional stimuli [168-171]. Vinogradova [172] suggested that theta activity may serve as a gating function on the information processing flow in limbic regions.
Additionally, theta rhythms are associated with a complex set of cognitive processes which are important for memory: conscious alertness, arousal or readiness [130], episodic encoding and retrieval, recognition memory [148, 151, 173-177], selective attention and episodic memory [31, 129, 178, 179] as well as readout from long-term memory [180-182].
Indeed, based on experimental findings Klimesch [30, 31, 183] demonstrated that episodic memory demands lead to synchronization in the theta band. Klimesch has suggested that theta synchronisation reflects the introduction of cortical activation via cortico-hippocampal feedback loops, and has demonstrated that task-related increases in theta power are related to the successful encoding of new information in episodic memory [31, 173]. Increases in theta are typically associated with increases in mental workload as defined by task difficulty and stimulus complexity [184], whereas decreased theta is found to be associated with incorrect responses on a signal detection task [185] or when tasks become more familiar or easier [186].
Moreover, theta oscillations are involved in the encoding of information particularly during active exploratory movements and spatial navigation [187, 188].
Frontal midline theta has been reported to increase with increased memory load and workload in general [186, 189-191], mental concentration [165, 166, 192-194], focused attention [129, 184, 195] and serves a response controlling function [151].
Several lines of evidence indicate that decreased percentage of EEG segments with theta activity may indicate impaired information processing and decreased working memory load [192, 196] and altered encoding with reduced retrieval [197, 198]. Whereas increase in the percentage of EEG segments with fast theta indicates a relaxed but alert state with focused attention [129, 184; see also 199] and imagery enhancement [200].
Alpha activity (indexed by alpha spectral components):
It is well known that alpha is more than just a spontaneous rhythm (for functional correlates see, [150]) and may be a prototype of the ‘building blocks’ [201] which accompany psycho-physiological events.
Alpha system in humans should participate in instantaneous recognition of environmental patterns by means of matching them with categorized knowledge stored in semantic memory [202]. To accomplish this function, the alpha system has to participate in both perception and memory operations and should be closely associated with mechanisms of attention. Indeed, uniform cognitive operations (e.g. perception, memory coding, memory readout) may enhance synchronization of alpha oscillators whereas complex cognitive operations, which require matching of different cognitive processes (such as recognition of environmental patterns), are associated with alpha desynchronisation [202]. It was demonstrated that alpha relates to primary sensory processing [203], motor behaviour [204], memory processes [30, 31, 173-175] and anticipation [13, 130].
Alpha activity decreases with increases in memory load [191], during selective attention [12, 114], cognitive and memory performance [31]. However, when attention is directed internally towards mental imagery, alpha power at attention-relevant scalp sites is greater than during externally-directed, information-intake tasks, reflecting suppression of external input during the imagery task [205]. Also in this study, when external task load increased, alpha power increased, reflecting the need to suppress competing information sources.
Additionally, it has been repeatedly observed that the encoding of auditory stimuli mainly elicits an increase in alpha amplitude [206], whereas memory retrieval elicits a decrease in the amplitude [207, 208].
Several studies demonstrated that narrow alpha bands have distinct functions. Indeed, topographically widespread lower alpha desynchronization (in the range of about 7-10 Hz) could be obtained in response to almost any type of task. It has been suggested that this desynchronization reflects general task demands and attentional processes [30, 31, 115, 183, 209-213]. Involvement of the lower alpha bands in the attentional processes is confirmed in recent EEG studies [214-220]. Additionally, increased efforts to maintain a state of alertness are related to an increase in tonic lower alpha [31].
Experimental findings suggest that long-term (semantic) memory demands associated with a task-specific desynchronization in the upper alpha band (in the range of about 10-13 Hz)) [30, 31, 183].
The shift towards higher frequencies of alpha activity may also suggest an increase in alertness [221-223] and can be interpreted as reflecting increased excitation of neuronal assemblies. Hence, increase in frequency of alpha rhythm during different tasks may relate to shift in the brain functional state towards a more aroused state. On one hand it is likely that higher central tonus correlates with higher receptiveness (readiness to respond to relevant stimuli) and with increased attention on the other [224, 225]. Thus, upper alpha may reflect task-specific cortical activation [210]. Therefore, fast-alpha-rhythmic segments of EEG may reflect a state of cognitive [209] and cortical neuronal network [139, 210] activation.
To summarise, alpha activity is associated with conscious sensory perception, recognition and semantic memory including such “serving” cognitive processes as general task demands and attention.
Beta activity (indexed by beta spectral components):
Several lines of evidence indicate that increase in the percentage of beta-rhythmical EEG segments suggest an increase in alertness [221-223] as well as attention [226] and can be interpreted as reflecting a state of cognitive or emotional [209] and neuronal [227] activation. Indeed, increased neuronal activity changes the ionic environment of neurons [228] that can lead to increased burst firing of neurons [229] and as a consequence causes the observed shift towards higher frequencies. This interpretation is consistent with the idea that the neuronal assemblies synchronized within beta-frequency band represent a general state of arousal [227] and imply high rates of energy utilization [87].
Additionally, it was demonstrated that beta activity reflects emotional and cognitive processes [209] necessary for sensory-motor processing. It is known that beta rhythm synchronizes after finger, arm, foot [147], mouth [230] and face [146] movement, as well as after imagined movement [231]. Oscillations of ~20 Hz are usually considered harmonic with the mu rhythm, acting in the same way as ~10 Hz frequency for the mu rhythm, and being strictly localized [232]. Fingelkurts et al. [233] reported that the 20.5 Hz spectral component most likely represents a beta rhythm which is separate from the mu rhythm and that this beta rhythm is particularly important for the maintenance of a conscious audio-visual percept.
The increase of beta brain oscillations may also point to focused attention, as beta rhythm has been shown to increase with attention [226].
Gamma activity (indexed by gamma spectral components):
Gamma responses were shown to be involved in visual perception and cognitive integrative function [150, 234-237]. Gamma is crucial for ‘binding’ dispersed coherent assemblies [238-241].
Altogether, the observed studies suggest that different EEG oscillations indexed by different spectral components have distinct set of functional operations. At the same time, each oscillation is related to multiple functions and a given function is often manifested by means of multiple oscillations.
Taken together the last two sections suggest that different EEG oscillations (indexed by different spectral components): delta, theta, alpha, beta and gamma oscillatory systems act as resonant communication networks through large populations of neurons (for a review, see [150]). These resonant communication networks (distributed oscillatory systems) may provide a general communication framework parallel to the morphology of distributed sensory networks [150]. Indeed, almost all brain areas are tuned to be activated or resonate with the EEG frequencies [26, 130, 242, 243].
In this context particular EEG frequencies occurring at particular time intervals can be considered as EEG “letters” of the EEG code, whereas combinations of different frequencies build up EEG “words” [224]. The distribution of such an EEG code in different brain areas is regarded as EEG “syntax” of the “brain language”, whereas the whole-brain-work that follows the super-synergy is the “sentences and the discourse in the language of the brain” [142].
Thus, one type of SP (EEG word X) differs from other SP type (EEG word Y) by virtue of preferential association with a distinct subset of the totality of neural processes. Here, one type of SP (EEG word) is an expression of the superposition principle according to which integrative brain functions are obtained through the combined action of multiple EEG oscillations (EEG letters) [142].
Developmental Changes of SP Components
Numerous studies demonstrated that spectral components exhibit developmental changes which reflect maturational changes in the EEG [245-259]. Each spectral component develops in a certain temporal order during childhood, youth and adolescence.
Indeed, several studies have shown that the delta [253; ages: 2–6 weeks, 7–14 weeks, and 4–12 months], theta [254; ages: 8–11 month olds], and alpha [255; ages: 32–41 weeks old] bands undergo systematic development in infancy.
EEG spectral components continue to change during childhood. Matousek and Petersen [247, 248], Dustman et al. [256] and Clarke et al. [257] demonstrated that delta and theta activity were dominant until the age of 4 years, with both decreasing with age, whereas alpha and beta activity increased throughout childhood. Relative alpha amplitude increased until about age 24. Relative beta amplitude was smallest in 4–8 year olds and then steadily increased. The theta/alpha and theta/beta ratios decreased with increasing age. Gasser et al. [251, 252] found that relative delta, theta and alpha-1 activity decreased with age and higher frequencies increased. A strong complementary replacement of theta by alpha-2 activity was found up to the age of 14.
Developmental studies [258] have reported changes in rhythmic activity in the posterior regions, showing transitions from no measurable posterior basic rhythm in newborns to 4–6 Hz in the first year after birth and progressively increasing to the adult mean of 10 Hz by ages 10–16. Recent findings are consistent with earlier reports suggesting that the maturation of the alpha rhythm is not complete until the age of 16 [259].
Those spectral components which exhibit parallel maturation are separated from each other by their topographic peculiarities in EEG maturation. Indeed, Benninger et al. [256] found that theta activity decreased as alpha increased, and that the speed of change in occipital areas was almost twice that of central areas. Gasser et al. [252] demonstrated that delta, theta and alpha waves developed earliest occipitally, followed by parietal, central and then frontal regions, whereas beta waves developed earliest in central regions, followed by posterior and then frontal regions.
These developmental changes in spectral components reflect a number of structural changes that take place across childhood, adolescence and into young adulthood [260, 261].
Indeed, absolute EEG power declines with age over adolescence and coincides with grey matter volume reduction resulting from synaptic pruning over adolescence [261]. Boord et al. [260] showed that reductions in estimated cerebral metabolic rate co-varied linearly with declines in slow-wave power over the age-span and that these relations are strongest for the subjects under 20 years of age.
MRI studies have shown that anterior and superior regions of the frontal cortex are some of the last regions to mature, between 12 and 30 years of age [262, 263].
In summary, maturational studies of spontaneous EEG activity in healthy children and adolescents have consistently reported that measures of total power, absolute power, and the distribution of relative band power vary considerably with age.
Heritability of the Individual SP and its Components
A lot of studies have demonstrated that, to a large extent, most of the EEG power spectrum across the scalp is determined genetically [264-270] (for a review and meta-analysis, see [271]). Thus, the heritability of brain oscillations obtained under resting conditions is estimated to be between 80% and 90% [267].
Eischen et al. [272] demonstrated that the correlations for spectral power between family groups were greater than those obtained from the non-families for theta, alpha, and beta band power. The correlations for mean frequency between family members were also greater than those of the non-families for the delta, theta, and alpha bands, although these were not as robust as the spectral power findings.
Genetic correlations between spectral components indicated that half to three-quarters of the genetic variance can be attributed to a common source and this common source is not a common environment in EEG power [270]. It was suggested that the separation of broad bands on the basis of EEG power has little basis in its genetic architecture. In contrast, EEG powers at different frequencies share a common genetic source [270; see also 273].
A common genetic source for EEG power may reside in common influences on cerebral rhythm generators like the central ‘‘pacemaker’’ in the septum for hippocampal slow-wave activity (3–4 Hz) or the thalamo-cortical and cortico-cortical generators of cortical alpha activity [12, 114]. Another possible source could lie in genes directly involved in the bioelectric basis of the EEG signal itself [270]. Indeed, genes influencing the number of pyramidal cells, the number of dendritic connections and their orientation with respect to the scalp may directly influence the mass dendritic tree depolarization of pyramidal cells in the cortex that underlies EEG power [274]. Genes common to all frequencies may also affect EEG power through effects on the conductive properties of the tissues surrounding the cortex. However, considering the discussion on volume conduction presented above effects on the conductive properties cannot be the main source for EEG power.
Taken together the observed studies establish EEG power spectrum to be one of the most heritable complex traits in human subjects. The results show that in adult subjects EEG power at rest is a heritable trait across the entire frequency spectrum. No evidence was found for common environmental influences on the EEG power spectrum.
Intra-individual Stability of the Sets of EEG Short-Term SPs and their Percent Ratio
As a first measure of EEG short-term SPs and their percent ratio stability the coefficient of variability (CV = standard deviation / Mean) for averaged probability-classification profiles (PCPs, which indexes sets of SPs and their percent ratio) across all 1-min EEGs separately for each subject, EEG channel and session was calculated [275]. CV ~1 indicates nearly random process, whereas CV<<1 reflects very high stability. It was demonstrated that EEG short-term SPs and their percent ratio (indexed by PCP) were highly stable across all 1-min EEGs within the same subject and the same recording session (CV ranged from 0.0 to 0.6 for different EEG channels and subjects). This is consistent with other studies which have reported the inherent stability and reliability of spectral power during resting conditions within the same recording session [276, 277]. Salinsky et al. reported that repeated 20-s segments of EEG were about 82% reliable, EEG segments of 40 s were about 90% reliable and at 60 s they were approximately 92% reliable [278]. Such stability can be explained by the fact that diversity of SPs is restricted and depends on the functional brain state or cognitive task [5, 92]. This finding suggests that the brain “maintains” a particular composition of EEG oscillations and their percent ratio (indexed by short-term SPs) during a given functional state. PCP can be viewed here as a representation of the composition of different types of neuronal integral dynamics and their percent ratio. Thus, PCPs reflect the probability of the occurrence of particular neuronal dynamics which altogether constitute a dynamic repertoire of brain activity in the particular functional state.
In order to test individual temporal stability and reliability of the sets of EEG short-term SPs and their percent ratio, the calculation of within-subjects reproducibility upon repeat testing (test-retest reliability) was used [275]. The sets of types of EEG short-term SPs and their percent ratio for the same individuals showed high similarity between the two test sessions and specificity for all examined conditions (Table 1). Within-subject test-retest reliability was significantly higher for cognitive task compared to resting conditions and it was higher for anterior cortex areas than for parietal cortex areas [275]. Thus, intra-individual sets of EEG short-term SPs and their percent ratio cannot be random because “…by definition chance findings do not replicate” [279, p. XI]. These findings might be the manifestation of intra-individual stability of underlying neurodynamics and homeostatic and functional regulatory mechanisms.
Within-Subject Test-Retest Reliability (Indexed by the Coefficient of Determination – R2) of Sets of EEG Short-Term SPs and their Percent Ratio. Values Averaged Across 12 Subjects and Presented as Mean ± Standard Deviation
| Conditions | R2 |
|---|---|
| Closed eyes | 0.63 ± 0.05 |
| Open eyes | 0.53 ± 0.03 |
| Waiting, OE | 0.74 ± 0.04 |
| Encoding, OE | 0.77 ± 0.04 |
| Keeping in mind, OE | 0.77 ± 0.05 |
Repeated assessments were done at 1-2 week intervals for each subject. Spearman rank correlations test was used.
Individual EEG short-term SPs were calculated on 2-sec EEG epochs with 50 points shift (0.39-sec).
To average the correlation coefficients across the subjects, the correlation coefficients were converted into so-called Fisher Z values. It is necessary since an average of correlation coefficients across the subjects does not represent an "average correlation" in all those subjects because the value of the correlation coefficient is not a linear function of the magnitude of the relation between the variables. Thus, before averaging, correlation coefficients were converted into Fisher Z values (which are additive measures), using the following formula:
Z = 1/2 * log [(1 + r) / (1 – r)], where r is the correlation coefficient.
In order to evaluate the correlation between variables, it is important to know the "magnitude" or "strength" as well as the significance of the correlation. To obtain the strength of the relationship the correlation coefficients were squared, resulting in the values (R2, the coefficient of determination) that represent the proportion of common variation in the two variables. Multiplied by 100, this proportion of variance indicates the percentage of variance that is explained by the regression function. ‘‘Closed eyes (CE)’ and ‘open eyes (OE)’ = resting conditions; ‘waiting’, ‘encoding of the actual visual matrix object’, and ‘keeping in mind of the perceptual visual image’ = multi-stage memory task.
Consistently, a number of studies showed that different EEG spectral components are highly stable over time during rest, cognitive tasks and psychopathology [277, 278, 280-282]. Thus, Burgress and Gruzelier [283] reported average reliabilities of 0.81 and 0.86 for theta and alpha bands in resting, eyes open EEG with a test-retest interval of about 1 h. Test-retest correlation coefficients for EEG power, after a 12–16-weeks interval between measurements, are high ~0.8 for both absolute and relative power [265, 278, 284]. For longer intervals (with an average of 10 months), the test-retest reliability stays ~0.7 [277]. Even over a time period of 5 years the EEG SPs demonstrated high stability [285].
Each of the spectral components demonstrates high temporal stability scores. Thus, temporal stability (an average period of 1.77 years) scores are highest for theta (0.82-0.95, average 0.98) and alpha (0.84-0.96, average 0.91) spectral components. Stability of beta band power (0.52-0.93, average 0.82) suggests more change over time than alpha and theta, and delta shows lowest stability, varying from 0.60 to 0.87 (average 0.69) [270].
Taken together, these results demonstrate that not only different frequency bands are more or less temporally stable and reliable, but in fact, the whole composition of types of EEG short-term SPs and their percent ratio are highly stable and temporally reliable. Moreover, the degree of this temporal stability depends on functional state of the brain and cognitive task. Thus, the obtained results suggest that the actual composition of types of EEG short-term SPs and their percent ratio possess distinct trait-like qualities as indicated by (a) within-subject stability over EEG recordings; (b) high reliability over time and (c) high specificity for each of the examined conditions.
Discrete Dynamics of EEG Short-Term SPs
It was demonstrated that even during resting condition when the eyes are closed, the relative incidence of the SP type change during the transition between neighboring EEG epochs is more than 0.50 [5]. Considering that this data refers to the level of variability of SPs in the neighboring epochs which overlapped by 80%, this value is very high. Such high incidence of the SP type change during the transition between neighboring EEG epochs most likely reflects discrete dynamics of EEG short-term SPs. This is in line with the work of Adak [286] who demonstrated that the spectrum of piecewise stationary processes changes abruptly over time. This apparent abrupt “switching” from one dynamic to another is characterized as multivariability, with new patterns being continually created, destroyed, and subsequently recreated [43]. This finding relates to the discrete (but not independent) work of the different morphological brain systems [287, 288] (for reviews see [289] and [9]). Additionally, functional sensitivity of the incidence of the SP type change during the transition between neighboring EEG epochs has been demonstrated. Thus, the SP types changed more frequently during an increase in the functional loading such as eyes opening and then the memory task [5].
Analysis of SP type change in the neighboring epochs at different time shifts between them revealed that the SPs of the neighboring EEG epochs within the same EEG only have a significant deterministic influence on each other where the overlap in epochs is no longer than 50 points of sampling rate. At greater shifts between the epochs, the estimations of the SP type alternation decrease practically to a stochastic level [5].
It is suggested that discrete dynamics of short-term EEG SP depicts EEG piecewise stationary structure where dynamics of the brain EEG field is represented by the intervals of quasistability or “microstates” and by sudden transitions between them [290, 291]. Notice that the transition (sudden jump) between states per se is not a gap, rather it is a continuous process (in time) from one state to another; it is only the rapid speed of the transition relative to the time spent in each “state” that makes transition appear as a rapid shift [9, 47].
Taken together the observed results demonstrate the discrete dynamics of EEG short-term SP and suggest that the multi-variability of neuronal networks is discrete in time, and limited by the dynamics of the short quasi-stable brain states [47].
To summarise, converging evidences observed in the previous sections point to the following conclusion: EEG short-term SP of particular type may be considered as a single event in EEG phenomenology from the viewpoint of its preferential association with the actual state of the neurodynamical system i.e. neuronal assembly and with a distinct subset of the totality of brain functions including sensory and cognitive processes.
Therefore, the parameters of the composition of types of EEG short-term SPs, their percent ratio and the peculiarities of its alternation in the analyzed EEG may provide more adequate characteristics of the brain operational activity than conventional spectral analysis. Whether the parameters of the composition of types of EEG short-term SPs and their percent ratio are meaningful ultimately depends on their association with the behavioral trait, cognitive activity, psychopharmacological influence or neuropsychopathology. This will be considered in the following section.
Functional Relevance (Consistency) of EEG Short-Term SPs in Accordance with the Changes of Functional Brain State, Cognitive Tasks and with Different Neuropsycho-Pathologies
This section describes the main experimental and empirical findings on the EEG temporal and spatial microstructure in terms of EEG short-term SPs covering the last 10 years of research of our research group.
How Many Types of EEG SPs Exist?
Studies demonstrated that EEG can be described by a limited set of short-term SPs types (9-25 for different conditions) for the number of functional states, cognitive tasks, pharmacological influences or neuropsychopathologies [5, 6, 54, 55, 82, 92, 233, 292-295]. This means that the EEG signal consists of a restricted number of typical quasi-stationary segments [56, 296, 297] Fig. (8). This suggests that there are distinct classes of brain (cognitive and mental) operations [298] and that they can be distinguished by SP types.
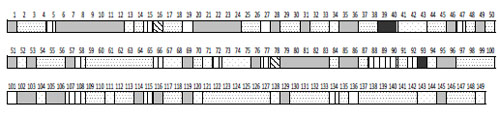
A sequence of EEG segments of different type each characterized by distinct type of short-term SP for one-minute O1 EEG channel (resting condition, closed eyes).
It can be seen that the sequence of SPs is far from being homogenous Fig. (8). Even without any type of external stimulation the brain passes through variations of SP types. In such a way, the dynamics of brain activity can be considered as a sequence of relatively stable and fixed EEG segments indexed by distinct SP types.
This channel is characterized by 7 types of different EEG SPs. Each type of SP is indicated by different color/pattern (the same spectral pattern types have the same color or pattern). Numbers indicate 149 spectral patterns calculated on 2-sec EEG epochs with 50 points shift (0.39-sec). The types of individual EEG short-term SPs were determined with the help of a probability-classification analysis [5, 82]. It can be seen that different types of EEG segments have different duration and that they repeat themselves a different number of times.
Notice, that there is a specific set of types of EEG SPs for each EEG channel or small group of channels [5].
Analysis demonstrated that the total number of SP types was dependent on the functional state of the brain, pharmacological influence and neuropsychopathology Fig. (9). It can be seen that in healthy subjects the total number of SP types decreased along with the increase in functional loading4 with eyes opening5 and then the memory task (P<0.01-P<0.01). At the same time, the number of SP types decreased or increased dependently on which neuromediatory or brain system was affected Fig. (9). Thus, facilitation of GABA neurotransmission in the brain by lorazepam resulted in reduction of the number of SP types (P<0.001), whereas activation of the opioid and dopamine receptors lead to an increase in the repertoire of SP types (P<0.001) when compared with the baseline (placebo). Additionally, the number of SP types was dependent on the type and the number of predominantly impaired brain systems by different neuropsychopathologies Fig. (99). Thus, the number of SP types decreased for interictal EEG without epileptiform abnormalities (sensory brain system is assumed to be predominantly affected) (P<0.001) and increased for depression (affective brain system is predominantly affected) (P<0.001), opioid abuse (affective and executive brain systems are predominantly affected) (P<0.001) and withdrawal (affective, executive and memory brain systems are predominantly affected) (P<0.001) when compared with baseline (norm). The more the number of brain systems affected the greater the number of SP types Fig. (9).
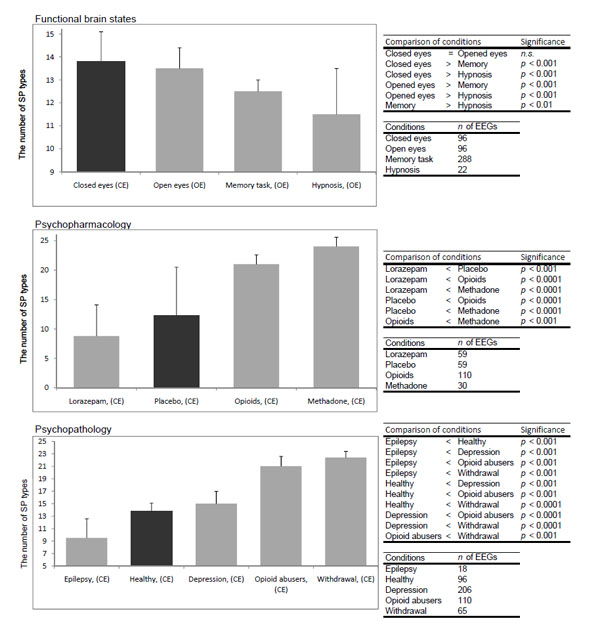
The number of SP types for different conditions. Data averaged across all EEGs per condition and presented as mean ± standard deviation and sorted from smaller values towards larger. Types of individual EEG short-term SPs were determined with the help of a probability- classification analysis [5, 82]. In order to reveal any statistically significant differences between certain conditions, the Wilcoxon test was applied. Statistical significance was assumed where P<0.05.
‘CE’ = closed eyes; ‘OE’ = open eyes; ‘Epilepsy’ = medication-free interictal EEG without epileptiform abnormalities during generalized epilepsy in resting conditions; Dark bar represents functional reference baseline - spontaneous EEG during resting state with closed eyes which is distinct from both sleep and any type of task involving explicit perception, memory or other cognitive activity and provides a priori hypotheses about the way in which the brain will respond across a wide variety of task conditions and brain states.
Taking these findings together suggests that cortical areas are characterized by a limited repertoire of the particular probable oscillatory states indexed by distinct sets of different SP types. For example, results for interictal EEG (without epileptiform abnormalities) may reflect increased rigidity in the brain activity [292] whereas results for opioid abuse and withdrawal may point to increased lability in the neurodynamic.
What is the Functional Importance of EEG SPs of a Different Type?
It was demonstrated that different types of SPs has a different importance for the brain – their occurrence is less or more probable for particular functional state of the brain.
Usually, 3-5 SP types are the most probable when compared with the others for particular state, condition or task. The modeling test demonstrated that the occurrence of the most probable SP types is not random and may have a functional nature [6].
About 50% of all types of SPs occurred no more than 2% of time in the observed EEG signal [5]. These rarely occurring EEG segments most likely characterize the individuality of different EEG channels and/or a subject’s EEG. The remaining 50% of types of SPs were the same for different EEG channels, in all subjects and various brain functional states thus being general. It may be assumed that these general SP types reflect universal micro-temporal quasi-stationary elements [2] which form the EEG “portrait” during macro-temporal transformations of the functional state [7]. Indeed, it was shown experimentally that all significant transformations, detected in EEGs during changes in the brain’s activity, affected only the group of these general types of SPs [5] Fig. (10). Thus, these types of SP are functionally active: their occurrence changed along with alterations in the functional state of the brain or cognitive task.
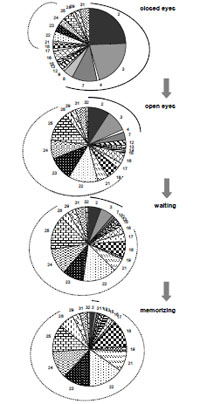
The pie diagrams during consecutive changes of the conditions: closed eyes resting condition (n = 96) changes to open eyes condition (n = 96), which changes to "waiting" stage (n = 288) of the memory task, which is followed by "memorising" stage (n =288) of the memory task for one-minute O2 EEG channel. Data averaged across all EEGs per conditions (for 12 subjects).
The different colors/patterns reflect the percentage of the different SP types. The numbers indicate the labels of types of SPs. The main frequency peaks for each SP type are: 2 - 10 Hz, 3 - 11.5 Hz, 4 - 13 Hz, 7 - 9.5-10.5 Hz, 8 - 9.5-11.5 Hz, 9 - 8.5-11.5 Hz, 11 - 4-8.5 Hz, 12 - 4-10.5 Hz, 13 - 5.5-10.5 Hz, 14 - 6.5-12.5 Hz, 15 - 2.5-8.5 Hz, 16 - 2.5-10.5 Hz, 17 - 2.5-12.5 Hz, 18 - 4 Hz, 19 - 5.5 Hz, 21 - 3-6.5 Hz, 22 - 2.5-4 Hz, 23 - 2.5-3.5-5.5-9.5 Hz, 24 - 2.5-5.5Hz, 25 - 2.5 Hz, 28 - 2.5-4.5-8.5 Hz, 29 - 2.5-4.5-10.5 Hz, 31 - 3-6.5-11 Hz, 32 - 2-6.5-8.5-12.5 Hz. Types of individual EEG shortterm SPs were determined with the help of a probabilityclassification analysis [5, 82]. “Waiting” stage of the memory task = waiting for the presentation of matrix visual stimulus – reflects alertness, arousal or readiness to process information [13, 130]; “Memorizing” stage of the memory task = memorizing of the presented matrix visual stimulus; doted line indicates those SP types percentage of which increases along with the increment of functional loading; the solid line indicates those SP types percentage of which decreases along with the increment of functional loading.
Taken together, these findings suggest that a particular composition and percent ratio of SP types were typical for each of the examined conditions. Perhaps composition and percent ratio of SP types reflect the poly-operational structure of brain activity (for discussion see [6]). Thus, changes in the brain functional state were accompanied by changes in the poly-operational structure of brain activity (indexed by SP types) which describes this functional state.
Perhaps the oscillatory activity of neuronal pools, reflected in composition of brain oscillations, constitutes a mechanism by which the brain can regulate state changes in selected neuronal networks that lead to a qualitative transition between modes of information processing [29].
How Often are the Types of SPs Changed During Transition from One EEG Epoch to Another?
It was demonstrated that even during the rest conditions when the eyes are closed, the relative incidence of SP types change during the transition between neighboring EEG epochs of the same EEG was high: more than 0.50 [5] Fig. (11). This value constitutes 65% from the maximum possible rate and is significantly less (P<0.0001) than stochastic level (0.83 for ‘random EEG’ – EEG for which the natural dynamics of the SP sequence within each EEG channel was completely destroyed, but the percentage ratio between different types of SPs remained the same).
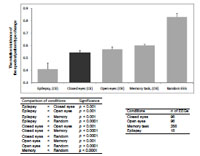
The relative incidence of the SP type change during the transition between neighboring EEG epochs of the same EEG during different conditions. The data is averaged across all EEGs per condition and presented as a mean ± standard deviation and sorted from smaller values towards larger. Types of individual EEG short-term SPs were determined with the help of a probability-classification analysis [5, 82]. In order to reveal any statistically significant differences between certain conditions, the Wilcoxon test was applied. Statistical significance was assumed where P<0.05.
‘CE’ = closed eyes; ‘OE’ = open eyes; ‘Epilepsy’ = medication-free interictal EEG without epileptiform abnormalities during generalized epilepsy in resting conditions; ‘Random EEG’ = surrogate data: each channel of the actual EEG was subjected to a randomized mixing of SPs. In such a way, the natural dynamics of the SP sequence within each EEG channel was completely destroyed, but the percentage ratio between different types of SPs remained the same. Dark bar represents functional reference baseline - spontaneous EEG during resting state with closed eyes.
SP types changed more frequently during an increase in the functional loading such as eyes opening and then memory task (P<0.001-P<0.0001) [5] and less frequently in the interictal EEG without epileptiform activity (P<0.001) [292] when compared with baseline (closed eyes resting condition).
The data presented above refers to the level of variability of SPs in the neighboring epochs which overlapped by 80%. It would be expected that where the epochs overlap to a lesser extent (until they converge completely in time) the variability in type of SPs should increase to a certain value which is characterized by a stochastic level of the SP type change incidence.
In order to find the value of the relative rate of SP stochastic alternation in the actual EEG, it was subjected to a randomized mixing of SPs. In such a way, the natural dynamics of SP sequence within each EEG channel were completely destroyed, but the percentage ratio between different types of SP remained the same. This modified EEG was described as “random”. Using the procedure of randomly mixing SPs, the relative rate of the SP type alternation from the first and to the last interepoch shifts was 0.825 Fig. (11). This value presents an estimation of the maximum possible rate of relative alteration in the type of SPs for a given EEG. Approaching this estimation testifies to the attenuation of mutual SPs determination between the neighboring EEG analysis epochs.
The maximum rate of change in the SP type, equal to 0.82, was reached at the shift in 300 points with closed eyes resting condition (Table 2). This rate remains constant when the time interval between the epochs is increased. The shift at which the maximum rate of change in the SP type approached the value 0.82 was described as critical which characterizes a stochastic level of the SP type change incidence. It was shown that an increase in the functional loading resulted in a decrease of the critical shift to 200 points with eyes opening and to 150 points during the memory task. The shift of the mutual SPs determination was minimal for ‘random’ EEG. Thus, the SPs of the neighboring analysis epochs within a single actual EEG only have a significant deterministic influence on each other where the overlap in epochs is no longer than 50 points. At greater shifts between the epochs, the estimations of the SP type alternation decrease practically to a stochastic level. Notice that for ‘random’ EEG the mutual SPs determination was less than 50 points. This means that the SP types changed more frequently during an increase in the functional loading with eyes opening and then the memory task. At the same time, this process did not reach the values of ‘random’ EEG, thus reflecting the non-ocasional character the findings in the actual EEG.
| Condition | Shift |
|---|---|
| Eyes closed | 300 |
| Eyes opened | 200 |
| Memory task | 150 |
| “Random” EEG | 50 |
‘Shift’ = the number of the points of a digitized EEG signal between the initial moments of the neighboring analysis epochs. ‘Random EEG’ = surrogate data: each channel of the actual EEG was subjected to a randomized mixing of SPs. In such a way, the natural dynamics of the SP sequence within each EEG channel was completely destroyed, but the percentage ratio between different types of SPs remained the same.
Earlier Soroko et al. [302-305] and Bodunov [2, 306-308] have demonstrated that transition probabilities from one type of SP to another in the same subject were unchanged with time progression during the same functional state of the brain. These transition probabilities changed when the functional state changed. Moreover, transition probabilities from one type of SP to another were different in different individuals, thus reflecting individual peculiarities of brain functioning [2, 302-308].
Notice, that change from one type of SP to another occurs rapidly and abruptly. This is an indicator that the brain operates in a stepwise fashion. These steps of brain functioning have been referred as ‘microstates’ [40].
Such apparent “switching” from one dynamic to another during the same condition can be interpreted as multivariability, with new patterns being continually created, destroyed, and subsequently recreated.
What are the Temporal Characteristics of SPs of Different Types?
Considering that each type of EEG segment is characterized by a distinct SP type and considering that a single EEG spectrum illustrates the particular integral dynamics of tens and hundreds of thousands of neurons in a given cortical area and at a particular point in time [50], then the absence of variance of a single spectrum during several analyzed epochs proves that in a given cortical area the same macro-regimen of neuronal pool activity is maintained during that period (see green outline in Fig. 12).
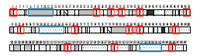
A sequence of EEG segments of different type each characterized by distinct type of short-term SP for one-minute O1 EEG channel (resting condition with closed eyes).
Each type of SP is indicated by different color or pattern (the same spectral pattern types have the same color/pattern). Numbers indicate 149 spectral patterns calculated on 2-sec EEG epochs with 50 points shift (0.39-sec). Types of individual EEG short-term SPs were determined with the help of a probability-classification analysis [5, 82]. It can be seen that different types of EEG segments have a different period of temporal stabilization (as an example, see green outline). Examples of consistent groupings of several types of SPs are illustrated by red outline.
A temporary stabilization in the oscillatory states reflects maintanance of the relative stability in the neurodynamics within that particular time interval [5, 6].
Particular sequences of several types of SPs appeared in consistent groupings (steady bundle with each other) and comprise more integral blocks of EEG structural organization (see red outline in Fig. 12) [3, 31, 309].
What is the Length of Periods of SP Temporal Stabilization?
Analysis of the average duration of the periods of SP temporal stabilization revealed that duration range varies significantly, depending on SP type and the condition (Fig. 13).
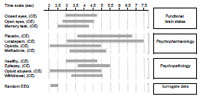
Average periods of SP temporal stabilization for different conditions and different SP types. Data averaged across all EEGs and EEG channels for all subjects per condition. Types of individual EEG short-term SPs were determined with the help of a probability-classification analysis [5,82].
‘CE’ = closed eyes; ‘OE‘ = open eyes; 'Epilepsy' = medication-free interictal EEG without epileptiform abnormalities during generalized epilepsy in resting conditions; 'Random EEG' = surrogate data: each channel of the actual EEG was subjected to a randomized mixing of SPs. In such a way, the natural dynamics of the SP sequence within each EEG channel was completely destroyed, but the percentage ratio between different types of SPs remained the same.
Thus, in average brain “maintains” a stabilization period of neural activity during resting condition (closed eyes) between 2.78 and 4.73 sec (for different SPs). Whereas, for example, for the interictal EEG the duration range was shifted to longer periods: between 3.56 and 5.51 sec (for different SPs) (Fig. 13). In separate cases, the maximum periods of temporal stabilization for the interictal EEG reached 34-60 sec (Fig. 14).
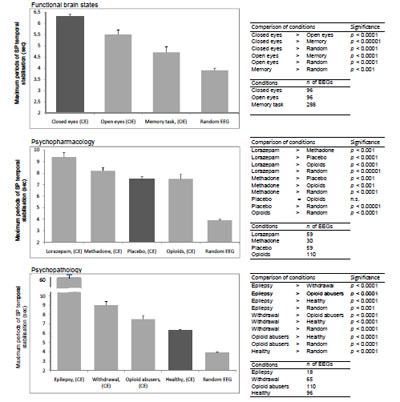
Maximum periods of SP temporal stabilization for different conditions. Data averaged across all EEGs per condition and presented as a mean ± standard deviation and sorted from larger values towards smaller. In order to reveal any statistically significant differences between certain conditions, the Wilcoxon test was applied. Statistical significance was assumed where P< 0.05.
‘CE’ = closed eyes; ‘OE’ = open eyes; ‘Epilepsy’ = medication-free interictal EEG without epileptiform abnormalities during generalized epilepsy in resting conditions; ‘Random EEG’ = surrogate data: each channel of the actual EEG was subjected to a randomized mixing of SPs. In such a way, the natural dynamics of the SP sequence within each EEG channel was completely destroyed, but the percentage ratio between different types of SPs remained the same. Dark bar represents functional reference baseline - spontaneous EEG during resting state with closed eyes which is distinct from both sleep and any type of task involving explicit perception, memory or other cognitive activity and provides a priori hypotheses about the way in which the brain will respond across a wide variety of task conditions and/or brain states.
Each type of SP is indicated by different color or pattern (the same spectral pattern types have the same color/pattern). Numbers indicate 149 spectral patterns calculated on 2-sec EEG epochs with 50 points shift (0.39-sec). Types of individual EEG short-term SPs were determined with the help of a probability-classification analysis [5, 82]. It can be seen that different types of EEG segments have a different period of temporal stabilization (as an example, see green outline). Examples of consistent groupings of several types of SPs are illustrated by red outline.
Importantly, the average periods of temporal stabilization measured in the actual EEG were significantly different from “random” EEG for any condition Fig. (13). The duration and duration range for the ‘random’ EEG were small and were shifted towards short periods. This means that the length of periods of SP temporal stabilization in the actual EEG is much longer than what one would expect if a random sequence of SPs is assumed. This provides evidence for the non-random character of temporal stabilization of the main dynamic parameters of neuronal activity.
Analysis of the maximum periods of SP temporal stabilisation revealed the reduction in the maximum length of periods SP temporal stabilisation along with the increase in the functional loading such as eyes opening and then memory task (P<0.0001-P<0.00001) Fig. (14) [5]. Perhaps, the decrease in the duration of SP stabilisation periods indicates a more dynamic completion of the brain’s operations.
Additionally, such psychoactive agents as lorazepam and methadone and such neuropsychopathological conditions as epilepsy, opioid withdrawal and opioid abuse all lead to considerable increase in the length of the maximum periods of SP temporal stabilisation (P<0.001-P<0.00001) Fig. (14).
Not all SP types last equally long. In different conditions different SP types ‘prefer’ to stabilize temporally. For example, for the interictal EEG of epileptics, the largest maximum period of temporal stabilization was found for polyrhythmic SP, whereas for the EEG of control subjects, the maximum period of temporal stabilization was longest for the 10 Hz alpha-rhythmical SP [6]. Polyrhythmic SP is a peaked power spectrum which does not have any particular dominant frequency and it reflects a disorganised underlying neurodynamic. It was suggested that the percent of this SP type may be considered as a marker of the degree of neuropsychopathology [310].
‘CE’ = closed eyes; ‘OE’ = open eyes; ‘Epilepsy’ = medication-free interictal EEG without epileptiform abnormalities during generalized epilepsy in resting conditions; ‘Random EEG’ = surrogate data: each channel of the actual EEG was subjected to a randomized mixing of SPs. In such a way, the natural dynamics of the SP sequence within each EEG channel was completely destroyed, but the percentage ratio between different types of SPs remained the same.
Notice that maximum periods of temporal stabilization measured in the actual EEG were significantly different from “random” EEG for any condition (P<0.001- P<0.00001) Fig. (14). This means that stabilization of the main dynamic parameters of neuronal activity has non-random character.
What Are the Spatial Relations Among SP Types Observed in Different EEG Channels?
Studies demonstrated that in different conditions different SP type variability among EEG channels was different. For example, SP type variability among EEG channels in the interictal EEG of epileptics registered during resting conditions with closed eyes was significantly lower than in EEG of control subjects [311]. Thus, interictal EEG was characterized by a more homogeneous topological pattern than the control EEG. This may reflect a loss of spatio-temporal complexity in the interictal EEG that suggests that there are spatially more dependent functional processes active in the epileptic brain than in the healthy brain.
Additionally, during the transition between neighboring EEG epochs, the SP type changes in less number of EEG channels in the interictal EEG than in control EEG [311]. Moreover, interictal EEG was characterized by longer periods of temporal stabilization (up to 9.4 sec) for operational modules, which comprise larger number of cortical areas (from 5 to 12) than control EEG [311].
These findings suggest that an epileptic brain is characterized by larger global coordination of brain oscillations from different cortex areas compared to intact brain. This spatial coordination persists for a longer time in the epileptsy condition compared to healthy condition, thus suggesting less dynamic performance of cooperative brain operations – dynamic rigidity [311].
Recent experimental research demonstrated that there is a functional synchronization between SP types found in different EEG channels [Fingelkurts and Fingelkurts, in preparation]. The inter-channel SP synchrony reflects the metastable principle of brain functioning [48, 49]. Thus, the operational acts of behavioral and mental activity are reflected in the periods of short-term metastable states of the whole brain and its individual subsystems [9, 48, 49].
CONCLUSIONS
Observed experimental, theoretical and analytical studies suggest that EEG short-term SP of particular type may be considered as a single event in EEG phenomenology from the viewpoint of its preferential association with the actual state of the neurodynamical system and with a distinct subset of the totality of brain functions including sensory and cognitive processes.
Experimentally it was demonstrated that the parameters of the composition of EEG short-term SP types, their percent ratio and the peculiarities of SP type alternation in the analyzed EEGs depend on behavioral traits, cognitive activity and neuropsychopathology.
The usage of the concept of EEG short-term SP type as a single event in EEG phenomenology and the parameters of the composition of EEG short-term SP types and their percent ratio enable us to reveal or confirm previously reported rules of ongoing brain activity [40, 291, 298, 312, 313,314]:
- Brain activity consists of a limited set of functional states;
- Different functional states may have different duration;
- Not all functional states occur with the same frequency – some of them seem to be ‘preferred’;
- Ongoing brain activity is determined by potentially active states, i.e. those states which are ready to provide necessary activity in the particular circumstances;
- Transitions from one functional state to another are executed abruptly;
- Functional synchronization among different cortex areas is realized by the temporal coincidence of the transitions from one functional state to another going on in different cortex areas;
- Psychopharmacological influence, neuropsycho-pathology, and change of the brain functional state or cognitive task result in the change of (a) the number of types of functional states, (b) the percentage of dominant types of functional states, (c) the transition probability between distinct types of functional states, (d) the duration of functional states and (e) the parameters of the temporal coincidence of the transitions from one functional state type to another registered in different cortex areas;
- A high multi-variability of the EEG parameters co-exists with a simultaneous stabilization of these parameters in time. Thus, the brain dynamics may be viewed here as balancing between multi-variability and metastability;
- Taking into account the hierarchy of the segmental description of the EEG in different time scales, it could be suggested that the discrete structure of brain activity depicted in the EEG piecewise stationary structure is the framework within which a variety of rapid ‘microscopic’ variables of a large system can obey the ‘macroscopic’ operational structure of brain activity. Thus, the spatial and temporal hierarchy of discrete metastable states of neuronal assemblies can serve as a basis for functioning of such a potentially multivariable system like the brain.
Taking together the findings observed in this paper, it seems important to establish repertoires of mental and cognitive operations based on the types of observed SPs.
NOTES
Mesoscopic scale refers to the coordinate behavior of local neuronal assemblies as measured by local field potentials and EEG [42]. According to Freeman [14, 42], mesoscopic effects operate at a spatial scale of ~1 cm and temporal scale of ~100 ms and, thus, mediate between the two extremes of cortex organization: single neurons and the major lobes of the forebrain.
Metastability in the brain refers to competition of complementary tendencies of cooperative integration and autonomous fragmentation among many distributed brain areas [9, 22, 49, 59]. The interplay of these two tendencies (autonomy and integration) constitutes the metastable regime of brain functioning [43, 48], where local (autonomous) and global (integrated) processes coexist as a complementary pair, not as conflicting principles [60].
One should remember that depending on which algorithm is used one might obtain very different results in source localization. For instance, when applying a dipole model the result will very much depend on the preassumptions that were made when determining the number of dipolar sources.
Functional loading has been defined as the amount of processing capacity, physiological activation and attention which are expended during task performance [299, 300].
Opening one's eyes results in nonspecific activation compared to the eyes closed condition [301].
ACKNOWLEDGEMENTS
The authors wish to thank V.A. Ermolaev, R. Ivashko and C. Neves for technical and IT support at different stages of the research program. Spacial thanks goes to Dr. P. Sauseng for valuable comments on ealier virstion of this manuscript and to D. Skarin for proof reading. This work has been supported by BM-Science.

