All published articles of this journal are available on ScienceDirect.

Topographical Organization of Mu and Beta Band Activity Associated with Hand and Foot Movements in Patients with Perirolandic Lesions
Authors Info & Affiliations
Abstract
To study the topographical organization of mu and beta band event-related desynchronization (ERD) associated with voluntary hand and foot movements, we used magnetoencephalographic (MEG) recordings from 19 patients with perirolandic lesions. Synthetic aperture magnetometry (SAM) was used to detect and localize changes in the mu (7 - 11 Hz) and beta (13 - 30 Hz) frequency bands associated with repetitive movements of the hand and foot and overlaid on individual coregistered magnetic resonance (MR) images. Hand movements showed homotopic and contralateral ERD at the sensorimotor (S/M) cortex in the majority of cases for mu and to a lesser extent for beta rhythms. Foot movements showed an increased heterotopic distribution with bilateral and ipsilateral ERD compared to hand movements. No systematic topographical segregation between mu and beta ERD could be observed. In patients with perirolandic lesions, the mu and beta band spatial characteristics associated with hand movements retain the expected functional-anatomical boundaries to a large extent. Foot movements have altered patterns of mu and beta band ERD, which may give more insight into the differential functional role of oscillatory activity in different voluntary movements.
INTRODUCTION
Source localization of motor evoked magnetic activity using magnetoencephalography (MEG) can be based on the detection of task-related modulations of cortical oscillatory activity [1-3]. During the performance of voluntary movements, suppression or event-related desynchronization (ERD) of the mu (7-11 Hz) and beta (13-30 Hz) rhythm has been observed in the contralateral sensorimotor (S/M) areas of healthy subjects [3-5]. Spatial mapping of the mu-rhythm shows different sources in the primary somatosensory (SI) and primary motor (MI) cortex [3]. The beta oscillations have been mainly observed in MI, but in SI as well [6, 7]. Mu and beta ERD is frequently found over the primary hand area during finger movement, however ERD over the primary foot area during toe movement is more difficult to find [4, 8].
Localization of motor evoked magnetic activity was traditionally based on equivalent single dipole (ECD) modeling. Recently, a new spatial filtering technique, called synthetic aperture magnetometry (SAM) has been described as a new tool for neuromagnetic source localization [9, 10]. Statistical differences in the power of the selected frequency band can be evaluated between the active and control state on a per-voxel basis. The areas showing statistical differences can then be displayed on the individual coregistered magnetic resonance (MR) images [11].
Altered activation patterns of the motor cortex have been described in the presence of intracranial lesions, using functional magnetic resonance imaging (fMRI) [12-15] and positron emission tomography (PET) [16] and may be explained by partial neurovascular de-coupling and changes in metabolism. Functional localization of motor cortex using MEG measures neuronal activity directly with a high temporal resolution, but source localization with single ECD modeling was found to be clinically insufficient [17]. Cortical sources involved in motor control can also be studied using SAM-analysis of oscillatory changes of the mu and beta frequency bands, but studies in patients with intracranial lesions are limited [9, 18, 19]. MEG data of the spatial distribution of mu and beta ERD in combination with repetitive foot movements in patients with intracranial lesions have not been described earlier. In this study, we used SAM analysis to study movement-related oscillatory changes in the mu and beta band to identify systematic patterns of topographical organization in the presence of perirolandic lesions.
MATERIALS AND METHODOLOGY
Patients
From the patients with intracranial lesions, referred to the department of Neurosurgery of the VU University Medical Center (Amsterdam, The Netherlands), nineteen consecutive patients were selected with unilateral intracranial lesions around the central sulcus (CS) region eligible for treatment (nine female and ten male, mean age: 42.8 years; age range 29 - 70; Karnofsky Performance Scale score ≥ 70). The study was approved by the Medical Ethics Committee of the VU University Medical Center and informed consent from the participants was obtained prior to inclusion.
MEG Recordings
During voluntary movements, subjects were lying or sitting comfortably with eyes closed, inside the three-layer magnetically shielded room (Vacuum Schmeltze Gmbh, Germany). MEG was recorded with a system of 151 third-order axial gradiometers (VSM MedTech Ltd., Canada), with a helmet shape detector array covering the whole head. Each trial consisted of 30 epochs of 10 seconds with movement (15 epochs) alternated by 10 seconds with no movement (15 epochs). The movement consisted of self-paced repetitive non-clenching opening and closing of the (right or left) hand at about 1 Hz. For foot movements patients were instructed to alternate flexion and extension at the (right or left) ankle at about 1 Hz. The epochs were indicated by presenting a short tone (movement) or short burst of noise (no movement). The sampling rate was 625 Hz and on-line low pass filtering of 100 Hz. Movements were monitored on video and head position was measured before and after the task.
Structural MR images were acquired with a 1.5 T MR scanner (Siemens Sonata, Erlangen, Germany) using T1-weighted magnetization prepared rapid acquisition gradient echo (MPRAGE) sequence. Coregistration of MEG and MR imaging was performed using fiducial markers on the nasion and left and right pre-auricular points. In MEG small coils energised by AC currents and in the MR imager vitamin E capsules were used as markers. MR image registration was performed after MEG registration, with MR markers in the positions as the MEG coils, enabling matching of the datasets with an estimated precision of 2 mm [20].
SAM Analysis
Synthetic aperture magnetometry (SAM) is a spatial filtering technique for three-dimensional source localization of cortical oscillations. Brain activity can be localized by creating differential images of source power changes over discrete time-intervals for both the active and resting-state, relative to their noise variance [21, 22]. Prior to SAM analysis the MEG data were filtered into two frequency bands: mu (7 to 11 Hz) and beta (13 to 30 Hz). The region of interest (ROI) was set to include the whole cerebral cortex with a 2.0 mm isotropic voxel resolution. The statistical evaluation of the ratio of the power differences between the active and resting state to the sum of the powers of noise was assessed for each voxel and expressed as pseudo-T statistics [23]. The pseudo-T values were then displayed and overlaid on individual co-registered MR images. In accordance to previous studies [9], SAM pseudo-T images were thresholded for peak pseudo-T values of 2.5 and the highest peak-value was evaluated for its anatomical localization. The SAM-images were then analyzed for laterality of activation patterns and the localization of the maximum peak.
RESULTS
The clinical data of the patients are summarized in Table 1. Seven patients had an astrocytoma (six WHO grade II and one WHO grade III), five had an oligodendroglioma (three WHO grade II and two WHO grade III), one a mixed oligoastrocytoma (WHO grade II), two a meningioma (WHO grade I), two a cavernoma, one a pilocytic astrocytoma (WHO grade I) and one had a hamartoma. Lesions were located on the left-side in nine cases, on the right in ten cases. Four patients had slight to moderate muscle weakness and fifteen patients had presented with seizures.
Clinical Data Patient Group
| Case No. | Age (years) / Gender | Location / Lateralization | Histology | Symptoms |
|---|---|---|---|---|
| 1 | 57 / F | f-R | oligodendroglioma, II | paresis L-arm (4/5) |
| 2 | 48 / M | p-R | astrocytoma, II | seizures |
| 3 | 70 / F | f-R | meningioma | hemiparesis L (4+/5) |
| 4 | 41 / F | fp-R | meningioma | hemiparesis L (4+/5) |
| 5 | 36 / F | fp-R | astrocytoma, II | seizures |
| 6 | 39 / M | p-L | astrocytoma, II | hemiparesis R (4/5) |
| 7 | 35 / F | p-R | cavernoma | seizures |
| 8 | 48 / F | p-L | oligodendroglioma, II | seizures |
| 9 | 35 / M | p-L | astrocytoma, II | seizures |
| 10 | 54 / M | f-L | cavernoma | seizures |
| 11 | 35 / F | p-R | astrocytoma, II | seizures |
| 12 | 34 / M | f-R | astrocytoma, II | seizures |
| 13 | 37 / M | f-L | astrocytoma, III | seizures |
| 14 | 36 / F | f-L | oligo-astrocytoma, II | seizures |
| 15 | 57 / F | f-R | oligodendroglioma, II | seizures |
| 16 | 42 / M | f-R | oligodendroglioma, II | seizures |
| 17 | 50 / M | fp-L | oligodendroglioma, III | seizures |
| 18 | 31 / M | f-L | pilocytic astrocytoma | seizures |
| 19 | 29 / M | p-R | hamartoma | seizures |
F, female; M, male; f, frontal; p, parietal; fp, frontoparietal; L, left; R, right.
Table 2 shows the topography of mu and beta ERD associated with laterality of hand and foot movements (left versus right) and laterality of tumor (affected versus unaffected hemisphere). All 19 patients had performed separately a motor task of the left and right hand and 13 patients had performed a motor task of the left and right foot. For all 19 patients, beta ERD associated with hand movements was found, resulting in 19 datasets for left and 19 datasets for right hand movements. For mu band activity associated with hand movements one dataset was excluded due to pseudo-T values less than 2.5, resulting in 14 datasets for left and 13 datasets for right hand movements. For voluntary foot movements, seven datasets were excluded with pseudo-T values less than 2.5, resulting in 13 left and 12 right foot datasets for beta band activity. The mu band results with pseudo-T values larger than 2.5 were obtained in 10 left and 10 right foot datasets.
Topography of mu and beta Band Event-Related Desynchronization (ERD) Associated with Laterality of Hand and Foot Movements (Left Versus Right) and Laterality of Tumor (Affected Versus Unaffected Hemisphere)
| TOPOGRAPHY | |||||
|---|---|---|---|---|---|
| contralat. (%) | bilat. (%) | ipsilat. (%) | Total | ||
| HAND | BAND | ||||
| left | mu | 12 (85.7) | 2 (14.3) | 0 (0) | 14 |
| beta | 12 (63.2) | 6 (31.6) | 1 (5.2) | 19 | |
| right | mu | 9 (69.2) | 2 (15.4) | 2 (15.4) | 13 |
| beta | 12 (63.2) | 5 (26.3) | 2 (10.5) | 19 | |
| AH | mu | 11 (78.6) | 1 (7.1) | 2 (14.3) | 14 |
| beta | 12 (62.2) | 5 (26.3) | 2 (10.5) | 19 | |
| UH | mu | 10 (76.9) | 3 (23.1) | 0 (0) | 13 |
| beta | 12 (63.2) | 6 (31.6) | 1 (5.2) | 19 | |
| FOOT | BAND | ||||
| left | mu | 5 (50) | 4 (40) | 1 (10) | 10 |
| beta | 6 (46.1) | 5 (38.5) | 2 (15.4) | 13 | |
| right | mu | 5 (50) | 3 (30) | 2 (20) | 10 |
| beta | 5 (41.7) | 5 (41.7) | 2 (16.6) | 12 | |
| AH | mu | 6 (54.5) | 3 (27.3) | 2 (18.2) | 11 |
| beta | 5 (38.5) | 5 (38.5) | 3 (23.0) | 13 | |
| UH | mu | 4 (44.4) | 4 (44.4) | 1 (11.1) | 9 |
| beta | 6 (50.0) | 5 (41.7) | 1 (8.3) | 12 | |
AH, affected hemisphere; UH, unaffected hemisphere.
Most patients showed contralateral desynchronization patterns (Fig. 1) associated with left or right hand movements. Left hand, presumably non-dominant hemispheric, motor tasks result in contralateral mu band activity in 85.7 % of the trials, compared to 69.2 % of contralateral activity during right hand motor tasks. Ipsilateral mu band activity occurred during right-sided motor tasks for both hand (15.4 %) and foot (20 %) movements. Mu band activity associated with hand movements was located contralaterally in the majority of cases and not related to tumor laterality. The bilateral and ipsilateral mu activation patterns from (right) hand movements were only found in patients with left-sided hemisphere lesions. Contralateral mu band activity associated with foot movements was found in 50 % of the trials for left or right foot movements.
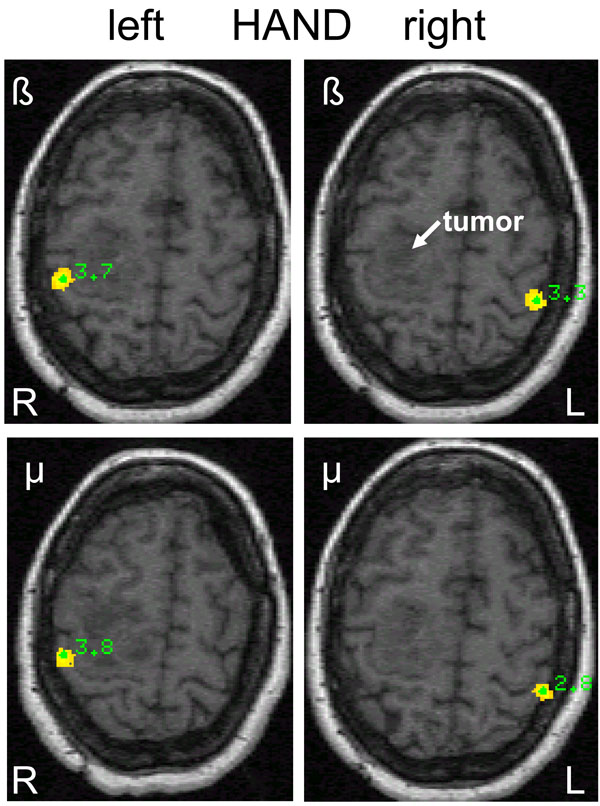
Differential source power (SAM pseudo-T images) corresponding to beta and mu event-related desynchronization (ERD) during left (L) and right (R) hand movements in a 57-year old female (patient 1) with a right-sided premotor oligodendroglioma (WHO grade II) and slight motor weakness of the left arm. Contralateral homotopic beta ERD is seen on the sensorimotor cortex and on the primary somatosensory cortex for mu ERD.
Movement-related beta band activity was found in the contralateral hemisphere in 63.2 % of the trials for both left and right hand movements and was not influenced by tumor laterality. The total of 14 ipsi- and bilateral beta band responses of the hand were equally distributed between left- and right sided lesions.
Bilateral beta band activity of the foot (Fig. 2) was found in ten patients, six had left-sided and four had right-sided lesions. The four patients with ipsilateral beta responses of the foot were evenly distributed between left- and right-sided lesions. From the four patients with clinical motor deficits, only one had ipsilateral mu and beta band activity. In general however, ipsilateral mu and beta band activity was more frequently associated with a motor task of the affected hemisphere (Fig. 3).
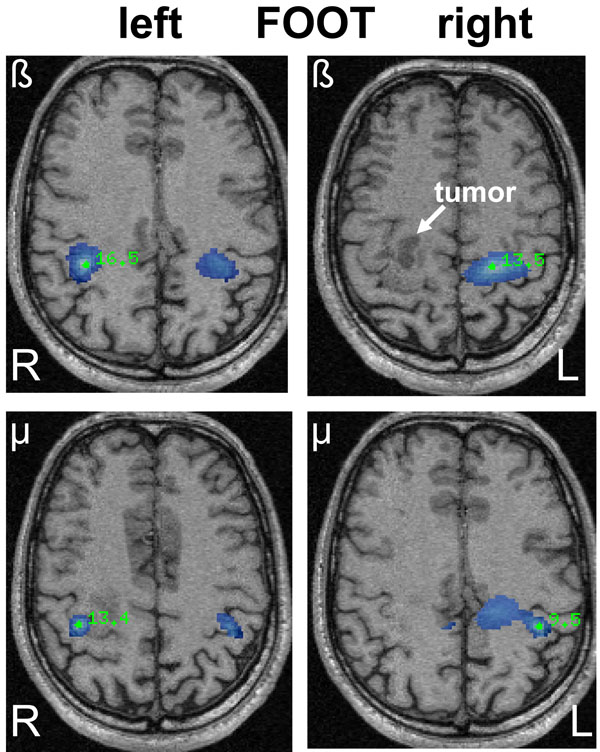
SAM pseudo-T images corresponding to mu and beta ERD associated with left and right sided foot movements in a 42-year old male (patient 16) with a right-sided oligodendroglioma (WHO grade II) in close relation to the precentral gyrus. The ERD areas (blue) show a bilateral and heterotopic distribution for mu and beta rhythms after left-sided (affected) foot movements corresponding to the area of hand representation. Right-sided foot movements show a more diffuse ERD associated with hand and foot representation.
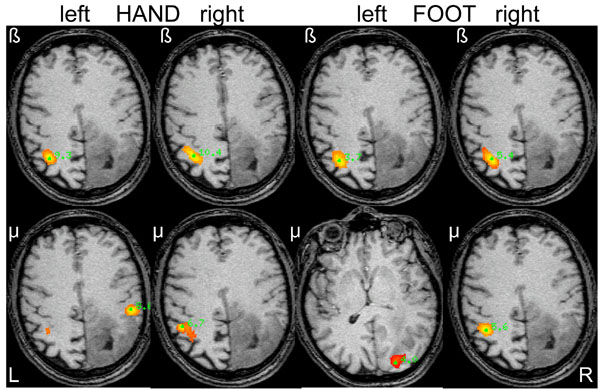
SAM pseudo-T images corresponding to mu and beta ERD associated with hand and foot movements from the left and right side in a 48-year old male (patient 2) with a diffuse large right-parietal astrocytoma (WHO grade II) presenting with seizures. Ipsilateral beta band activity is seen during left-sided (affected) hand and foot movements. Note the heterotopic distribution of foot movements for both mu and beta rhythms.
The spatial somatotopy of the most significant power changes for mu and beta band activity associated with hand and foot movements are summarized in Table 3. Overall, the most significant areas of mu and beta band activity occur in S/M (73 %). Fifteen percent had a clear localization in MI and 5 % in SI. Five percent had a prefrontal localization and 1 % was found in the inferior parietal lobule. Two datasets had an occipital mu localization probably due to alpha interference.
Areas with most Significant Power Changes for Mu and Beta Band During Hand and Foot Movements Contralateral to the Affected and Unaffected Hemisphere
| Location | HAND | FOOT | Total (%) | ||||||
|---|---|---|---|---|---|---|---|---|---|
| AH | UH | AH | UH | ||||||
| mu | beta | mu | beta | mu | beta | mu | beta | ||
| S/M | 10 | 13 | 10 | 13 | 9 | 10 | 8 | 7 | 80 (73) |
| MI | 3 | 4 | 1 | 5 | 2 | 1 | 16 (15) | ||
| SI | 1 | 2 | 1 | 1 | 1 | 6 (5) | |||
| Prefrontal | 1 | 1 | 3 | 5 (5) | |||||
| IPL | 1 | 1 (1) | |||||||
| Occipital | 1 | 1 | 2 (2) | ||||||
| Trials (N) | 14 | 19 | 13 | 19 | 11 | 13 | 9 | 12 | 110 (100) |
S/M, sensorimotor cortex; MI, primary motor cortex; SI, primary sensory cortex; IPL, inferior parietal lobule; AH, affected hemisphere; UH, unaffected hemisphere.
Mu and beta band activity during hand movements with a S/M localization were always located in the area of the hand knob (homotopical distribution). From the 34 datasets with a S/M localization of mu and beta band activity associated with foot movements, eight (23.5 %) demonstrate a heterotopic distribution mostly corresponding to hand movements (Fig. 3).
DISCUSSION
Noninvasive imaging of motor cortical localization in patients with intracranial lesions, has been studied with different modalities, including positron emission tomography (PET) and functional magnetic resonance imaging (fMRI). These modalities do not measure neural activity directly but mainly depict hemodynamic changes with poor temporal resolution and lack the possibility to differentiate between motor and somatosensory activation. In addition, functional MR imaging of the motor cortex can be influenced by adjacent tumor due to vasculature-induced signal changes [13, 15].
SAM analysis of motor evoked magnetic activity recorded with MEG is a relatively new spatial filtering technique to identify cortical regions responsible for changes in spectral power associated with voluntary movements. This technique has been used for noninvasive localization of the motor cortex in neurosurgical patients and demonstrated to be an accurate method for functional localization compared to intraoperative mapping [18, 19]. The presence or location of the tumor did not affect the localization accuracy. Although we did not perform intraoperative comparisons, the spatial filtering technique seems a reliable method to assess the topographical organization of cortical oscillatory activity in our patient group.
Cortical rhythms involved in motor control are the mu and beta oscillations, which have been studied previously with electroencephalography (EEG), electrocorticography (ECoG) and MEG in healthy subjects [3, 4, 8, 22, 24-26]. Comparable studies in patients are limited and mostly relate to patients with epilepsy [24, 25, 27] and intracranial lesions [9, 18, 19]. It is well known that the execution of a hand movement or stimulation of the hand can block or desynchronize the mu rhythm with a clear contralateral dominance in healthy subjects [28]. Analogous to the mu rhythm, beta band activity can be modulated during voluntary movements as well and is supposed to have a precentral somatotopical origin [3, 6]. The results for foot movements however are much less clear [4, 8].
In the present study, mu and beta band spatial characteristics associated with hand movements retain the expected functional-anatomical boundaries to a large extent, where foot movements have altered patterns of mu and beta ERD. With respect to hand movements, several studies from different modalities demonstrate movement-related asymmetry, with a predominant contralateral activation during right hand movements and bilateral activation during left hand movements [29-32]. Our data do not demonstrate this hemispheric asymmetry for left or right hand movements, which is in accordance with other SAM studies in patients with intracranial lesions [18, 19]. Hemispheric asymmetry is likely to occur in the preparatory phase of a movement and is not comparable to our continuous motor task which will contain a mixture of motor and somatosensory reafference, which could explain our findings.
Bilateral and ipsilateral responses in this study were observed for both frequency bands, however more frequently with foot movements. Bilateral activation of motor areas during unilateral voluntary movements has been described earlier with different methods in both normal subjects, stroke patients and patients with intracranial lesions [18, 29, 33-37]. Participation of the ipsilateral sensorimotor cortex in unilateral limb movements could be explained by the partially uncrossed fibers of the corticospinal tract in combination with interhemispheric interactions [37, 38]. The role of concomitant ipsilateral activation seems to be more frequent during a complex movement [30, 39] but can also occur as a mirror response through crossed corticospinal pathways [40]. Since we do not consider foot movements more complex than hand movements probably the mirror response could explain the more frequent bilateral activity. Bilateral activity during hand movements occurred more frequently in the beta band compared to mu band activity. Whether this is due to a larger coupling of beta-band activity between bilateral primary motor cortices or interindividual variability, remains to be clarified.
Ipsilateral motor cortex involvement during unilateral voluntary movements has previously been reported with MEG studies [22, 26, 33] and was also demonstrated using SAM analysis in healthy subjects [41] and patients with intracranial lesions [9, 18]. Exclusive ipsilateral activation in our study was only found in a small proportion of datasets, which is in agreement with Nagarajan et al. [18]. Only one patient with ipsilateral (mu and beta band) activation had slight motor weakness, the other trials with ipsilateral activity were found in patients with seizures and without neurological deficits. Although ipsilateral activation was more frequently found in the affected hemisphere, our data only partially support the hypothesis of Taniguchi et al. who suggested that (sub)clinical impairment of motor areas will result in recruitment of other, especially ipsilateral S/M cortex, which could explain their ipsilateral (beta band) activation patterns in the patient group [9]. Since MEG analysis and thresholding are largely comparable, probably differences in tumor characteristics could explain the differences found. Since our patient group only consisted of one high-grade glioma (WHO grade III) it is possible that ipsilateral recruitment is related to tumor invasion of motor areas and therefore will occur more often in high-grade glioma, as studied by Taniguchi et al.
The topographical distribution of mu and beta ERD with respect to the central sulcus has been suggested to originate from the post- en precentral cortex respectively [5, 6]. In this study, we found no clear precentral origin of the beta band activity, which is supported by other EEG studies [25, 27]. These results support sensorimotor cortex involvement in the generators of both mu and beta oscillations. However, the lack of topographical segregation between mu and beta may be attributed to methodological differences.
In agreement with other neuromagnetic studies involving beta oscillations, we also found a somatotopical distribution to different movements [3, 6]. Hand movements had a predominant localization near the hand area representation and foot movements frequently had a central paramedian localization. Most of the peak-value activations for both mu and beta patterns were found at the S/M cortex or central sulcus region which might support the hypothesis that motor control is strongly linked to sensory information [25]. An alternative explanation could be poor functional specificity due to the selected beta frequency band as 13 to 30 Hz, mixing mu and beta band activity together. Hand movements in our study frequently had a distribution which was in accordance with the anatomically expected hand representation. The cortical representation of foot movements however, was in 23.5 % of the trials for both mu and beta band activity, located at the representation area of the hand. This heterotopic distribution of oscillatory changes in the hand area during non-hand movements has been described earlier in EEG, MEG and fMRI of studies of healthy subjects [8, 26, 36, 42-44]. Recently, Stippich et al. described their experience with heterotopic ipsilateral coactivation on fMRI after unilateral voluntary movements in brain tumor patients, but found no relation with tumor characteristics [36]. In combination with our results, heterotopic activation patterns are probably not due to the presence of intracranial lesions and must be explained by a more widely distributed cortical motor network than the classic somatotopical distribution of the different body parts. Future studies involving quantification of cortical connectivity using graph-analysis of the MEG data during the active and control state, will hopefully give more insight in the complex network involved in cerebral motor control.
CONCLUSION
Spatially filtered MEG can be used to detect and localize changes in cortical activity associated with hand and foot movements in patients with brain lesions. Hand and foot movements predominantly show contralateral activity in the mu and beta band with a frequent localization at the S/M cortex. Bilateral and ipsilateral responses were observed for both frequency bands, however more frequently with foot movements. Mu and beta band spatial characteristics in the presence of perirolandic lesions support previous findings of mu and beta band activity associated with hand movements to a large extent. No distinct topographical segregation between mu and beta band activity could be observed. The results may provide further insight in the generators of oscillatory activity involved in voluntary movements.

