All published articles of this journal are available on ScienceDirect.

Absolute Oxygenation Metabolism Measurements Using Magnetic Resonance Imaging
Abstract
Cerebral oxygen metabolism plays a critical role in maintaining normal function of the brain. It is the primary energy source to sustain neuronal functions. Abnormalities in oxygen metabolism occur in various neuro-pathologic conditions such as ischemic stroke, cerebral trauma, cancer, Alzheimer’s disease and shock. Therefore, the ability to quantitatively measure tissue oxygenation and oxygen metabolism is essential to the understanding of pathophysiology and treatment of various diseases. The focus of this review is to provide an introduction of various blood oxygenation level dependent (BOLD) contrast methods for absolute measurements of tissue oxygenation, including both magnitude and phase image based approaches. The advantages and disadvantages of each method are discussed.
INTRODUCTION
Oxygen metabolism provides primary energy to the normal function of almost all human organs. Neuronal activities of human brains demand high energy and primarily rely on a steady ATP supply generated through oxygen metabolism. Although the brain comprises only 2% of the total body weight, it consumes 20% of total body oxygen. Abnormalities in oxygen metabolism occur in the neuropathologic conditions such as ischemic stroke, cerebral trauma, cancer and shock.
Under pathophysiological conditions, alteration of oxygen delivery, assessed using cerebral blood flow (CBF), and oxygen demand, evaluated using oxygen extraction fraction (OEF), may be viewed as a highly dynamic process [1, 2]. For instance, in response to a reduction of CBF under ischemic conditions, an increase in oxygen extraction fraction generally occurs to maintain a relatively intact neuronal function. Until the OEF reaches the maximally available capacity, the basic requirement for neuronal viability can be maintained. Thus, ischemic brain tissue is theoretically viable for a period of time despite the compromised CBF. However, when the maximal OEF is reached, the inability to maintain normal neuronal function may trigger a cascade of cellular events which could eventually lead to cell death. Therefore, while reduction of CBF indicates an ischemic insult, CBF deficit is not the sole factor that determines tissue viability. Previous positron emission tomography (PET) studies have suggested that cerebral metabolic rate of oxygen utilization (CMRO2) might be a better indicator of tissue viability under ischemic conditions [3-5]. In PET studies, CMRO2 is defined as the product of CBF, OEF, and arterial oxygen content (CaO2). It reflects a balance between oxygen delivery and demand and provides a complete picture of the oxygen metabolism. Therefore, absolute in vivo quantifications of CMRO2 have profound implications to the understanding of brain metabolic activity under both normal and pathological conditions.
Early attempts to assess cerebral oxygen extraction involved the direct measurements of cerebrovenous oxygen content, CvO2 [6]. CvO2 represents the remaining oxygen dissolved in plasma and the residual saturation of venous hemoglobin. Since there is a minimal barrier to oxygen diffusion, CvO2 reflects the amount of delivered oxygen that is not consumed by the brain. This relationship is maintained even under clinically relevant low flow conditions [7]. Many investigators have developed methods for measuring CvO2 or the partial pressure of oxygen in venous blood (PvO2) from within the venous sinuses or jugular system [8-10]. However, these methods only provide a global measure of whole brain oxygenation, which might not be adequate to study focal pathological abnormalities. In addition, these approaches are invasive in nature and carry certain risks, preventing their daily use in a clinical setting.
Near infrared spectroscopy (NIRS) methods have been introduced decades ago to measure oxygen saturation in brain and heart [11]. Oxyhemoglobin and deoxyhemoglobin have different absorptions of near-infrared light of different wavelengths. The relative concentrations of oxyhemoglobin and deoxyhemoglobin are quantified to derive brain oxygen saturation. The recently developed diffuse reflectance methods provide spatially resolved information of tissue oxygenation [12]. Limitations of NIRS methods include adverse effects from skull, cerebrospinal fluid, myelin sheaths, ambient light, and extracranial tissue drainage [13].
To date, positron emission tomography (PET) has been the method of choice for quantitative in vivo estimates of CBF, CBV, CMRO2 and OEF [14, 15]. Regional CBF can be measured using bolus injection of 15O-labeled water. Inhaled 15O-labeled carbon monoxide can be used as an intravascular tracer to measure regional cerebral blood volume (rCBV). CMRO2 can be measured using inhalation of 15O labeled oxygen mixed with air. The gaseous form 15O is bound to hemoglobin and becomes 15O water after oxidate metabolic consumption. After using separate measurements of regional CBF, CBV and arterial blood sampling to obtain arterial time activity and correct for the signal from the un-extracted 15O, quantitative OEF and CMRO2 can then be obtained [16]. OEF measurements have been validated in primates by using intra-carotid injection of 15O labeled oxygen or arteriovenous oxygen difference [16, 17]. However, the invasive nature of PET and the requirement of an onsite cyclotron due to the extremely short half life time of 15O (2 minutes) have made PET measurement of CMRO2 inaccessible to most medical centers for routine clinical usage. In addition, the need of an arterial line for blood sampling to obtain quantitative measurements also makes it impractical for stroke patients who may receive tPA.
MRI has gained preeminence in the area of biomedical imaging research and clinical diagnosis as a result of its sensitivity to a wide range of tissue properties, flexibility, and noninvasive nature. In addition to providing anatomical information, MRI has demonstrated to be a promising modality for functional and metabolic imaging. This breakthrough may be credited, to a large extent, to the discovery of blood oxygenation level dependent (BOLD) mechanisms [18-20]. In the context of BOLD contrast, MR signal depends on deoxyhemoglobin concentration. Relative BOLD signal changes between functional activated and resting states have been widely utilized to detect brain hemodynamic alterations in fMRI [21, 22]. Since the relative BOLD signal change is the end product of several parameters including CBF, CBV and CMRO2, it does not provide a specific and absolute measurement of baseline oxygen metabolism, which is essential to the studies of various cerebral vascular diseases. An absolute quantification of cerebral oxygen metabolism using BOLD contrast is possible by relating MR signal to tissue oxygenation through biophysical signal models. In addition to the BOLD based methods, 17O, an MR visible isotope, can be utilized to measure OEF, CMRO2, and CBF [23-26]. A detailed introduction to various 17O based methods can be found in [26]. In this review, we will focus on the absolute quantification of OEF and CMRO2 using BOLD contrast [26, 27].
SUSCEPTIBILITY CONTRAST MECHANISMS
Depending on the magnetic dipole moments, materials can be classified into three basic categories, paramagnetic, diamagnetic and ferromagnetic materials, respectively. Atoms with an unpaired electron in paramagnetic materials have a nonvanishing permanent magnetic moment, leading to a nonzero dipole magnetic.
Blood is composed of plasma, erythrocytes (red blood cells or RBCs), various leukocytes (white blood cells) and platelets. RBCs contain oxy- (Hb bound with oxygen) and deoxyhemoglobin (dHb without oxygen). The discovery of the paramagnetic and diamagnetic properties of deoxyhemoglobin and oxyhemoglobin, respectively, dates back to 1936 by Pauling and Coryell [28]. In deoxyhemoglobin, the heme iron is in a high spin ferrous Fe2+ state with four of its six outer electrons being unpaired. The unpaired electron spins have large magnetic moments and the associated paramagnetic properties make deoxyhemoglobin behave as an endogenous paramagnetic contrast agent. In contrast, in oxygenated hemoglobin, one of the electrons is partially transferred to an oxygen molecule and the heme iron resides in a low-spin state. Hence oxyhemoglobin exhibits diamagnetic properties.
Susceptibility difference between deoxyhemoglobin and oxyhemoglobin provides a unique MR contrast depending on blood oxygenation level. Thulborn et. al. demonstrated the oxygenation dependence of T2 in blood in an ex vivo experiment [18]. In addition, Ogawa et al found that changes in signal intensity on T2*-weighted images could be observed in vivo through altering the blood oxygenation in a rat study [19, 20, 29]. Relaxation rates R2 and R2* (R2') decreased along with a reduction of the deoxyhemoglobin concentration, leading to BOLD MR signal increase. The discovery of BOLD contrast has led to a rapidly growing research field of either activated or resting functional MRI (fMRI) [21, 22, 30, 31]. In an fMRI study, relative BOLD signal changes are typically employed to study cerebral hemodynamic alterations in response to various external stimuli. In addition, many investigators have demonstrated that BOLD effects can be utilized to monitor the relative changes of oxygen saturation under altered or pathophysiological conditions such as hypoxia [32-38], hyper- and hypocapnia [34, 39, 40], hemodilution [41], and ischemia [42, 43].
However, despite the extensive interest, most of the BOLD related studies only measured relative signal changes. In order to obtain absolute measurements of tissue oxygenation, various biophysical signal models have been proposed to relate R2 and R2* (R2'), and MR phase shift to physiological parameters. In the following section, we will introduce these biophysical signal models and the various MR imaging methods based upon them.
MAGNITUDE SIGNAL BASED METHODS
R2 Approaches
The oxygenation dependence of R2 originates from the irreversible dephasing caused by water exchanging and diffusion through the magnetic field gradient induced by deoxyhemoglobins. By using a Carr-Purcell-Meiboom-Gill (CPMG) sequence, the Luz-Meiboom model describes the relationship between R2 and oxygenation levels through the exchange between two sites that have different frequencies as [44]:
where R20 is the R2 for fully oxygenated blood, τex is the average time required for a proton to move between the two sites at different frequencies; ω0 is the Larmor frequency, α is a coefficient related to the geometry of the erythrocyte and susceptibility of deoxyhemoglobin; PA is the fraction of protons resident at one of the sites under exchange; τ180 is the interval between the two adjacent π pulses in the sequence; and % HbO2 is the fractional oxygen saturation. The parameters in Eq. (1) depend on factors such as pulse sequence, field strength, and the geometry of the erythrocyte. Some of these parameters, including α, PA and τex, are difficult to determine. Wright et al [45] proposed an ex vivo calibration method to compute oxygen saturation from this equation without concerning all parameters and a single parameter K, which is a function of τ180 and ω0, is used to absorb all parameters except (1-% HbO2) as
With ex vivo blood samples and in a range of physiologically relevant oxygen saturation, a calibration curve was obtained between R2 of the blood and its oxygen saturation based on Eq. (2) for a specific sequence and field strength. With the assumption that K is identical between the ex vivo and in vivo conditions, this experimentally determined calibration curve was employed for in vivo experiments to obtain oxygen saturation in the aorta, superior vena cava and pulmonary trunk. Results were promising for these vessels and particularly so for venous blood. Moreover, with a similar approach, Flotz et al. [46] demonstrated that a positive correlation existed between MR estimated oxygen saturation at the descending aorta and the readings from blood gas analysis of the blood samples collected from an intra-arterial catheter placed within the descending aorta. Fig (1) demonstrated an overview of the methods. T2 in coronary sinus was computed from a series of spin-echo images with different echo times. An ex vivo calibration curve was then utilized to convert the blood T2 to blood oxygenation.
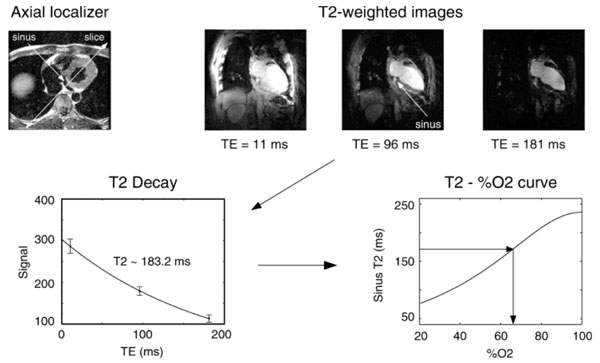
Protocol overview for coronary sinus oximetry. A series of spin-echo images were acquired to estimate T2 in coronary sinus. Blood oxygenation was obtained using an in vitro calibration. For the example shown, sinus blood oxygenation was on the order of 65% (From Foltz et al, Magn Reson Med 1999, 42:837–848, with permission).
By assuming that water exchange between erythrocyte and plasma is rapid and diffusion effect is negligible, Van Zijl et al. incorporated previous works [31,47-50] into a more comprehensive theoretical model and derived an expression of blood R2 as a sum of R2 from plasma, erythrocyte, and a relaxation rate due to water exchange [51]:
where R2,exch is the relaxation rate due to water exchange at two sites with different frequencies [44], i represents arterial, capillary, or venous blood compartment, respectively. With the assumption that water exchange between blood vessels and brain tissue is slow, the signal intensity in the brain parenchyma can be expressed as [51]:
where R2,app is the apparent rate measured through fitting the experimental data to a single exponential function. χtissue and are the volume fractions of tissue and blood, respectively. Similar to the Luz-Meiboom equation (Eq 1), multiple factors including geometry, blood volume, pulse sequence, Hct, magnetic field strength, and venous oxygenation can affect R2. After simplyfing this method by eliminating the signal from tissue, Golay et al. and Oja et al. have measured T2 within voxels only containing pure venous blood. Through an ex vivo calibration, they estimated venous blood oxygenation in large cerebral veins during resting and activation states [52, 53].
Along this direction, Lu and Ge developed a method called T2-Relaxation-Under-Spin-Tagging (TRUST) to overcome the limitations of previous approaches through separating blood signal from tissue regardless of partial volume effects [54]. An overview of this method is given in Fig. (2). Spin labeling principle was utilized to preserve venous blood signal while suppressing tissue signal by subtracting ‘label’ from ‘control’ scans. T2 of the isolated blood signal was measured by employing several T2 weighting scans using flow-insensitive T2-preparation pulses [54]. Similar to previous approaches [52, 53], an ex vivo calibration was used to convert T2 into venous blood oxygenation (Fig. 2c). More recently, Xu et al. combined TRUST method with a phase contrast MRI to measure both venous blood oxygen saturation in the superior sagittal sinus and internal jugular veins and blood flow velocity in major arteries, such as the internal carotid artery and vertebral arteries for a calculation of whole brain global CMRO2. This technique was also utilized to study normal brain aging [55] and the effects of CO2 on brain oxygen metabolism [56]. Lu et al found that venous oxygen saturation in superior sagittal sinus decreased and the global CBF reduced, resulting in an increased global CMRO2 as a function of age [55]. Using 5% CO2 enhanced air, Xu et al demonstrated that venous oxygen saturation and CBF increased, while the global CMRO2 reduced by 13.4%±2.3% [56]. The TRUST method can single out venous blood without the partial volume effects from tissue. Therefore, this method can be utilized within voxels fully or partially occupied by venous blood. However, it is clear from Eq. (4) that MR signal changes caused by the alteration of R2 rely largely on the available blood volume. Since brain parenchyma has cerebral blood volume (CBV) ranging between 2 to 5% under normal physiological conditions [57-62], it is very challenging to measure brain tissue oxygenation [45, 46, 52-54] because of the low sensitivity of R2. To overcome this hurdle, Bolar et al proposed a voxel based method using venous-targeted velocity selective (VS) spin-labeling method [63]. A cutoff velocity Vc was used to only preserve signal from, presumably, post-capillary venular (PCV) blood accelerated from below Vc to above Vc. Signal from fast flowing arteries (>Vc) was suppressed through velocity selection saturation, while static, CSF and non-venular blood were removed through a subtraction between label and control images. T2 from the isolated PCV blood were obtained and converted to venous oxygen saturation (Yv) using an ex vivo calibration curve. An estimate of CMRO2 was then obtained in gray matter using OEF computed from Yv and CBF measured from an ASL scan [63]. This approach, dubbed as QUantitative Imaging of eXtraction of Oxygen and TIssue Consumption (QUIXOTIC) MRI, has been successfully employed to detect venous oxygen saturation increase in response to a visual stimulus [64] and to hypercapnia [65]. To further improve the SNR of QUIXOTIC method, Guo and Wong proposed a strategy to image the PCV blood using VS Excitation with Arterial Nulling (VSEAN) [66]. A slab selective inversion pulse is applied below the imaging plane with an inversion time to null arterial blood. To remove signal from static tissue, two VS modules are utilized to generate a quadratic sine modulation (sin2(πVc)) of longitudinal magnetization. The static and slow moving spins with near zero velocities are suppressed. Compared to QUIXOTIC methods, major advantages of VSEAN method include a higher SNR due to more relaxed venous blood and an improved time efficiency because of no need of a subtraction to remove static tissue signal. Both QUIXOTIC and VSEAN can measure venous oxygen saturation within gray matter but not in white matter due to low signal sensitivity. The cutoff blood velocity assumption may need special attention during altered physiological and pathological conditions.
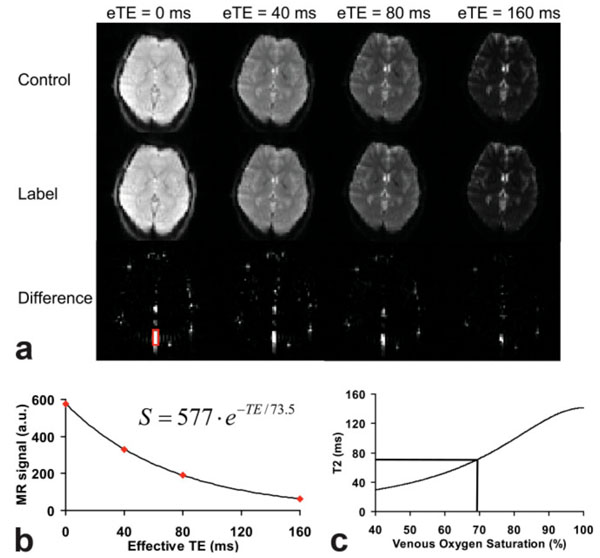
An overview of the T2-Relaxation-Under-Spin-Tagging (TRUST) method. a) magnetically labeled (Label, middle row) or unlabeled (Control, top row) images. Each pair of image is acquired at four different effective TE (eTE). The bottom row is the subtracted image, Control-Label. The red rectangle ROI indicates the region of interest containing sagittal sinus. b) T2 in the sagittal sinus was fitted using a monoexponential function. c) The T2 value is converted to venous oxygenation through a calibration curve. (From Lu and Ge, Magn Reson Med 2008, 60:357–363, with permission).
The advantage of these R2 based approaches lies at their insensitivity to the background magnetic field inhomogeneity. Due to the complex signal dependency on various factors as listed in Eq.(1) – (4), it is very difficult to experimentally determine these factors in vivo. An ex vivo calibration needs to be performed by matching the pulse sequence, imaging parameters, temperature, pH, and Hct in the blood samples with the in vivo scan for accurate calibration. This calibration may be problematic under pathological conditions since many of the physiological parameters may deviate dramatically from their normal values.
R2*/R2' Based Methods
In the presence of paramagnetic materials, spins precess at frequencies different from the Larmor frequency, which is referred to as a frequency shift. Usually, microscopic magnetic susceptibility sources are confined to a specific region or compartment, but their susceptibility effects can extend far beyond the compartment boundary[67]. One such example is the cylindrical body utilized to model blood vessels. Consider a cylinder that has a uniform and constant susceptibility Δχ with respect to background, if the radius, a, is much smaller than the length, the frequency shift outside and inside of the infinitely long cylinder are given in cgs units as [68]:
where θ is the angle between the main magnetic field B0 and the long axis of a cylinder, a is the cylinder radius, ρ is the distance between the point of interest and the center of the cylinder cross-section in the plane normal to the cylinder, and Ф is the angle between this vector and the component of B0 in the plane. The signal alteration is a function of susceptibility Δχ as well as the angle θ in Eqs. (5) and (6). In the case of venous blood vessel, , where Δχ0 is the susceptibility difference between the fully oxygenated and fully deoxygenated blood and measured to be 0.18 ppm in cgs units [69]; Y is the venous blood oxygen saturation. Hematocrit (Hct) is the volume percentage of RBCs in blood, which ranges between 0.4-0.45 in normal subjects depending on the sex of the subjects [70]. As shown in Eqs. (5) and (6), deoxyhemoglobin behaves as an endogenous contrast agent that cause mesocopic magnetic field variations both within and beyond the venous blood vessels.
Numerical and analytical modeling have been proposed to relate MR signal to tissue oxygenation [49, 71-76]. Two mechanisms affect MR signal formation in the presence of local magnetic field inhomogeneities: static dephasing induced by the phase dispersion of spins experiencing different local magnetic fields and signal alteration arising from the water diffusion through the magnetic field gradient induced by susceptibility perturbers. The static dephasing induced time invariant signal loss can be reversed with a spin echo. In contrast, the incoherent phase dispersion accumulated through water diffusion across the varied magnetic field cannot be recovered. These two effects depend on several factors, such as the absolute value of susceptibility differences, pulse sequences and imaging parameters, size and geometric distribution of the susceptibility perturbers, and possibly the orientation of the sources if the susceptibility pertubers are not symmetric in space. Depending on the relative rates of static dephasing and the water diffusion induced signal loss, changes in MR signal can be separated into three regimes (motion averaged, intermediate and static dephasing) [73]. In motion averaged regime, the diffusion rate is much faster than the static dephasing rate. When the diffusion is slow, the system is said to be in a static dephasing regime. When the diffusion rate is comparable to the static dephasing rate, the system is in an intermediate regime.
A numerical model to simulate the static dephasing regime was proposed by Majumdar in 1991 [71]. Majumdar found that the signal decay in gradient echo images was directly related to the absolute difference of susceptibility and the spatial distribution of the susceptibility sources. Furthermore, he found that at a very short echo time, the gradient echo signal deviated from monoexponential decay in both computer simulation and ex vivo experimental data. Based on Monte Carlo simulations to evaluate both the static dephasing and diffusion effects, Muller et al. [49] and Boxerman et al. [74] demonstrated that transverse relaxation rates R2 and R2* had dependence on vessel size. In gradient echo image, R2* increased along with the increase of perturber size for very small vessels, and it remained unchanged when the perturbers were greater than a certain size. On the other hand, the maximal R2 was obtained in vessels with an intermediate size. The different vessel size dependence of R2* and R2 might reveal the geometric dependence on water proton diffusion effects as well as the interplay between the static dephasing and diffusion effects. These Monte Carlo simulations demonstrated that pulse sequence, echo time, vessel size and concentration of contrast agent had significant effects on relaxation rate, while vascular permeability to water and flow of erythrocytes had little effect on it [74].
Yablonskiy and Haacke proposed an analytical model to characterize the MR signal alteration in the static dephasing regime [72]. Three random geometric distributions of magnetized spheres, parallel magnetized cylinders, and cylinders with random orientations were explored. In brain parenchyma, blood vessels form an interconnecting network of long cylinders (compared to their radius) with random orientations. Therefore, of particular interest is the randomly oriented cylinder model, in which the intravascular signal contribution is not included by assuming a small blood volume fraction and only signal changes from the extravascular compartment are considered. The measured MR signal can be characterized as: (the effects of spin-spin relaxation rate T2 are ignored in the following equations).
where ρ is the spin density; λ is the volume fraction containing deoxyhemoglobin, which is cerebral venous blood volume (vCBV); and can be described as
where J0(x) is the zeroth order Bessel function; and δω is the characteristic frequency shift. If one assumes that the arterial blood is fully oxygenated then λ represents the venous blood volume and δω is defined as
where Hct is the fractional hematocrit; B0 is the main magnetic field strength; Δχ0 is the susceptibility difference between fully oxygenated and fully deoxygenated blood which has been measured to be 0.18 ppm per unit Hct in cgs units [69]; and Y is the oxygen extraction fraction. Two asymptotic forms, namely short time scale ( ) and long time scale () are given to approximate the signal equation as:
and
where the subscript s and l respectively denote the short and long time scales; tc is the critical time defined as . The commonly used transverse relaxation rate R2* in gradient echo images can be approximated as R2*=R2+ R2', with R2 and R2' represent irreversible and reversible signal decay rate, respectively. The reversible signal decay rate of local susceptibilities (R2') can be written as
R2' can be estimated by fitting a linear curve of the logarithm of Sl(t) with t > 1.5/δω. λ can be calculated as , where can be obtained through an extrapolation of Eq. (11) following the estimation of R2'. After both R2' and λ are estimated, measurement of Y can be obtained from Eq. 9.
Similar to the computer simulation results shown by Majumdar in 1991 [71], this analytical signal model [72] shows that the MR signal is a Gaussian function at short echo time and it becomes monoexponential at longer echo time. This signal model established a direct relationship between the susceptibility variations and the MRI measured signal. The close form analytical signal description, which might be approximated by two asymptotic equations, could be utilized to estimate the volume fraction of the susceptibility sources as well as the absolute susceptibility. Using this signal model, Yablonskiy measured volume fraction of susceptibility sources in phantom [77]. Building upon the Yablonskiy and Haacke’s work, Kiselev and Posse [76] developed a more complete analytical signal model by taking into account the signal from the intravascular compartment as well as the effects of slow diffusion. Within a slow diffusion regime, this Kiselev and Posse model agree with a Monte Carlo simulation [74] and previous models [72, 73] concerning diffusion effects. However, it lacks a close form solution that allows for a direct experimental measurement. More recently, based on the previous analytical model as in [72], He and Yablonskiy developed a quantitative BOLD signal model (qBOLD) by including multi-compartmental structures of brain tissue and considering different T2 decay rates in gray and white matters [26]. Moreover, frequency shift between brain tissue and cerebrospinal/interstitial fluid was also considered.
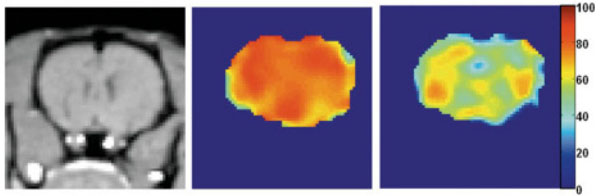
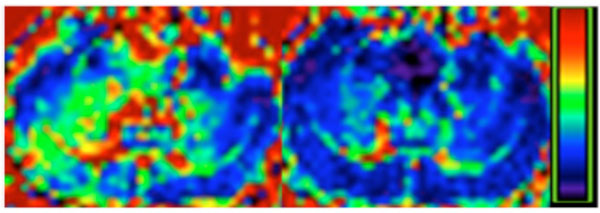
We have utilized the analytical model proposed by Yablonskiy and Haacke to estimate cerebral blood oxygen saturation in normal human subjects under both normal and hypercapnic conditions, induced by inhalation of room air or carbogen (3% CO2 mixed with 97% O2), respectively. In consistent with physiological expectation, an increase of vCBV (corresponds to λ in Eq. 7) and a decrease of both R2′ and OEF are obtained under the hypercapnic condition (Fig. 3, lower row) when compared to that under the normocapnic condition (Fig 3, upper row). Across all subjects, OEF decreased from 0.39±0.04 to 0.28±0.02, while vCBV increased from 3.76%±0.78% to 4.4%±0.67% from normocapnic to hypercapnic conditions, in agreement with the previously reported PET results [78-80]. Moreover, a direct comparison between measurements obtained using the MR based methods and the gold standard, blood gas analysis was performed to validate the MR approach in rats over a wide range of physiological relevant blood oxygen saturation [81]. Moderate hypoxia, severe hypoxia, hypercapnia, and normal control states were induced by giving rats two levels of nitrogen/air mixture, carbogen and air to alter brain oxygen saturation fraction from 0.1-0.8 (the full possible range of tissue oxygen saturation is 0-1). As shown in Fig. (4), MR measured oxygen saturation O2SatMR maps showed moderate and severe reduction in cerebral oxygen saturation during moderate hypoxia (1:2 mixture of nitrogen and air), severe hypoxia (1:2 mixture of nitrogen and air) and an increase of cerebral oxygen saturation during hypercapnia (3% CO2, 97% O2). Fig. (5) demonstrated that the MR measured cerebral oxygen saturation is in excellent agreement with the gold standard blood gas analysis for a wide range of cerebral oxygenation. Furthermore, utility of this MR based methods have been explored in both human stroke and ischemic rat model [81, 82]. In addition, He and Yablonskiy have utilized the qBOLD model to estimate cerebral oxygen saturation in human and further validated this method by comparing MR measurements with venous blood gas oximetry in rats that under different anesthetic conditions [83]. As shown in Fig. (6), a high level of oxygen saturation was obtained in rats under isoflurane anesthesia (77%) than that under alpha-chloralose anesthesia (67%).
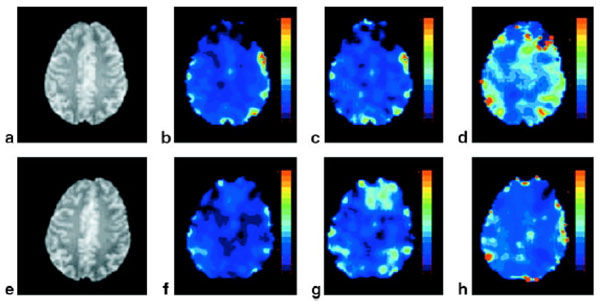
Representative spin echo anatomic image (a,e) R2΄ (b,f), vCBV (c,g), and OEF (d,h) maps under normocapnia (upper row) and hypercapnia (lower row), respectively. The color bars represent the absolute estimates of R2΄ (0-14 Hz), vCBV (0-14 %), and OEF (0-100%) (From An and Lin, Magn Reson Med 2003, 50:708–716, with permission).
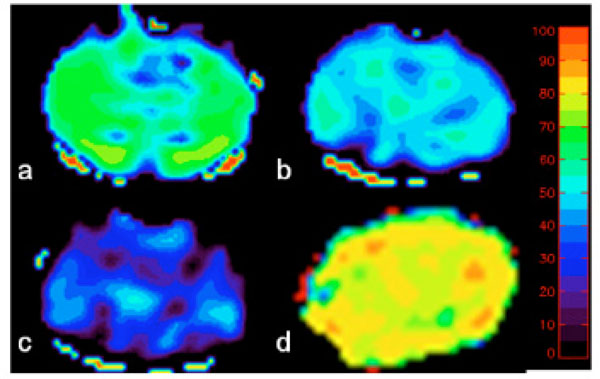
MR measured oxygen saturation O2SatMR maps under control condition (a), moderate hypoxia (b), severe hypoxia (c) and hypercapnia (d). The color bar represents the scale for blood oxygenation (0 to 100%) (adapted from An et al. Stroke 2009, 40(6):2165-72, with permission).
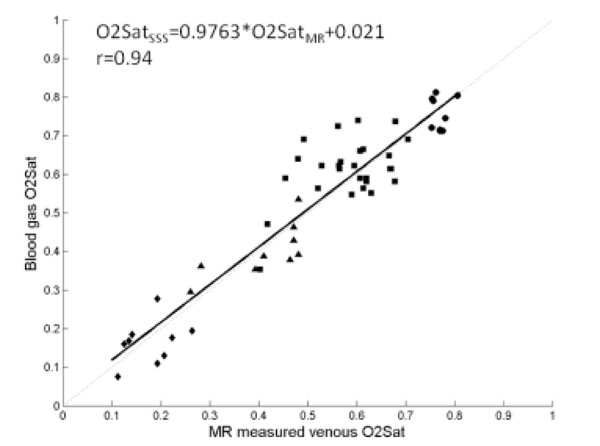
(a) Correlation between the MR measured O2SatMRv vs. the blood gas O2Satsss in superior saggital sinus (closed symbols) during normal control (squares), hyperoxic hypercapnia (circles), moderate hypoxia (triangles) and severe hypoxia (diamonds). Linear regression O2SatMRv vs O2SatSSS (O2SatSSS = 0.9763 · O2SatMRν + 0.021, r=0.94, solid line) were plotted together with a line of identity (dotted line). (adapted from An et al. Stroke 2009, 40(6):2165-72, with permission).
Venous blood oxygen saturation maps obtained with the qBOLD technique from the rat under isoflurane (middle) and alphachloralose (right) anesthesia. The color bar shows the blood oxygenation level in %. The left image is the T1-weighted anatomic image. Mean values of venous blood oxygen saturation were 77% under isoflurane anesthesia and 62% under alpha-chloralose anesthesia (From He et al, Magn Reson Med. 2008 October ; 60(4): 882–888, with permission).
Unlike R2 based methods, R2′ can be directly linked to brain oxygenation without a need of ex vivo signal calibration. In addition, R2′ based methods are more sensitive to the signal alteration induced by paramagnetic deoxyhemoglobin, which makes the quantification of oxygenation within tissue possible. However, R2′ based methods are more subjective to background field inhomogeneity arising from air tissue interfaces, such as in the frontal orbital or lateral temporal areas. We have shown that R2′ and λ will be overestimated if Eq. 7-9 are utilized [84]. In general, background field inhomogeneity is macroscopic in scale (on the order of a few mm or cm) and has a either linear or low-order spatial dependence [85]. In contrast, the scale of magnetic field variation induced by physiological parameters, such as deoxyhemoglobin, is on the order of a few microns and usually smaller than the voxel size and varies randomly [77]. Several methods have been proposed in an attempt to recover the signal loss induced by the macroscopic background field inhomogeneity or to separate the effects of these two field variations. These approaches are to (1) increase spatial resolution [47, 86]; (2) use a tailored RF pulse to compensate for the signal loss [87]; (3) apply z-shimming gradients to recover signal loss [85, 88-91]; (4) employ an image post-processing method to separate the effects of physiological related susceptibility effects from macroscopic background field [77, 92]; and (5) acquire a background field map to correct for its effect [79]. The dimension along z direction is usually larger than the other two directions (x and y) in 2D MRI images, resulting in a larger degree of intravoxel phase dispersion along this direction. The z-shimming method proposed by Yang et al [85] utilized an additional gradient table along z direction to compensate background field variations. Usually, the maximal z-shimming gradient is determined using the magnitude of background field inhomogenieties and TE. If the z shimming gradient table is chosen correctly, one of the z-shimming gradients will move the k space data back to Kz=0. After a FFT along the z direction, the signal loss can be compensated. Fig. (7) demonstrates that z shimming method can effectively reduce background susceptibility artifacts, resulting in a reduced R2* after z shimming correction. To recover signal loss induced by a range of background susceptibility, multiple steps of z-shimming gradient is needed. For example, if an eight step z-shimming table is utilized, an eight times longer data acquisition time is needed without gaining any SNR. Therefore, though z-shimming method is effective in reducing background susceptibility artifacts, it is not time efficient. On the other hand, background magnetic field map can be obtained through a high resolution gradient echo sequence as shown in Fig. (8) (left) [79]. This field map can then be utilized to correct for the overestimated vCBV (Fig. 8). This method assumes that the background field inhomogeneity is linear. If the magnetic field inhomogeneity is large, this method cannot recover the signal loss accurately.
R2* maps before (left) and after (right) z shimming. Colorbar represents R2* range 0-50 Hz.
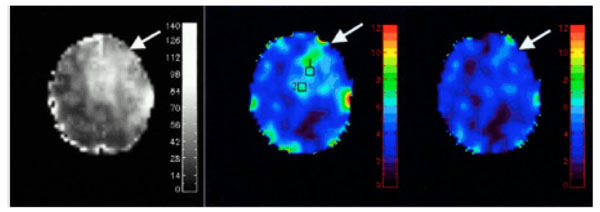
Background magnetic field (ΔB, left) was obtained using a high resolution 3D FLASH sequence. This background magnetic field was then utilized to correct signal loss. Before correction, vCBV was high in regions with large ΔB (middle) and it decreased after the correction (right). (Adapted from An and Lin, Magn Reson Med 2002, 47:958–966, with permission)
Several assumptions are made for the analytical signal models discussed above [72]. First, numerous blood vessels with random orientation are assumed so that a statistical approach can be utilized to derive the signal equation. This assumption holds true for brain regions consisting of small vessels, but no longer valid for voxels containing a dominant large vessel, such as a pial or a draining vein. Second, only extravascular signal alterations induced by deoxyhemoglobin is considered. Since normal cerebral blood volume ranges between 2-5% in the brain parenchyma [57-62], signal contributions originating from the intravascular space, which is weighted by CBV, are likely to be small. This assumption may not be valid under certain pathophysiological conditions, such as high grade tumors [93] that usually has high rCBV. Appropriate modifications to include intravascular signal contributions will be necessary in this case. Pulse sequences that can minimize the intravascular signal contributions by dephasing flow spin of blood [80] may alleviate this problem. Finally, only static dephasing mechanism is considered in the signal model, while signal reduction caused by incoherent phase shift from diffusion is ignored. It has been suggested that the diffusion effects depend on pulse sequences, TE, and vessel size [74]. Similar to the approach in [74], we performed a Monte Carlo (MC) simulation to evaluate to what extent that diffusion may impact signal and its dependence on vessel size. In this MC simulation, vessels were generated by uniformly sampling a sphere for random vessel orientations, the number of vessels were determined to occupy 2% of total voxel volume. Brownian motion was used to simulate diffusion effects. In total, 1 million spins were simulated. As shown in Fig. (9), our MC simulation clearly demonstrates that diffusion effects causes signal deviation from static dephasing regime for vessels with a diameter of 7 µm, but not for vessels with a diameter of 25 µm. Usually, short echo time and a high magnetic field favor static dephasing assumption [73].
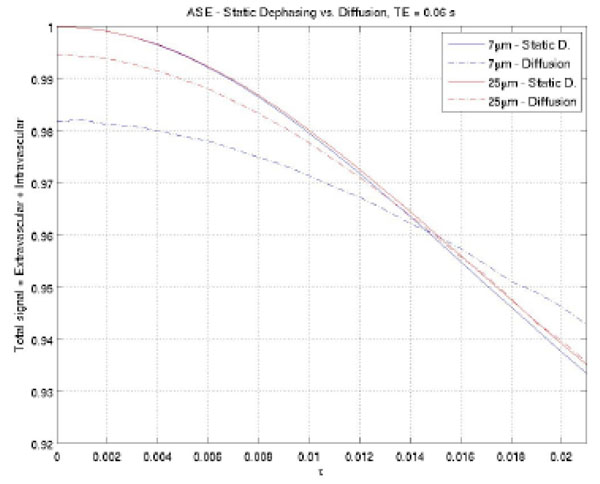
Monte Carlon simulation to demonstrate that diffusion effects depend on vessel size. A large deviation was observed between diffusion and static dephasing regime signal for vessels with a diameter of 7 µm, while negligible signal difference was detected for vessels with a diameter of 25 µm.
Once tissue oxygen saturation is obtained, OEF can be computed as OEF=O2Sata-O2Satv, where O2Sata is the oxygen saturation in artery which is usually close to 100%. Together with the CBF obtained by using either dynamic susceptibility contrast (DSC) or arterial spin labeling methods [94-97], an oxygen metabolic index can be computed as a product of OEF and CBF [98].
PHASE SHIFT BASED METHODS
As described in Eqs. (5) and (6), deoxyhemoglobin induces frequency alterations both inside and outside venous blood vessels. This frequency shift can generate time-dependent phase shift between the venous blood vessel and the brain tissue. The measured phase difference Δφ between blood in a vein and the surrounding tissue can be related to Δχ as
Therefore, a direct relationship between blood oxygen saturation and the phase difference between venous blood and surround tissue can be utilized to estimate venous oxygen saturation. In Eq. (13), the only two unknown parameters are venous oxygen saturation Y and the vessel angle θ. Once θ is known, Y can then be calculated. Haacke et al. used velocity compensated high resolution gradient echo imaging to measure venous oxygen saturation during resting and functionally activated states in pial veins [99] (Fig. 10). Fernandez-Seara et al. used a similar principle to estimate venous oxygenation in jugular veins during normal, breath-holding and hypoventilation conditions [92] assuming the jugular veins are parallel to main magnetic field B0 (Fig. 11). More recently, Jain et al. integrated this approach and a phase contrast MRI to measure both venous blood oxygen saturation in superior sinus and blood inflow rate in major feeding arteries, such as internal carotid artery and vertebral arteries for a calculation of global CMRO2 [100]. These phase based methods do not need an ex vivo calibration and have a simple linear relationship between venous oxygenation and phase, but velocity compensation is required to compensate the phase change caused by blood flow [67] Fernandez-Seara et al. have demonstrated that 10° tilt from a presumed orientation of a vein may result in a 5% error in their estimation of Y, and this error increased dramatically beyond this offset, which is clearly demonstrated in Eq. (13) in the
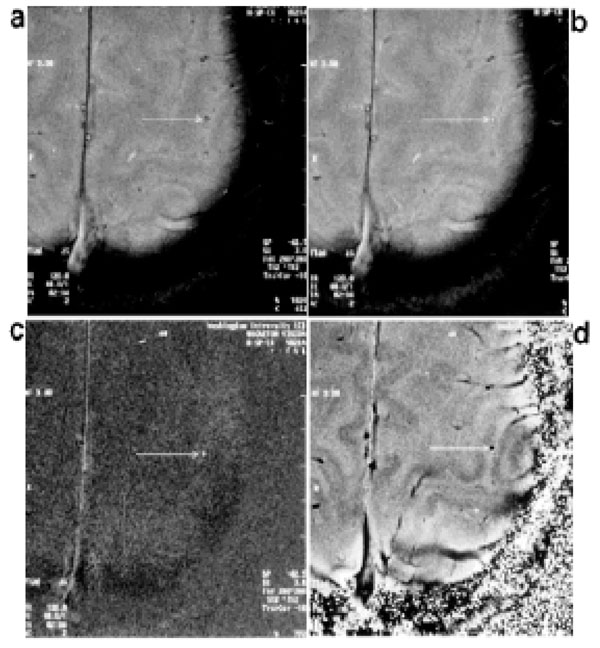
Examples of high-resolution 2D gradient echo images obtained during a motor cortex activation study (finger-tapping). Magnitude images obtained in the resting state (a) and activated state (b). The pial vein shows signal enhancement upon activation. (c) Difference image obtained by subtracting the resting state magnitude image from the magnitude image in the activation state. d: Phase image in the resting state. (From Haacke et al, Human Brain Mapping 1997, 5:341–346, with permission).
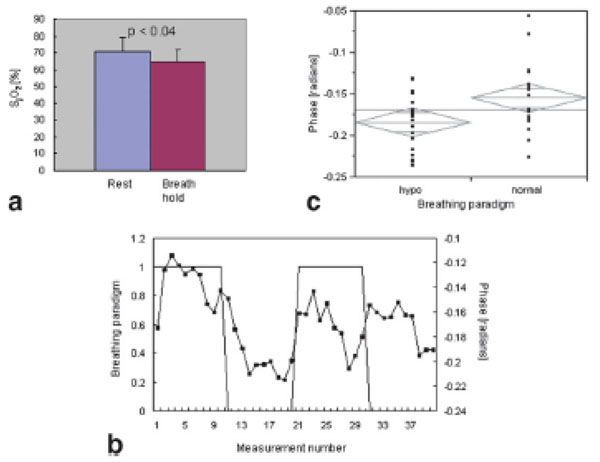
a Bar graph of jugular vein oxygen saturation measurements at rest and during breathholding. Oxygen saturation is significantly reduced during breath-holding (P <0.04, one-sided pairedsample t-test). b: Scatter plot of phase measurements comparing normal breathing and hypoventilation. The measured phase is significantly lower (P < 0.018) during hypoventilation, suggesting a reduction in oxygen saturation during this period. c: Time series of phase measurements (■) during alternate periods of normal breathing (1) and hypoventilation (o). (From Ferna´ndez-Seara et al, Magn Reson Med, 2006, 55:967–973, with permission).
In a typical MR imaging scan, most of the venous blood vessels in brains are smaller than an imaging voxel, and voxels partially occupied by venous blood vessels exist commonly. In this case, the overall signal in these voxels can be described as follows:
where ρ is the effective spin density, λ is the volume fraction occupied by venous blood, and Sb and Sv are the signal from brain tissue and venous blood, respectively. In a simplified case, where the blood vessel is parallel to the main magnetic field, the frequency shift outside the vessels is zero as shown in Eq (5). For MR signal acquired using a gradient echo sequence, Eq (14) can be further written as
where fb and fv are functions of T1 and other imaging parameters for brain tissue and venous blood, respectively. They can be described as:
where T1b and T1v are the T1 values in brain tissue and venous blood vessels and a is the flip angle in the 3D FLASH sequence. In addition, is the phase difference between venous blood and brain tissue, as described in Eq. (13). In the presence of exogenous susceptibility sources, such as paramagnetic contrast agent, Eq. (13) should be rewritten as
where Δχc is the susceptibility difference between a paramagnetic contrast agent and brain tissue.
Summarizing Eqs. (13-18), an oscillatory signal can be observed since the phase difference between brain tissue and venous blood vessel evolves as a function of time. The local minimum occur when the phase difference between the brain tissue and the venous blood is at , where n is an odd integer. The oscillatory period depends on blood oxygen saturation while the extent of signal cancellation is determined by the venous volume fraction. If we assume that T2* decay and fb and fv are similar between the blood and the brain tissue, their effects can be removed from Eq (15), a pictorial representation of signal oscillation is shown in Fig. (12). This phenomena is very similar to the signal oscillation observed in the water and fat signal [101]. The oscillation period is solely determined by venous blood oxygenation, while the extent to which how much signal cancellation may occur (maximal signal cancellation) solely depends on the relatively blood volume fraction (rCBV) in a voxel. An rCBV of 50% results in a complete signal cancellation. This signal oscillation due to relative phase difference between venous blood and brain tissue offers a unique window to measure both venous oxygenation and blood volume fraction of a large vein simultaneously.
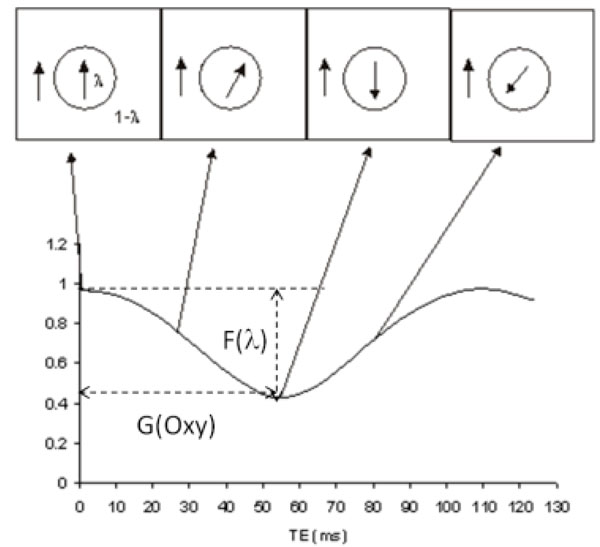
Signal oscillation as a function of TE in an imaging voxel partially occupied by a vein and brain tissue. The volume fractions of the vein and brain tissue are λ and 1-λ, respectively. The arrows mark the corresponding phase evolution vs. TE. The extent to which signal may reduce (F(λ)) only depends on λ, while the period of the signal oscillation (G(oxy)) only depends on oxygen saturation.
Based on this principle, we employed a multi-echo 3D FLASH sequence with velocity compensation along all three directions (Readout, Phase Encoding and Slice Select) to estimate susceptibility effects in normal human subjects using a 1.5T MR scanner [102]. Moreover, we used Gd-DTPA, a paramagnetic contrast agent, to alter the susceptibility effects within the veins to further assess whether the oscillation signal reflects the increased susceptibility effects. In addition to the in vivo experiments, theoretical prediction was performed based on Eqs. (13) – (18) for both pre and post contrast agent studies. The input parameters for the pre contrast agent study were: Hct=0.42, OEF=0.45, λ=0.30 and θ=0, T1b=1.2 sec, and T1v=0.95 sec. A dosage of 0.2 mmol/kg, which is translated as a 2mM blood concentration, was employed for the in vivo study. Based on a previous report [103], the susceptibility was calculated as 1.03×10⁻⁸ /mM, and T1v was reduced from 1.2 sec pre-contrast to 0.15 sec post contrast. Representative signal oscillations are shown for pre (Fig. 13a) and post contrast (Fig. 13b), respectively. In addition, theoretically calculated signal (filled diamonds) is also shown for both pre (Fig. 13a) and post contrast (Fig. 13b), respectively. The first local signal minimum, corresponding to the maximal signal cancellation, occurs roughly at TE=52.08 msec and TE=31.6 msec for the pre and post contrast studies, respectively. Moreover, the theoretic prediction showed the first signal minimum might be TE=55 msec and TE=34 msec, respectively, for the pre- and post-contrast studies (Y=0.55 and Hct=0.42), which is in excellent agreement with the in vivo experimental data. It suggested that the oxygen saturation in the three representative venous blood vessels are roughly 0.55. This result was consistent with a previous study [99]. In addition, the relative signal reduction at the first local minimum reveals that the volume fractions of vessel 1 and 2 were < 30%, while vessel 3 was >30%. For the post contrast study, since the contrast agent shortened the T1 of blood, the term fv in Eq. (17) became larger post contrast when compared to that of pre-contrast. Equivalently, the effective blood volume fraction becomes larger in this voxel. It explains in part the observed shorter oscillatory period and lower signal minimum in the oscillatory curve. However, discrepancies were observed between the experiments and the theoretically predicted signal at long TE, which is likely caused by the reduced SNR at long TE. The partial volume effects of the phase shift induced by a large vessel can also be employed in fMRI study to evaluate the change in venous oxygen saturation as well as the change of blood volume fraction in a large vein. Barth et al have demonstrated that the oscillatory period was lengthened during functional activated period of time, suggesting an increase in blood oxygen saturation during fMRI (Fig 14) [104].
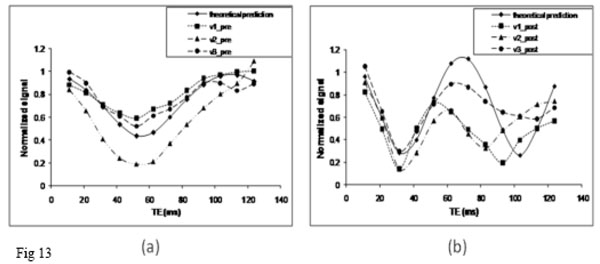
Signal from a voxel containing both a single large vein and brain tissue is plotted as a function of TE for the pre (a) and post (b) contrast agent studies. Three representative veins were plotted (v1, v2 and v3). In addition, the theoretical prediction curve (solid line) was also plotted.
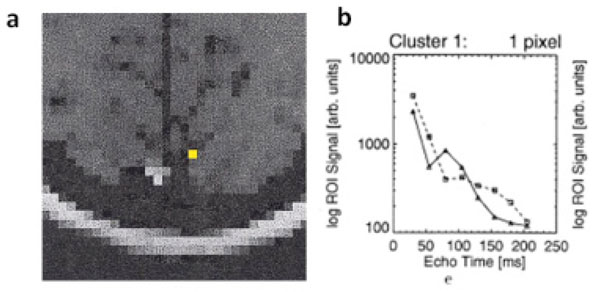
(a) A anatomic image to demonstrate the voxels with functional activation. (b) Logarithmic signal decay plotted versus echo time. Straight lines (triangles) correspond to resting state signal, dashed lines (squares) correspond to signal during stimulation. The lengthened oscillatory period during functional activation, suggesting an increase in blood oxygen saturation during fMRI. (Adapted from Barth et al, Magnetic Resonance Imaging, 1999, 17, No. 3, 321–329, with permission).
Similar to all the aforementioned technique, this method can only provide venous blood oxygen saturation in sizable veins. Moreover, the required velocity compensation gradients have led to relatively long ΔTE between two adjacent echoes, which may limit the accuracy in determining the oscillation period. However, there are several advantages associated with the proposed method. First, with few assumptions, this method can provide independent estimates of blood oxygen saturation (determined by the oscillation period) and blood volume fraction of a large vein (determined from single oscillation depth) simultaneously. Second, since high resolution FLASH sequence was employed, the phase shift induced by macroscopic field variations is very similar between venous blood vessels and their surrounding brain tissue. Therefore, unlike most of the R2*/R2′ based methods, this approach is insensitive to the effect of background field inhomogeneity. Regarding the measurements of venous blood volume of a given large vein in one voxel, the largest blood volume fraction can be measured without ambiguity will be λ=50% because the magnitude signal will be identical for λ and λ =1- λ. This ambiguity can be overcome using additional information from phase images since the phases of these two cases are different. Currently, more high field magnets (3T and above) are available in both clinical and research environment, this method can benefit from large susceptibility effects at a relative short TE and improved SNR from high field magnets.
SUMMARY
Cerebral oxygen metabolism plays a critical role in normal brain function. It is the primary energy source to sustain neuronal activities. Since the energy reserve of brain is very limited, perturbation of cerebral oxygen metabolism for a short period of time may cause a severe damage leading to tissue death, such as that in ischemic stroke [3, 4]. The ability to quantitatively measure tissue oxygenation and oxygen metabolism is essential to the understanding of pathophysiology and treatment of various diseases. Thus far, several BOLD based MR imaging techniques have demonstrated promising results on the absolute measurements of cerebral oxygenation. Translating these techniques as routine clinical diagnostic tools still need more efforts due to intrinsic small signal induced by deoxyhemoglobin and some confounding factors. Moreover, rigorous validations under a wide range of physiological and pathological conditions are still needed. We hope that this review, which may not be exhaustive due to our limited experience in this rapidly growing field, can provide readers background knowledge to choose a method suitable for their applications and prompting future developments of innovative in vivo quantitative MR techniques for measuring absolute brain oxygenation.
ACKNOWLEDGEMENTS
This study was supported by grants from National Institute of Health (NIH 5R01NS054079) and American Heart Association (AHA 0730321N).

