All published articles of this journal are available on ScienceDirect.

Quantitative MRI of Cerebral Arterial Blood Volume
Abstract
Baseline cerebral arterial blood volume (CBVa) and its change are important for potential diagnosis of vascular dysfunctions, the determination of functional reactivity, and the interpretation of BOLD fMRI. To quantitative measure baseline CBVa non-invasively, we developed arterial spin labeling methods with magnetization transfer (MT) or bipolar gradients by utilizing differential MT or diffusion properties of tissue vs. arteries. Cortical CBVa of isoflurane-anesthetized rats was 0.6 – 1.4 ml/100 g. During 15-s forepaw stimulation, CBVa change was dominant, while venous blood volume change was minimal. This indicates that the venous CBV increase may be ignored for BOLD quantification for a stimulation duration of less than 15 s. By incorporating BOLD fMRI with varied MT effects in a cat visual cortical layer model, the highest ΔCBVa was observed at layer 4, while the highest BOLD signal was detected at the surface of the cortex, indicating that CBVa change is highly specific to neural activity. The CBVa MRI techniques provide quantified maps, thus, may be valuable tools for routine determination of vessel viability and function, as well as the identification of vascular dysfunction.
INTRODUCTION
The adult human brain represents ~2% of body weight, but receives ~15% of total cardiac output. Cerebral blood flow (CBF) is closely related to cerebral blood volume (CBV), which can be divided into arterial and venous blood volume. Arterial vessels including arteries, arterioles and pre-capillary small arterioles dilate and constrict actively responding to internal and external perturbations, while venous vessels including veins, venules and post-capillary small venules respond passively. Vascular volume changes in the brain are important for regulation of blood flow under conditions of both normal and abnormal physiology. It is generally thought that dilation and constriction of arterial blood vessels is the major mechanism that maintains CBF within an autoregulatory range [1], and that adjusts blood flow to perturbations such as those induced by CO2 changes and neural stimulation. Thus, arterial CBV change is expected to be more sensitive than total CBV change in assessing cerebrovascular regulation, as well as in identifying regions of abnormality. For example, in ischemic regions, arterial blood vessels dilate to compensate for reduced blood pressure, making quantitative mapping of CBVa a promising diagnostic tool. However, CBVa has rarely been investigated, possibly due to difficulties involved in compartment-specific blood volume measurements and the lack of gold-standard methods for comparison.
Arterial CBV can be mapped with arterial spin labeling (ASL). ASL is achieved with endogenous magnetic labeling by either virtually continuous (i.e., long duration) application of radiofrequency (RF) labeling between acquisitions (referred to as “continuous ASL”) [2, 3] or by short RF pulse(s) (referred to as “pulsed ASL”) [4-6]. Labeled spins will reside mostly in arterial vessels and tissue due to short half-life (spin-lattice relaxation-time) of labeled spins. For the quantification of CBF, it has been of great interest to remove the contribution of arterial blood signals, which can be achieved by using a post-labeling delay time [7] or by employing small bipolar gradients [8] (referred also to as diffusion gradients), which dephase rapidly moving spins [9]. Conversely, these arterial contributions can be exploited to quantitatively map CBVa. In studies without the removal of arterial signals, the ASL signal is a sum of arterial blood and tissue signals, which can be deconvoluted with dynamic ASL models [10, 11]. Thus, CBVa may be determined from ASL data obtained at multiple spin labeling times. Alternatively, arterial and tissue ASL signals obtained at a single spin labeling time can be separated with diffusion gradients [12] or the magnetization transfer (MT) effect [13], rendering simultaneous measurement of CBVa and CBF.
Since significant increase in CBF during stimulation is highly associated with arterial dilation, functional change in CBVa is expected, However, CBVv comprises ~60-80% of total CBV under normal baseline conditions [14-17], thus vascular responses assume the dominance of CBVv changes during stimulation - with minimalCBVa changes in biomechanical models of functional MRI (fMRI) (such as the balloon model) [18, 19]. According to vascular physiology studies, however, local and upstream arterial vessels rigorously dilate during increased neural activity [20]. Thus, it would be valuable to know the portion of CBVa change that contributes to overall stimulus-induced CBVt change to gain insight into neurovascular control mechanisms. Therefore the measurement of CBVa vs. CBVv change is helpful to understand BOLD signals and could quantify the vascular responses of neural activity. Thus, we measured total and arterial CBV using contrast agent and ASL with MT effect, respectively, and compared CBVa vs. CBVv (= CBVt – CBVa) changes during stimulation. Since the most widely-used BOLD signal is closely dependent on CBF and venous (not total) CBV [21], the relationship between CBVa and CBVv changes makes a major impact to BOLD quantification. In order to further obtain functional CBVa response with high temporal resolution, a new MT-varied blood oxygenation-level dependent (BOLD) fMRI technique was developed to determine both ΔCBVa and BOLD fMRI responses [22]. From fMRI data acquired at multiple MT levels, MT-independent arterial signal can be separated from MT-dependent tissue (and venous) signals.
In this review article, we present the theoretical basis of quantitative CBVa measurement with MT-varied ASL and MT-varied BOLD fMRI techniques, and summarize our lab’s findings of CBVa measurements obtained from isoflurane-anesthetized rats and cats at 9.4 T. Arterial vs. venous CBV changes during stimulation were measured to determine relative contribution of CBVa to CBVt change. Then, the implication of our finding for BOLD quantification was discussed. To further examine the importance of functional CBVa mapping, the spatial specificity of CBVa change was also examined.
THEORETICAL BASIS OF ARTERIAL CBV MEASUREMENTS
It is assumed that MRI signals in a given pixel originate from four compartments including extravascular tissue, arterial blood, capillary, and venous blood. Under the assumption that water in capillary blood freely exchanges with tissue water, the spin status in venous blood could be similar to those in tissue generated by upstream free exchange, therefore components from tissue, capillaries and venous vessels will be indistinguishable, thus these are treated together as one compartment. Arterial spin fraction νa can be determined by separating arterial blood from tissue signals (see below), then converted into physical volume CBVa, considering differences in spin density between tissue and blood pools; CBVa values (units of ml blood/g tissue) can be obtained from νa by multiplying a tissue-to-blood partition coefficient. It is noted that the tissue-to-blood partition coefficient of 0.9 ml/g for the entire brain [23] was used in our studies. Thus, the CBVa value in gray matter is slightly underestimated [23]. The CBVa value measured by MRI represents the blood volume within arterial vessels of all sizes, and includes the portion of capillaries carrying blood water before it exchanges with tissue water; the diameter of arterial vessels in the parenchyma ranges from 30-40 μm in intracortical arterioles to 4-6 μm in capillaries [24].
Quantitative CBVa Measurements: ASL with MT or Bipolar Gradients
Spin-labeled (e.g., inversion) arterial blood water travels into the capillaries and exchanges with tissue water. Even if capillary water does not completely exchange with tissue water (which is likely the case), any magnetic label remaining in the capillaries and venous vessels is reduced by T1 and T2 relaxation. Since the longitudinal component of magnetization decays as exp(-t/T1 of blood), where t is the transit time of spins from the labeling plane, and T1 of blood is 1.2 – 2.2 s (dependent on magnetic field), the signal contribution from venous blood will be small. Any remaining venous blood signals can be further reduced by T2 decay, since T2 of venous blood is short relative to T2 of arterial blood and tissue. Therefore, spin-labeled signal in the venous pool can be made negligible (see discussion in [22]). Arterial blood signal contributions in the imaging voxel depend on spin labeling duration and blood transit time. If spin labeling duration is longer than the blood transit time from the labeling plane to arteries at the imaging slice (τa) but shorter than the transit time to capillaries (τc), then arterial blood signal dominates (Fig. 1). In humans, τa and τc in gray matter is ~0.9 s [25] and ~1.4-1.9 s [25, 26], respectively. Based on the central volume principle, arterial CBV can be determined from CBF and transit time of (τc - τa) [26]. τa and τc can be measured without and with magnetic field gradients, respectively, since the ASL signal originating from arterial blood can be suppressed by employing small bipolar gradients. Although this bipolar gradient approach with multiple spin labeling times has been successfully implemented in humans [26], determining τa and τc accurately is not trivial. Thus, we propose a simple method to use one spin labeling time longer than τc with and without the suppression of arterial blood signals [12]. When diffusion-weighted gradients are applied, ASL signal (ΔS), as a function of the diffusion-weighted gradient factor b, at echo time TE, is described as
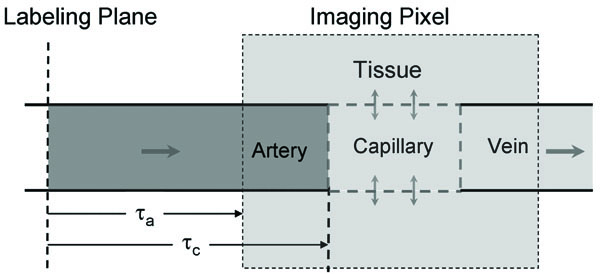
Schematic model of ASL. Labeled arterial blood water travels into the capillaries where it exchanges with extravascular tissue water. If this exchange is unrestricted, then the concentration of labeled water in capillaries, extravascular tissue, and venous blood is identical (ignoring T1 decay), leaving signal origins from only two compartments - arterial blood (dark gray) and capillaries + extravascular tissue + venous blood (light gray). Measurement of CBVa then involves the separation of these two compartments. Spin transit time from the labeling plane to artery and capillary within a pixel is τa and τc, respectively.
where νa is the fraction of spins in the arterial blood pool (units of %); and are changes in magnetization induced by ASL in tissue and in arterial blood, respectively; D is the water diffusion coefficient in the tissue pool, and D* is the pseudo-diffusion coefficient, where it is assumed that D* arises from arterial spins only [12]. With rectangular-shaped gradient pulses, b (in units of s/mm2) can be expressed as , where γ is the gyromagnetic ratio of proton nuclei, δ is the duration of each gradient, G is the diffusion-weighted gradient strength and Δ is the time between gradient onsets [9]. When bipolar gradients of b >70 s/mm2 are applied, then only tissue signal remains [12], while both arterial and tissue signals exist when no bipolar gradient is used. The difference between ASL signals with and without bipolar gradients is related to arterial blood volume. The fraction of arterial spins is
where S(0) and S(b) is the signal intensity of unlabeled images without and with bipolar gradients, respectively; α is the spin-labeling efficiency; , where R2,tissue and R2,artery are the 1/T2 values of tissue and arterial blood water, respectively. If T2 values of blood and tissue are similar (such as at 9.4 T [27]) or TE is short, then ξ ≈ 1.0.
Alternatively, arterial blood from tissue in ASL signal can be separated with independent modulation of tissue and vessel signals (MOTIVE) with different MT effects in tissue and blood [13]. When protons in tissue macromolecules are saturated by long off-resonance RF pulse(s), their magnetization is transferred to tissue water protons [28, 29], thereby selectively reducing the ASL signal originating from tissue water. However, the signal from the arterial blood pool is minimally affected due to its small macromolecular content and the inflow of fresh spins from outside the RF coil’s sensitive region [28, 29]. Thus, arterial blood and tissue signals can be differentiated with MT effects. The MR signal intensity from tissue decreases with an increase in MT level; but the MT effect on arterial blood signal is insignificant. Schematic diagram is shown in Fig. (2). The normalized ASL signal (the difference between the “unlabeled” signal and “labeled” signal), ΔSMT/So can be written as
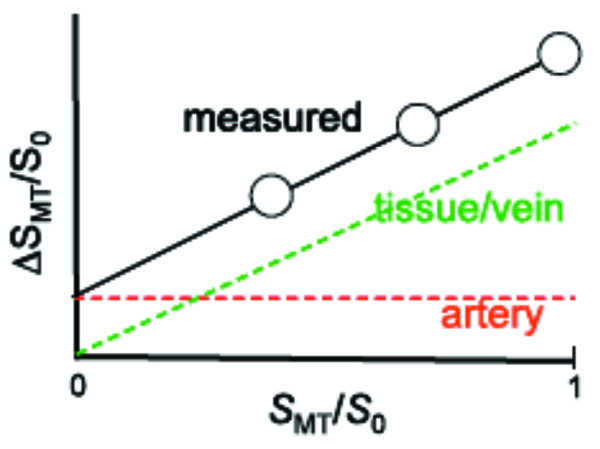
Schematic diagram for separating arterial blood components from ASL or BOLD responses with MT effects [30]. The x-axis is the baseline signal intensity with MT effects (SMT) normalized by the baseline signal intensity without MT (S0), where SMT/S0 is equivalent to 1-MTR (MT ratio). The y-axis is the ASL signal or functional BOLD signal change (ΔSMT) normalized by S0. Since signals from both tissue and veins are MT-sensitive and would be totally eliminated with sufficient power, both their baseline and responding signals decrease with increasing MT effects (decreasing SMT/S0), with an extrapolated intercept of zero. However, arterial blood is insensitive to MT effects due to the inflow of fresh blood; thus arterial signal is constant, irrespective to tissue MT effects. Fitting ΔSMT/S0 as a function of SMT/S0 therefore yields the MT-independent arterial signal contribution intercept. For ASL with MT effect, absolute baseline arterial CBV can be obtained, while arterial CBV change can be determined from BOLD with MT.
Where SMT and S0 is the signal intensity with and without MT effect, respectively; C is a constant related to tissue perfusion, which is where f is cerebral blood flow (ml/100 g tissue/min), and T1 is T1 of tissue without MT effects. By fitting a linear function to ΔSMT/S0 vs. SMT/S0, the intercept represents MT-insensitive arterial blood signals. In our case, we assumed ξ ≈ 1.0. If the arterial oxygen saturation level is much less than 1.0, CBVa is under-estimated by 1/ξ.
The example of isoflurane-anesthetized rat brain for CBVa measurement is shown in Fig. (3). The normalized ASL signals were calculated at each MT level (e.g., Figs. 3A and 3B), then were fitted against normalized unlabeled images at corresponding MT level (not shown here). CBVa maps (Fig. 3C) can be easily achievable by calculating with intercepts, slopes, and arterial spin labeling efficiency (see Eq. [3]). Similarly, ASL signals without bipolar gradient (Fig. 3A) were compared with those with bipolar gradients (Fig. 3E). Then, CBVa maps were calculated using Eq. [2] (Fig. 3F).
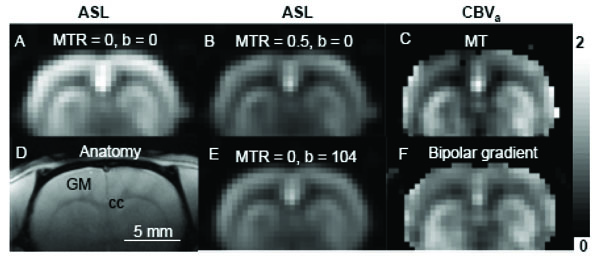
Two ASL approaches to obtain arterial CBV maps. Data were obtained from one isoflurane-anesthetized rat at 9.4 T. ASL signals were obtained with various MT effects (A with MTR = 0 and B with MTR = 0.5), then intercepts of ΔSMT/S0 vs. SMT/S0 were determined on a pixel-by-pixel basis and converted to CBVa (C). Alternatively, ASL data were obtained without (b = 0 s/mm2) and with bipolar gradients (b = 104 s/mm2) (A and E) in absence of MT effects. Then, the CBVa map was calculated (F). Sensitivity in the ventral brain region is poor, due to its distance from the RF detection coil. Scale bar: 5 mm. Arterial CBV gray scale: 0 – 2 ml/100 g. GM: cortical gray matter; cc: corpus callosum (white matter).
Functional CBVa Measurements: MT-Varied BOLD
As mentioned previously, extravascular tissue and intravascular venous blood pools will be considered together as one MT-dependent compartment. In contrast, the arterial blood pool experiences only a minimal MT effect. In order to separate MT-dependent tissue and MT-independent arterial signals to BOLD fMRI, functional experiments can be performed with different MT levels [22]. Schematic diagram is same shown in Fig. (2) except ASL signal (ΔS) is replaced with stimulus-induced signal change (ΔS). The stimulus-induced signal change in the presence of MT (ΔSMT) normalized by S0 is
when is linearly fitted against normalized baseline signal , an intercept is and a slope is [22, 30]. When gradient-echo data collection is used instead of spin echo, R2 terms in Eqs. [1] to [4] should be replaced with R2*. It should be noted that BOLD fMRI with diffusion gradients can separate only extra- vs. intra-vascular (arterial + venous blood) functional signals [31], thus can not be used to measure ΔCBVa if the intravascular venous blood signal contributes to BOLD fMRI.
BASELINE CBVa QUANTIFICATION
In order to determine quantitative CBVa map, continuous ASL techniques with either MT or bipolar gradient approaches were implemented in isoflurane-anesthetized rats at 9.4 T [12, 13]. All coronal images were acquired using a single-shot echo planar imaging (EPI) sequence with spin preparation time = 8 s, spin echo time (TE) = 36 ms, repetition time (TR) = 10 s, slice thickness = 2 mm, and in-plane resolution = 0.47×0.47 mm2. To vary a level of MT effects without changing arterial spin labeling efficiency, we used two actively-detunable surface coils: one in the neck for generating arterial spin labeling in the carotid arteries, and the other in the brain for generating MT effects and collecting images. A pair of pulses, a 100-ms spin labeling pulse in the neck coil followed by a 100-ms MT-inducing pulse in the head coil, was repeated during a spin preparation period (see pulse sequence in [13]). Two CBVa measurement approaches were compared: ASL with MT and bipolar gradients. MT pulses with +8,500 Hz off-resonance frequency were applied during the spin labeling period for achieving MT ratios (MTR = 1 – SMT/S0) of 0 - 0.6 without the use of bipolar gradients [13]. The average CBVa obtained from ASL with MT (without bipolar gradient) (Fig. 4A) was 1.0 ± 0.3, 1.0 ± 0.3 and 1.7 ± 0.6 ml/100 g tissue (n = 10) in the cortex, caudate putamen and a region containing a large artery, respectively [13]. ASL images with bipolar gradients, b = 0 and 104 s/mm2 with each MT level were also obtained for CBVa mapping (Fig. 4B-D). The CBVa values measured by both methods agree well [12]. Cortical CBVa values in anesthetized rats were 0.6 – 1.4 ml/100 g (n = 12).
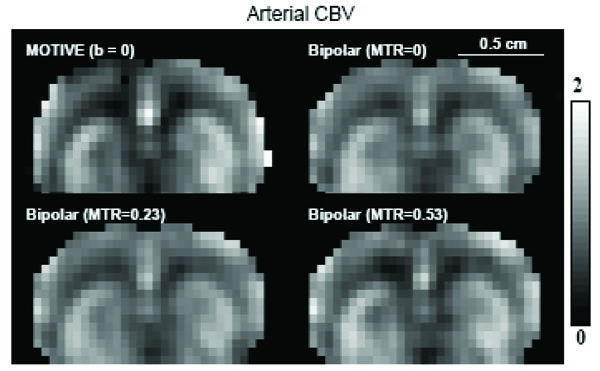
Consistency of CBVa maps obtained from ASL with MT and bipolar gradient [12]. Data were obtained with three MTR levels of 0, 0.23 and 0.53 with and without bipolar gradient from one isoflurane-anesthetized rat at 9.4 T. The CBVa map was calculated from three MTR ASL images without bipolar gradient (A), and from data with and without bipolar gradient at each MTR level (B-D). Clearly, all four CBVa maps are quite similar. Scale bar: 5 mm. Arterial CBV gray scale: 0 – 2 ml/100 g.
Since both the MT and diffusion-weighted methods can determine CBVa from ASL measurements, it is important to critically evaluate properties of both methods (see details in [12]). Although the arterial blood volume fraction is on the order of 1% of total brain volume, quantitative CBVa values were robustly measured because in ASL studies, the ratio of signal originating from arterial blood relative to tissue is much greater than the actual arterial blood volume fraction. In our studies, signals originating from arterial blood are typically 10 - 15% of ASL signal (ΔS0). In humans, the arterial blood signal contribution can be >50% of ΔS0 when the spin labeling time < 2.0 s [8]. If the tissue signal is further suppressed by MT effects, the relative contribution of arterial signals is accentuated. Differences between the diffusion-weighted and MOTIVE approaches with ASL are: i) Only two measurement points (with and without suppression of arterial signals) are obtained in the diffusion-weighted method, while more points at multiple levels of tissue signal intensity can be obtainable with MOTIVE. The large dynamic range afforded by multiple MT saturation levels in the MOTIVE method may potentially yield more accurate CBVa than obtained from a simpler two-point approach. ii) Implementation of the diffusion-weighted technique is simple both for continuous and pulsed ASL. The MOTIVE method with continuous ASL requires two coil system (two RF amplifiers) for modulation of MT levels without changing the arterial spin labeling efficiency. But, the MOTIVE approach could be implemented with pulsed ASL by applying variable MT-inducing RF pulses during the spin labeling period (e.g., inversion time in FAIR [5]). iii) MT-inducing RF pulses in the MOTIVE approach can cause significant power deposition, especially at high magnetic fields. Based on our experience in rat studies, the MOTIVE technique is more robust than the bipolar gradient method. However, since the MOTIVE approach with MT can not easily apply to human studies due to a concern of power deposition, the bipolar gradient CBVa approach is more appealing.
Similar diffusion-weighted ASL approaches were used to determine absolute CBVa in humans. Peterson et al. [11] and Brookes et al. [10] proposed to acquire labeling time-dependent ASL images by repetitive data acquisitions after pulsed arterial spin labeling. Non-exchangeable and exchangeable ASL signals can be de-convoluted with dynamic perfusion models, thus CBVa can be quantified from the non-exchangeable ASL signals. To obtain multiple labeling time-dependent ASL signals quickly, Look-Locker acquisitions were implemented after pulsed ASL [10, 11]. Small flip angle excitations were repeated with an inter-pulse interval after one ASL pulse, consequently the signal intensity is closely dependent on excitation flip angle and time interval between data collection. Thus, flip angle and inter-pulse delay should be optimized. Petersen et al. measured CBVa in humans to be 0.9% for gray matter and 0.3% for white matter [11]. Similarly, Brookes et al. found human CBVa of 1.7 – 2.2% (n = 6) in gray matter and 9 -10 % in area with large arterial vessels [10]. The CBVa obtained with dynamic ASL model turned out to be zero when arterial blood signals were suppressed with the b-value of 4.4 mm2/s [10], indicating that the proposed dynamic ASL model with two compartments is valid. The multiple spin-labeling time approach [10, 11] is effective to simultaneously measure CBVa and CBF, and arterial and capillary transit times can be additionally determined. Disadvantages of this approach are to select the proper time-interval between repeated data acquisitions, to measure excitation flip angles accurately, and to use complex dynamic ASL models. If the time interval is too short relative to the arterial blood travel time (τc - τa) in the imaging slice, the blood signal is partially saturated during repeated RF pulsing. When CBF, τc, and τa are obtained from ASL data with multiple spin labeling times, CBVa can be also calculated using the central volume principle. Recently, Liu et al. found CBVa of human gray matter to be 1.18 ml/100 g [25]. These measured human CBVa values [10, 11, 25] agree with those reported by Ito et al. of 1.1 ± 0.4 % in humans [32], in which a dynamic blood and tissue compartment model was used in conjunction with 11CO and time-dependent H215O PET studies. Compared to multiple spin labeling time studies, our bipolar gradient ASL approach with one spin labeling time is simple and has high sensitivity due to the use of 90° excitation pulse (rather than small flip angle pulses). However, the spin-labeling time should be selected longer than τc, which may not be straightforward in abnormal vascular conditions.
Recently, inflow-based vascular-space-occupancy (iVASO) technique was proposed to measure CBVa [33]. This approach is similar to the ASL method with an inflow time of τc. In this approach, two images are subtracted to obtain only arterial blood signals; one image is acquired at a blood nulling inversion time after a non-slice selective inversion pulse followed by a slice-selective inversion pulse, so spins within the imaging slice are un-perturbed, while inflowing blood spins will be initially inverted. The other image is obtained at the same inversion time after a slice-selective inversion pulse followed by a slice-selective inversion pulse, so both tissue and arterial blood spins are un-perturbed. Gray matter CBVa is reported to be 1.6 ml/100 g in humans. Although this approach is similar to other ASL CBVa methods, only one inversion time is used without the use of bipolar gradients. Thus, this is the most simple among all currently available CBVa measurement methods. The major drawback of this approach is to carefully select an inversion time to null blood signals, while the inflowing blood during the inversion time fills up only arterial vasculature. This condition is not easy to be met.
ARTERIAL VS. VENOUS CBV CHANGE DURING STIMULATION
Significant CBV changes induced by various neural stimuli have been observed using CBV-weighted fMRI and intrinsic optical imaging studies [34-36]. The separation of total CBV change into CBVa and CBVv changes is helpful for understanding basic vascular physiology and properly interpreting BOLD signals. We therefore investigated the relationship between CBVa and CBVt in isoflurane-anesthetized rats during 15-s forepaw stimulation [37]. Although most fMRI studies have been performed with α-chloralose anesthesia, we instead chose to use isoflurane because it provides stability of anesthetic depth coupled with simple noninvasive induction; these benefits enable us to maintain consistent animal physiology during the long duration of these experiments [38, 39]. CBF and CBVa were simultaneously determined by the MOTIVE technique [13], while CBVt was determined by following intravascular infusion of a susceptibility-based contrast agent [40, 41]. The difference between CBVt and CBVa was considered to be CBVv. Baseline vs. stimulation values in the somatosensory cortical region (see Fig. 5) were: CBVa = 0.83 ± 0.21 vs. 1.17 ± 0.30 ml/ 100 g, CBVt = 3.10 ± 0.55 vs. 3.41 ± 0.61 ml/ 100 g, and CBVa/CBVt = 0.27 ± 0.05 vs. 0.34 ± 0.06 (n = 7, mean ± SD) [37]. Absolute changes in CBVa (0.34 ± 0.16 ml/ 100 g) and CBVt (0.31 ± 0.11 ml/ 100 g) due to activation are similar (see Fig. 5). In our 15-s somatosensory stimulation studies in rats, the blood volume changes during neural stimulation occur mainly in arteries rather than in veins [37]. Direct optical measurements of vessel diameters show the similar finding that arterial blood vessels dilate, while venous vessels do not change much during 20-s neural stimulation [42]. Arterial vs. venous CBV changes can be dependent on stimulus parameters such as strength, spatial extent, and duration [30]. If the stimulus duration is short, venous CBV change will be minimal due to its passive responsiveness. If the stimulation duration is long, then venous CBV contribution is larger [43]. Nonetheless, arterial CBV change is highly significant, and can be used for functional brain mapping.
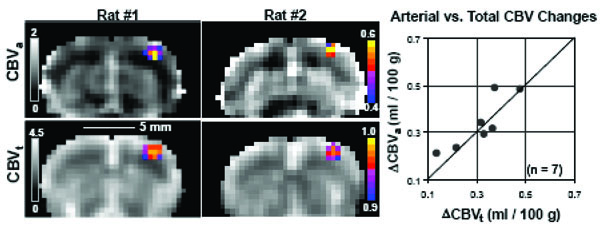
Quantitative baseline hemodynamic maps and responses to somatosensory stimulation [37]. Images are shown from two out of seven animals. CBVa maps (grayscale images in top row) were acquired with MT-varied ASL, while CBVt maps (grayscale images in bottom row) were obtained with 15 mg Fe/kg contrast agent, where quantitative baseline values are shown in units of ml/100g. Functional activation maps for ΔCBVa (color overlays in top row) and ΔCBVt (color overlays in bottom row) are shown as cross-correlation values. Activation foci are all located in the forelimb somatosensory cortex. Quantitative comparisons of ΔCBVa vs. ΔCBVt (right plot) were made by taking the differences between baseline and stimulation conditions within a 9-pixel region (i.e., 1.4×1.4×2.0 mm3) centered over the anatomically-defined somatosensory cortex. The similarity of ΔCBVt and ΔCBVa (within measurement error), indicates that arterial CBV changes are dominant. The line of identity is shown.
The implication of our CBVa findings have been discussed previously [37]. The BOLD effect depends on alterations in venous oxygenation level (Y) and CBVv in response to increased neural activity [21]; an increase in venous oxygenation level increases BOLD signals, while an increase in venous blood volume decreases the BOLD effect. It should be noted that an increase in CBVa in itself does not contribute to BOLD signals significantly. Generally, the CBVv change has been estimated directly from total CBVt measurements or indirectly from CBF changes using Grubb’s equation [44-47] under the assumption that CBVv changes are dominant. Since our results show that venous blood volume changes are minimal during short stimulation, BOLD fMRI signals will derive mostly from changes in venous oxygenation. Thus, the biophysical model for BOLD can be simplified as
where ΔR2* is the stimulus-induced relaxation rate change, ΔY is the change in venous oxygenation level, which is caused by the mismatch between CBF and cerebral oxygen consumption (CMRO2) changes, and M is a constant closely related to many biological and MR parameters, including vessel size, magnetic field, and pulse sequence. To show the importance of functional CBVv contribution, relative CMRO2 changes were estimated from the human visual cortex data reported in Kim et al. [46], which are ΔCBF/CBF and ΔR2* of 47% and -0.45 s-1 during hypercapnia, and 44% and -0.11 s-1 during visual stimulation, respectively. i) When it is assumed that the relative CBVv (rCBVv) change = the relative CBVt change obtained from ΔCBF/CBF using the Grubb’s equation for both hypercapnia and visual stimulation, which has been widely used in the fMRI community, the relative CMRO2 change is 17%. ii) If the rCBVv change = the relative CBVt change in hypercapnia, but rCBVv change = 0 for visual stimulation, then the relative CMRO2 change is 38%. iii) If the rCBVv change = 0 for both hypercapnia and neural stimulation, then the relative CMRO2 change is 30%. The ratio of relative CMRO2 to CBF change is 0.39, 0.86, and 0.68, depending on the different rCBF vs. rCBVv conditions. When the commonly-accepted assumption of significant CBVv changes is used (case #1), ΔY will be overestimated as determined from the measured BOLD response, and consequently the CMRO2 change is underestimated significantly. Thus, the proper estimation of rCBVv change, which is indirectly determined from arterial and total CBV changes in our laboratory, is important to quantify relative CMRO2 change from BOLD signals.
SPATIAL SPECIFICITY OF ARTERIAL CBV CHANGE
One of important questions is whether the functional CBVa response is specific to sites of neural activity. To evaluate spatial specificity of fMRI signals, the cat cortical layer model with full-field visual stimulation can be used [36]. If the fMRI signal is specific to neural activity, the highest change should occur within layer 4, which has the highest density of capillary mesh and synapses, and which has the highest changes in neural activity, metabolism, and blood flow during sensory stimulation [48]. Layer 4 is roughly located at the middle of the cortex (hyperintensity area in T1-weighted image indicated by black arrows in Fig. 6D). Full-field visual stimulation activates the entire visual cortex, so blood containing stimulus-induced deoxyhemoglobin changes travels far downstream to large draining veins, thus it is ideal to examine spatial specificity of fMRI signals. Note that the rat forepaw stimulation model used in Fig. (5) is not ideal for investigating spatial specificity due to small activation area and consequently minimal draining problem. To obtain both BOLD and CBVa changes, MT-varied BOLD fMRI [22] was used on a well-developed cat visual cortical model due to its higher sensitivity and temporal resolution over ASL approaches. BOLD fMRI with three MT levels was acquired across cortical layers of isoflurane-anesthetized cats during visual stimulation with a single-shot gradient-echo (GE) EPI technique with slice thickness = 2 mm, in-plane resolution = 0.31×0.31 mm2, TE = 20 ms, and TR = 1 s. In conventional GE-BOLD fMRI (i.e. without MT effect), the highest percentage signal changes occur above the surface of the cortex (green contour area in Fig. 6A), within the subarachnoid space containing cerebrospinal fluid (CSF) and numerous large vessels (including pial veins). Stimulus-induced changes normalized by S0 (ΔSMT/S0) were linearly fitted against corresponding normalized baseline signals (SMT/S0) (refer to Fig. 2 schematic). When intercepts were computed from BOLD data acquired at three different MT levels, positive values were observed within the cortex, while negative values were detected mostly from the cortical surface (Fig. 6B). Since arterial vessels dilate during stimulation, only positive intercept values are shown in the ΔCBVa map of (Fig. 6C). Within the cortex (within the green contours), the highest change was observed at the middle of the cortex (indicated by white arrows in Fig. 6C), where average ΔCBVa and BOLD responses without MT effects (n = 7) were 0.33 ± 0.02 ml/ 100g and 1.16 ± 0.44%, respectively [30]. Negative changes observed in the surface of the cortex (purple pixels in Fig. 6B) are likely due to a decrease in MT-insensitive CSF volume [30], which was experimentally proven using T1rho-based fMRI [49]. This clearly demonstrates that arterial CBV fMRI will improve spatial specificity to sites of neural activity relative to BOLD fMRI.
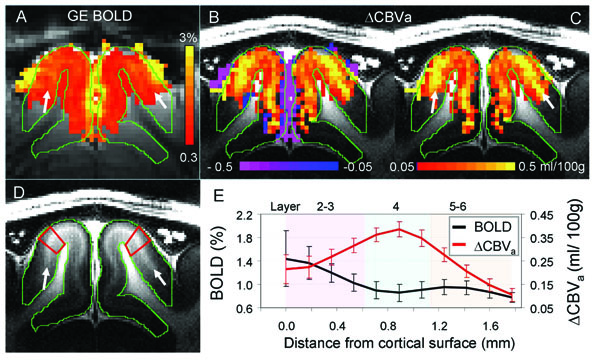
Gradient-echo BOLD vs. arterial CBV-based fMRI responses to visual stimulation in isoflurane-anesthetized cats at 9.4 T [30]. Images and functional maps illustrate results from one of seven animals. A: gradient-echo BOLD fMRI with TE = 20 ms (without MT). To determine arterial CBV changes, only pixels which are active in BOLD fMRI were selected. Then, intercepts were calculated from gradientecho BOLD data acquired at 3 different MT levels. B & C: intercept maps. Since negative intercepts (purple) are likely due to a reduction of the MT-insensitive CSF volume, only positive intercepts (red/yellow) were converted to ΔCBVa values for quantification, shown in C. Clearly, the highest CBVa change is located at the middle of the cortex indicated by white arrows. D: T1-weighted anatomic image showing gray and white matter contrast. The visual cortex indicated by green contours has a myelin-rich hyperintense band at the middle of the cortex (white arrows), indicating layer 4. E: average cortical depth profiles of GE BOLD fMRI (without MT) and ΔCBVa obtained from quadrangular ROIs in area 18 (illustrated by red outlines in D). Approximate cortical layer locations were determined by the relative distances of those layers in area 18 [48]. Error bars: SEM (n = 7).
Since CBVa response is more specific to neural activity relative to BOLD fMRI, it can be used for high-resolution fMRI. Functional CBV measurements with endogenous contrasts have been shown by i) arterial spin labeling with varied MT effect (i.e., MOTIVE) [37] and Look-Locker EPI [10], ii) vascular space occupancy (VASO) [50], and iii) apparent diffusion coefficient (ADC) [51]. ASL with LL EPI was used in humans for fMRI studies; baseline CBVa in the motor cortex was 3.7% and increased to 4.9% during finger tapping [10], and baseline CBVa in the visual cortex was 0.88 ml/100 g and increased to 1.44 ml/100 g during visual stimulation [52]. Functional CBVa maps appear to be more localized than BOLD fMRI [10]. The VASO technique has been used to determine temporal dynamics of functional CBV change, but its sensitivity is quite poor, especially at high magnetic fields. Since T1 values of blood and tissue converge at high fields, the suppression of blood signals with the non-selective inversion recovery technique results in low tissue signals. To overcome this issue, inflow-enhanced slab-selective VASO approach was proposed [53], which can also improve spatial resolution [53]. However, the VASO technique is difficult to the quantification of absolute or relative CBV changes, and also sensitive to CSF contributions. Functional ADC changes with small b-values are heavily weighted by ΔCBVa if venous blood signals are suppressed [31]. The venous blood signal can be suppressed at setting TE >> T2*, which can be achieved at high fields. In fact, this bipolar gradient BOLD approach has been extensively used to separate intra- and extra-vascular functional signals [27, 54].
Based on our animal studies at 9.4 T, we found that MT-varied BOLD provides the highest sensitivity and temporal resolution among available techniques in our laboratory, ASL with MT (MOTIVE), VASO, and ADC. The MT-varied BOLD technique provides simplicity, high temporal resolution and high sensitivity for the quantification of ΔCBVa, thus is the choice of non-invasive CBV-weighted fMRI methods in animal studies with a surface coil. Drawbacks of the MT-varied BOLD technique are many folds. i) Additional MT-inducing pulse is required, consequently concerning SAR at high magnetic fields. ii) Since inflow spins should not experience MT-inducing pulses, the surface coil is preferable. When a homogeneous coil is used, then inflowing arterial blood also have up to 40% of tissue MT effects [55]. iii) In MT BOLD fMRI, the venous CBV contribution is assumed to be minimal. If MT effect in tissue and venous blood is similar due to free water exchange, then both venous blood and tissue signals are MT-dependent, while the arterial signal is MT-independent. This assumption is valid when MT pulses are long enough (≥ water exchange time). Otherwise, the venous blood signal is suppressed by setting TE >> T2* of venous blood, which can be achievable at high fields. iv) MT BOLD fMRI requires two fMRI runs with or without MT effect. Due to head motions between fMRI runs, MT-varied BOLD fMRI is not easy to be implemented for human fMRI studies.
CONCLUSIONS
Quantitative CBVa and its functional changes can be determined non-invasively with MRI. The CBVa response shows dominant to total CBV change during neural activation and well-localized to neural activity, and also provides the quantification of functional activity. Therefore, the CBVa MRI techniques may be valuable tools for routine determination of vessel viability and function, as well as the identification of vascular dysfunction.
ACKNOWLEDGEMENTS
This work was supported by NIH grants EB012140, EB003324, EB003375, and NS44589.

