All published articles of this journal are available on ScienceDirect.

Cerebral Blood Volume Measurements – Gd_DTPA vs. VASO - and Their Relationship with Cerebral Blood Flow in Activated Human Visual Cortex
Authors Info & Affiliations
Abstract
Measurements of task-induced changes in cerebral blood volume (CBV) have been demonstrated using VAscular Space Occupancy (VASO) techniques (noninvasive and newly developed) and a contrast agent-based (Gd- DTPA) method (invasive but well-established) with functional magnetic resonance imaging (fMRI). We compared the two methods in determining CBV changes during multi-frequency visual stimulation (4 and 8 Hz). Specifically, we aimed to assess the impact of repetition time (TR) on CBV changes determination using VASO. With additional measurements of cerebral blood flow (CBF), the flow-volume coupling relationship (α value) and cerebral metabolic rate of oxygen were further determined. The results showed that i) using VASO, short TR (2s) caused overestimation of CBV changes, while long TR (6s) generated consistent CBV results, by comparison to the GD-DTPA method; ii) overestimation of CBV changes caused underestimated CMRO2 changes, but did not alter the frequency-related pattern, i.e., CMRO2 changes at 4 Hz were greater than those at 8 Hz regardless of the TR; and iii) the tasked-induced CBF-CBV coupling was stimulus frequency-dependent, i.e., α = 0.35-0.38 at 4 Hz and α = 0.51-0.53 at 8 Hz. Our data demonstrated that, with carefully chosen TRs, CBV measurements can be achieved non-invasively with VASO techniques.
INTRODUCTION
Cerebral blood volume (CBV) and cerebral blood flow (CBF) are two important perfusion parameters for understanding cerebral hemodynamics in the healthy condition and the hemodynamic alterations in disease states such as those observed in brain tumors, stroke or ischemia. In addition to providing information about hemodynamic mechanisms, these two parameters are necessary to determine the quantitative cerebral metabolic rate of oxygen consumption (CMRO2) using positron emission tomography (PET) [1].
Significant increases in CBV and CBF are usually accompanied with brain activation. The relationship between the task-induced CBF and CBV percent changes, determined as α = ln(1 + ΔCBV/CBV0)/ln(1 +ΔCBF/CBF0) (where “Δ” and “0” denote “change” and “resting state”, respectively, of the variable), is also of great interest because it is important for identifying the cerebral vascular resistance (the brain increases CBF by reducing cerebral vascular resistance, corresponding to an increase in CBV) [2] and for calibrating the blood oxygenation level-dependent (bold) contrast for calculating CMRO2 relative changes with a fMRI biophysical model [3]. Consequently, many studies seek to determine the value of α using neuroimaging methods.
Using PET, Grubb et al. [4] reported that α was approximate 0.38 when the increases in CBF and CBV reached steady state during hypercapnic challenge in rhesus monkeys. Since then, α = 0.38 has been widely used as the assumed CBF-CBV relationship under various physiological circumstances [3, 5]. Nonetheless, also using PET, Ito et al. [6], using a multi-frequency (2 and 8 Hz photic flickers) visual stimulation paradigm, found that task-induced increases in CBF and CBV were frequency-dependent (CBF: 16 ± 16 % and 68 ± 20 % at 2 and 8 Hz, respectively; and CBV: 10 ± 13 % and 21 ± 5 % at 2 and 8 Hz, respectively). The results implied that α may also be stimulus frequency-dependent (varying from 0.37-0.65). However, due to the large standard error, the evidence for rate-varying CBF-CBV coupling was not significant.
Using fMRI, we have previously measured CBV changes with the vascular space occupancy (VASO) techniques [7] and demonstrated the frequency-dependent CBF-CBV coupling (α = 0.47-0.65) with multi-rate visual stimulation [8]. The standard error (< 7%) of the variables was much smaller compared to Ito’s PET study [6]. Nonetheless, The VASO method has several drawbacks. For example, the baseline CBV value is assumed for calculating the relative CBV from the VASO signals; the VASO signal may be contaminated by CBF signals when short repetition time (TR) is used, e.g. TR = 2s [9].
The purpose of study, therefore, was to i) re-visit the CBF-CBV coupling relationship during brain activation with fMRI methods and, ii) to investigate the effect of TR on CBV measurement using VASO. We measured the task-induced CBF changes with the arterial spin labeling (ASL) techniques. We used a contrast agent-based method (gadolinium diethylenetriamine penta-acetic acid; Gd-DTPA), a reliable and straightforward approach for CBV measurement, to test VASO method [10]. Short (2s) and Long (6s) TR were employed for the VASO approach. Comparison between the three CBV measurement methods (Gd_DTPA, VASO_TR= 2s; and VASO_TR= 6s), the CBF-CBV coupling under multi-rate visual stimulation and the coupling impact on relative CMRO2 determination were demonstrated and discussed.
MATERIALS AND METHODOLOGY
Subjects
Seven healthy subjects (4 males and 3 females) between the ages of 20 to 34 participated in the study. The protocol was approved by the Institutional Review Board of the University of Texas Health Science Center at San Antonio. Informed Written consent was obtained from each volunteer.
Stimulus Conditions
The stimulus was generated with a Dell personal computer (Dimension 2400, Austin, TX, 60 Hz monitor refresh rate) and was back-projected on a screen inside the scanner using a RF-shielded DLP projector (LP70; InFocus, Wilsonville, OR). The stimulus consisted of a black–and-white radial checkerboard pattern. Subjects viewed the screen via a mirror while they lay in the scanner. Stimulus presentation was automatically synchronized with data acquisition. During the functional study, subjects were shown the checkerboard flashing at frequencies of 4 and 8 Hz, with 1 Hz defined as one contrast reversal per second. The visual stimulation paradigm consisted of 3-min 4Hz/3-min off (eyes closed)/3-min 8Hz.
MRI Experiment
Experiments were performed on a 3T Siemens Trio MRI scanner (Siemens, Erlangen, Germany). An intravenous line was inserted for Gd-DTPA contrast agent administration. A standard Transmit/Receive head coil was used. Four slices (5 mm in thickness) encompassing the primary visual cortex were chosen for functional imaging. Images were acquired with a field-of-view (FOV) of 24 cm and in-plane matrix size of 64 x 64. After positioning, the task-induced CBV was measured by VASO acquisition with TR/TE = 6000 ms/9.4 ms and inversion time (TI) of 1086 ms. This was followed by simultaneous acquisitions of VASO, ASL and bold with TR of 2000 ms [8, 11]. TEs for VASO, ASL and bold image acquisition were 9.4 ms, 11.6 ms and 28.1 ms, respectively. The inversion delay times were 610 ms (TI1) and 1000 ms (TI2), respectively. The inversion slab thickness was 100 mm. The simultaneous acquisitions were then followed by the contrast-based method to measure the task-evoked CBV changes. 0.1 mmol/kg bolus Gd-DTPA (Omniscan, GE Healthcare, Princeton, NJ) was injected per condition (i.e., rest, 4 Hz and 8 Hz) using a power injector (MEDRAD, Pittsburg, PA) with injection rate of 5 ml/s. The images were acquired using a gradient echo echoplanar imaging (EPI) sequence with TR/TE = 2000 ms/30 ms. High-resolution T1-weigthed anatomical images were also obtained with TR/TE/flip angle = 500 ms/11 ms/900, slice thickness = 6 mm, in-plane resolution = 1 x 1 mm2.
Data Processing and Analysis
Data were processed and analyzed using MATLAB 7 (Math Works, Natick, MA). For each condition (rest, 4 Hz and 8Hz), changes in brain signal intensity occurring during cerebral transit of the high magnetic susceptibility Gd-DTPA were converted to contrast agent concentration-time curves. The area under the concentration-time curve is proportional to the local relative CBV. These calculations were performed on a voxel-by-voxel basis to generate images of relative CBV [10]. For the simultaneous acquisitions, the VASO image series was obtained by adding the adjacent slab-selective and nonselective images acquired from the first echo in the inversion recovery sequence. The ASL/bold image series was obtained by subtracting/adding the adjacent slab-selective and nonselective images from the second/third echo in the sequence. Student’s t tests were used to compare “baseline” and each frequency “stimulus” signals from contrast agent-based CBV maps, VASO, ASL and bold. The threshold was set to t = 3.0 (P < 0.005). For each subject, functional images as well as the high-resolution T1-weighted anatomical images were normalized to a standard brain co-ordinance (Talairach space). The four functional maps (i.e., agent-based CBV, VASO, ASL and bold) were then registered to the anatomical images using a Convex Hull algorithm [12]. Only those common activation areas that passed the statistically significant threshold for all the four functional maps were utilized for calculating the average values of the %CBV, %CBF, and %bold. The three functional quantities were then used to calculate the α values and the %CMRO2 with the fMRI biophysical model (Eq (1), [3, 8]). The %CBV determined by the three different strategies were compared with by one-way, repeated-measures ANOVA. Post-hoc testing per condition was done by Newman-Keuls test.
where β = 1.5. m is the basal bold relaxation rate, determined typically by hypercapnic challenge, as follows.
Hypercapnia
Mild hypercapnia (5% CO2, 20% O2, balance N2) was induced through administration of a mixture of CO2 and air through a non-rebreathing face mask (Hudson RCI, Model 1059, Temecula, CA) with 1 block of 3 min off/3 min on. At baseline, the subjects inhaled medical air (human oxygen grade compressed air). During hypercapnic perturbations, the CO2 gas was combined with medical air in a Y-connector. End-tidal CO2 was monitored by means of a nasal cannula with an aspirator. ASL and bold were simultaneously measured as described above. Because of the dosage limitation (0.3 mmol/kg) of the Gd_DTPA contrast agent, the CBV changes during hypercapnic challenge were only measured with the VASO techniques (with TR = 6 s). Other VASO imaging parameters were identical to those used in functional studies as described above.
Statistics
The measured %CBV with the three methods were compared with by one-way. Repeated-measures ANOVA. Post-hoc testing per condition was done by Newman-Keuls test.
RESULTS
Fig. (1) shows the group-averaged CBV and CBF maps obtained at 4 and 8 Hz. The magnitude of the %CBV measured by the three methods (M1: Gd_DTPA; M2: VASO_TR = 6s; and, M3: VASO_TR = 2s) were shown in Table 1. There was no significant statistical %CBV difference between M1 and M2 (P > 0.05). The correlation of the %CBV values obtained by the two methods across the seven subjects was further demonstrated in Fig. (2). The %CBV values were highly correlated between M1 and M2 for both 4 Hz (r = 0.92) and 8 Hz (r = 0.90). In contrast, a significant difference was found between M1 and M3; M2 and M3 (P < 0.001). Specifically, the %CBV values determined by M3 were 4-5% higher than those determined by M1 and M2 (Table 1).
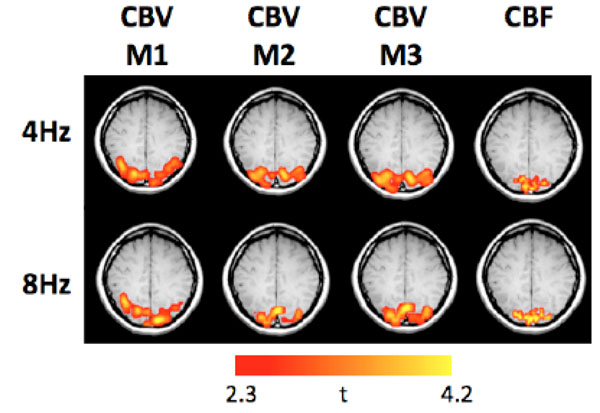
The group-averaged CBV and CBF functional maps obtained at 4 and 8 Hz (M1: Gd_DTPA; M2: VASO_TR = 6 s; M3: VASO_TR = 2s).
Task-Induced Changes in CBV Determined by the Three Methods (M1, M2 and M3)
|
|
||
|---|---|---|
| Method | 4Hz (CBV%) | 8Hz CBV(%) |
|
|
||
| M1.Gd_DTPA | 13.9±5.5 | 25.8±9.1 |
| M2. VASO (TR=6s) | 15.4±4.9 | 27.1±5.8 |
| M3. VASO (TR=2s) | 20.3±6.0 | 31.4±5.5 |
|
|
||
| F | 3.76* | 1.62 |
| Post hoe | M1 = M2 < M3 | M1 = M2 < M3 |
|
|
||
Values are SD (n=7). F values were computed by one-way, repested measure ANOVA, indicates P < 0.05. Post-hoe testing was performed per condition by Newman-Keuls, where < indicates P < 0.01 and = indicates P > 0.05.
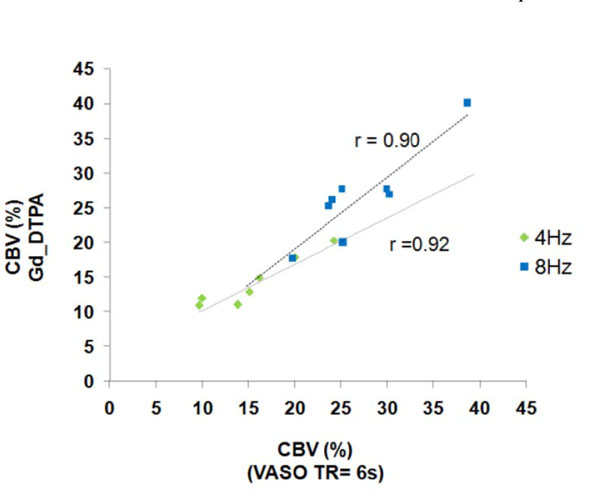
Correlation of the CBV changes between M1 and M2 at 4 and 8 Hz (M1: Gd_DTPA; M2: VASO_TR = 6s).
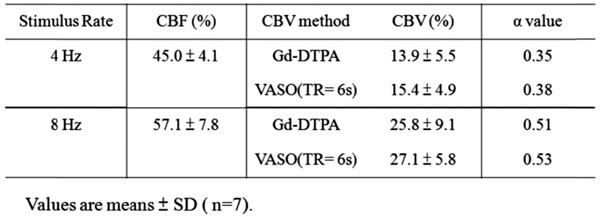
The %CBV measured by M1 and M2 were used for further α calculation with the measured %CBF. It showed in Table 2 that the α value was stimulus frequency-dependent, with α = 0.35-0.38 at 4 Hz and α = 0.51-0.53 at 8 Hz. The α value distribution among the seven subjects obtained by M1 was further demonstrated in Fig. (3) — α was gathered at 0.3-0.4 at 4 Hz whereas was scattered from 0.4 to > 0.6 at 8 Hz.
Task-Induced Changes in CBF, CBV (Determined by M1 and M2) and the Corresponding α Values (M1: Gd_DTPA; M2: VASO_TR = 6s)
 |
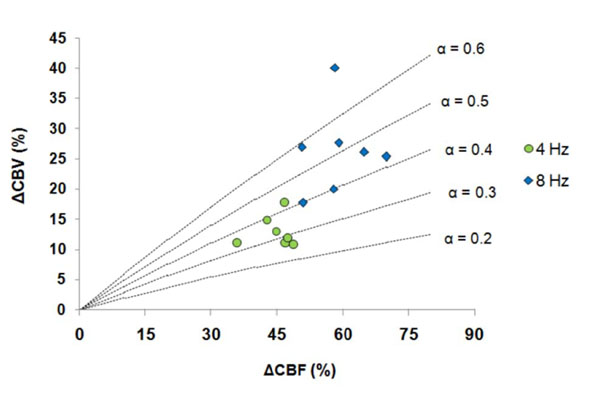
Distribution of the α values at 4 and 8 Hz (CBV changes were determined by M1: Gd_DTPA).
To estimate the impact of %CBV on %CMRO2 determination, the %CBV obtained by the three methods were used for calculating %CMRO2 with the Eq. (1). The results were demonstrated in Fig. (4). It showed that the %CMRO2 determined by M3 was significantly lower than that determined by M1 and M2 (P < 0.05) due to the overestimated %CBV. Nonetheless, the trend of the %CMRO2 changes (i.e. 4 Hz > 8 Hz) was not altered.
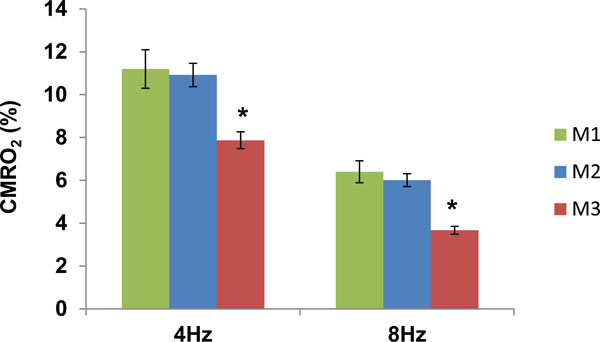
Task-induced changes in CMRO2 determined by M1, M2 and M3 at 4 and 8 Hz (M1: Gd_DTPA; M2: VASO_TR = 6s; M3: VASO_TR = 2s). *P < 0.05.
DISCUSSION
Our data demonstrated that VASO signal intensities varied with TR. The observation was consistent with a previous report [9]. It has been suggested that contrast obtained by VASO signals can be predominately dependent on CBV when blood water is in steady state (nulled). However, when short TR is used, the fresh-blood fraction (non-nulled, similar to that from ASL) is likely small but potentially significant, which causes contamination and enhancement of the VASO signals and thus the overestimation of %CBV. At long TR, the fresh-blood fraction (CBF) contribution becomes small and the signal plateaus from brain tissue (e.g. gray matter) can be considered predominately due to CBV [9]. It showed in our study that at long TR, %CBV obtained at 4 and 8 Hz with VASO (M2) were in good agreement with those obtained by the Gd-DTPA method (M1).
Combined with the %CBV (by M1 and M2) and %CBF measurements, we further demonstrated that the task-induced flow-volume coupling (α value) was not constant, but varied with stimulus frequency, ranging from 0.35 to 0.53. Our MRI findings were in good agreement to the prior PET results (α ~0.37-0.65; [6]), but were with much smaller errors (the error bar of the α was about 35% of the α value). The data suggests that direct measurement for task-induced %CBV (rather than using an assumed value) is important to understand the flow-volume coupling relationship under various stimulus conditions and to more accurately determine the task-evoked %CMRO2 with the bold biophysical model (Eq. (1)). Additionally, it also showed in the present study that with long TR (6s), the α obtained with VASO at 4 Hz (0.38) and at 8 Hz (0.53) were smaller than those we previously reported with short TR (2 s, α = 0.47 and 0.65 at 4 and 8 Hz, respectively; [8]) due to the decreased %CBV.
Because of the decreased %CBV, %CMRO2 obtained at long TR were shown significantly higher than those obtained at short TR. Although the %CMRO2 magnitudes were different between the two measurements, the patterns were similar (i.e., %CMRO2: 4 Hz > 8 Hz). As a result, a non-linear flow-metabolism coupling relationship (%CBF: 8 Hz > 4 Hz) was observed with both methods. The finding was consistent with our previous reports [8].
The %CMRO2 determination in the study employed the total %CBV as measured by either Gd-DTPA or VASO techniques. Although CMRO2 response depends strongly on the venous CBV changes, total CBV increases are used in the bold biophysical model (Eq. (1)) with the assumption that venous CBV increases by the same fraction as total CBV [3]. However, collecting evidence has shown that most of the CBV change is on arterial side. Specifically, venous CBV is negligible with short-term stimulation (e.g. < 20s forepaw stimulation in rats; [13]. In the current study, the stimulation period was sufficiently long (3 min) and venous CBV was considered significant [14], but it is suggested to further identify the contribution of arterial and venous CBV increases for task-induced CMRO2 changes in the future studies.
Another limitation of the current study is that we were unable to identify the CBV-CBF transfer function as well as the factors causing discrepant α values between 4 and 8 Hz (i.e., why the α values obtained at 4 Hz were smaller and centralized compared to those obtained at 8 Hz). These were mainly due to the dosage limitation of Gd_DTPA. In the present study, only 0.3 mmol/kg (3 doses) was approved to be used in healthy subjects. Consequently, we were able to measure the hemodynamics in three conditions (rest, 4 Hz and 8 Hz). Given just these two points of the task-induced CBF-CBV relationship, it was not possible to determine the nature of CBF:CBV transfer function. With the validation of VASO techniques by comparison to the Gd-DTPA method, it would be really helpful in the future studies to have more stimulus rates (e.g. 1, 2, 4, 6, 8 Hz) using VASO to better sample the CBF rate-response curve and compute the CBF:CBV transfer function.
CONCLUSION
We demonstrated the TR effects on %CBV measurements using VASO techniques, frequency-dependent CBF-CBV coupling under multi-rate visual stimulation, and the impact of %CBV on %CMRO2 determination. With the validation by comparison to the Gd-DTPA method for task-induced CBV changes and to the O-15 PET method for the quantitative CBV measurement [15], VASO techniques are expected to have wide applications for studies in normal physiology and disease states in the near future.
CONFLICT OF INTEREST
The research was conducted in the absence of any commercial or financial relationships that could be construed as a potential conflict of interest.
ACKNOWLEDGEMENTS
This work was supported by NIH R01 MH084021 to H.L. and NIH/UTHSCSA General Clinical Research Center (GCRC) grants M01 RR01346 to P.T. F.

