All published articles of this journal are available on ScienceDirect.

Changes in Event-Related Desynchronization and Synchronization during the Auditory Oddball Task in Schizophrenia Patients
Authors Info & Affiliations
Abstract
Objective:
We studied differences in the spatiotemporal dynamics of cortical oscillation across brain regions of patients with schizophrenia and normal subjects during the auditory oddball task using magnetoencephalography (MEG) and electroencephalography (EEG).
Methods:
Ten right-handed male schizophrenia patients were studied. We used a newly developed adaptive spatial filtering algorithm optimized for robust source time-frequency reconstruction of MEG and EEG data, and obtained consecutive images in functional maps of event-related desynchronization (ERD) and synchronization (ERS) in theta, lower alpha (8–10 Hz), upper alpha (10–13 Hz), and beta bands.
Results:
Beta ERD power at 750–1000 ms in patients was significantly increased in large right upper temporal and parietal regions and small upper portions of bilateral dorsal frontal and dorsal-medial parietal regions. Theta ERS power in schizophrenic patients during the oddball task was significantly increased in the left temporal pole at 250–500 ms, and was significantly increased in dorsal, medial frontal, and anterior portions of the anterior cingulate cortex in both hemispheres, and the left portion of lateral temporal regions at 500–750 ms, compared to the control group (family-wise error correction p<0.05). Lower alpha ERS power was significantly decreased in the right occipital region at 500–750 ms and in the right midline parietal and bilateral occipital regions at 750–1000 ms. Upper alpha ERS power was significantly decreased in right midline parietal and left occipital regions at 750–1000 ms.
Conclusions:
ERD/ERS changes were noted in the left temporal pole and midline frontal and anterior cingulate cortex in theta ERS, occipital lobe in alpha ERS, and right temporal-frontal-parietal, midline frontal, and anterior cingulate cortex in beta ERD. These findings may reflect disturbances in interaction among active large neuronal groups and their communication with each other that may be related to abnormal cognitive and psychopathological function.
Significance:
Study of ERD and ERS by time-frequency analyses using MEG is useful to clarify data processing dysfunction in schizophrenia.
INTRODUCTION
We studied differences between P300 components of event-related potential (ERP) in patients with schizophrenia and normal control subjects during a standard auditory oddball task using magnetoencephalography (MEG) and electroencephalography (EEG). We measured event-related synchronization (ERS) and event-related desynchronization (ERD) [1]. Investigations using MEG also accurately localized the sources of auditory evoked responses [2], and provided higher spatial stability and a more focal ERD and ERS compared to EEG [3]. MEG and EEG have been used to study neural activity in normal subjects and patients with schizophrenia. P300 and ERD are related such that slow and fast alpha ERD are specifically guided or modified by the internal events indexed by P300 [4, 5]. ERD/ERS study may be as useful as P300 as an electrophysiological index reflecting the pathophysiological processes underlying the onset of schizophrenia [6]. ERD/ERS patterns in schizophrenia patients have already been explored using MEG [7, 8]. It was demonstrated that the temporospatial patterns of brain oscillations can be used as a biometric marker that discriminates schizophrenia patients and healthy controls [9].
P300 has been intensively investigated as an electrophysiological index of cognitive function since its discovery by Sutton et al. [10]. P300 amplitude and latency were used as indices of the nature and timing of cognitive response to a stimulus. Many hypothetical constructs have been suggested to account for the variations in P300 related to attentiveness, orientation, decision making, uncertainty reduction, intentional engagement, demand processing, salience, task relevance, equivocation, and value [11]. The amplitude of the P300 component is multiplied by subjective probability factors and the task relevance of eliciting events, whereas its latency depends on the duration of stimulus evaluation and is assumed to index stimulus processing speed [12]. The oddball task is thought to reflect working memory function and/or attention, and the “updating theory” as an explanation of P300 proposed that P300 is a manifestation of activity occurring when one’s model of the environment must be revised [13]. P300 is thought to be composed of several parts that reflect an information processing cascade when attentional and memory mechanisms are engaged [4]. Since P300 abnormalities in patients with schizophrenia were first found by Roth and Cannon in 1972 [14], many investigations reported that patients with schizophrenia have smaller P300 [15-20]. In studies of ERPs in schizophrenia patients, the oddball paradigm was more useful in studies of the brain in the active rather than the resting state, and demonstrated that amplitude and prolonged latency of the P300 waveform in schizophrenia patients were reduced compared with normal subjects [12, 21-30]. Reduction of P300 amplitude is one of the most replicable biological observations in patients with schizophrenia [31], and P300 amplitude and latency are powerful tools in the study of schizophrenia [32]. The reduced P300 amplitude on EEG in patients with schizophrenia was interpreted as an electrophysiological index relating to thought disorders [32, 33]. The symptom-independent reduction in event-related alpha attenuation in schizophrenia may be useful as an electrophysiological index of the impairment of neural processes distinct from those indexed by symptom-dependent P300 abnormalities [6].
Magnetic source localization agrees with electric source localization of the auditory P300 [34]. Recently, spatially filtered MEG has made it possible to detect and localize sources of task-related changes in the on-going oscillatory activity involved in auditory attention and memory [35]. The physiological mechanisms underlying alpha synchronization and desynchronization reflect a complex pattern of microscale synchronization during information processing in the brain [36]. A phasic, i.e. short, local desynchronization is present during sensory stimulation and also preceding the imperative signal and motor response including motor preactivation in the contingent negative variation paradigm. ERD is not seen in comatose patients but is a phenomenon of the conscious state of the brain, related to preactivation or priming of the cortical areas needed for a specific task, sensory and cognitive processing, and motor behaviour [36-40]. ERD has an electrophysiological correlation with cortical activation related to stimulus processing or motor output, and is characteristic of cortical areas or neural structures preparing to process sensory information or ready and prepared to execute a motor command [40, 41].
The mechanisms underlying brain coordination and transmission of information in the brain are not known. However, an influential hypothesis suggests that oscillations in neural activity are fundamental for modulating, filtering, and routing information in the nervous system, such as the “communication-through-coherence” hypothesis [42, 43] and may support the dynamic coordination of brain circuits underlying cognitive processes and behaviour [44]. These leading theories suggest that brain communication may occur through synchronization of large populations of neurons.
In this study, we investigated the relationship between frequency bands and functions related to the classical auditory oddball task in patients with schizophrenia and control subjects. Several investigations showed changes in the time- and frequency-dependent spatiotemporal distribution of cerebral oscillation [45-50]. We conducted time-frequency studies using a 160-channel whole-head MEG system and EEG, and investigated whether schizophrenia patients exhibit changes in ERD and ERS in the theta (4–8 Hz), lower alpha (8–10 Hz), upper alpha (10–13 Hz), and beta (13–30 Hz) bands while performing the conventional auditory oddball task. As far as we know, there are few studies using MEG of ERD and ERS in male patients with schizophrenia during the oddball task. In this study we applied a newly developed adaptive spatial filtering algorithm optimized for robust source time-frequency reconstruction from MEG and EEG data [49].
METHODS
Subjects
Ten right-handed male patients with schizophrenia (mean age 30.9±5.0 years) were examined (Table 1). The patients were diagnosed according to DSM-Ⅳ-TR criteria (American Psychiatric Association, 2000); five were inpatients and five were outpatients who had been medicated with neuroleptics for 2–15 years. Their overall psychopathology was evaluated by the Positive and Negative Syndrome Scale for schizophrenia (PANSS). All patients were screened by medical history, laboratory testing, and magnetic resonance imaging (MRI) or CT. Ten healthy right-handed male volunteers (mean age 28.5±4.6) without psychiatric illness were used as controls. All subjects gave written informed consent after receiving oral and written explanations of the nature of the study.
Experimental Design
The standard auditory oddball paradigm was performed with a stimulus sequence in which the target tone was 2000 Hz with a probability of 20% and the non-target tone was 1000 Hz with a probability of 80%. Both stimuli were delivered binaurally by a sound simulator for a duration of 100 ms, rise/fall time of 10 ms, intensity of 80 dB SPL, and constant ISI (interstimulus interval) of 2.3 s. Subjects were asked to silently count the number of target stimuli. Three sessions were recorded, each consisting of about 20 target stimuli. Short breaks were given to the subjects between sessions but without allowing head movement. All subjects detected more than 90% of the stimuli.
MEG Recording
MEG data were recorded in a magnetically shielded room at Fujimoto Hayasuzu Hospital using a 160-channel whole-head MEG system (Yokogawa Electric Corporation, Kanazawa, Japan). The sensing coils in this system are 15.5 mm in diameter, with a 50 mm baseline and 23 mm separation between each pair of sensing coils. The subjects lay in the supine position with their eyes closed. MEG data were recorded through a 0.16–200 Hz band-pass filter with a sampling rate of 1000 Hz. Epochs containing eye movements were excluded from further analysis.
EEG Recording
EEG was concurrently acquired with Ag/AgCl electrodes placed, in accordance with the international 10–20 system of placement, at FP1, FP2, F3, F4, C3, C4, P3, P4, O1, O2, F7, F8, T3, T4, T5, T6, Fz, Cz, and Pz. All electrodes were referenced to linked earlobes. Electrode impedance was held below 5 kOhm. EEG data were recorded through a 0.53–120 Hz band-pass filter with a sampling rate of 500 Hz. We used the EEG in order to confirm P300 activities.
Data Analysis
- We calculated event-related potential (ERP) and event-related field (ERF) to confirm EEG and MEG P300 response.
- The time-frequency representations were calculated on the sensor-space to determine the time and frequency band of interest.
- Based on sensor-space time-frequency representations, the magnetic field data of each subject and each task were divided into four frequency bands: theta (4–8 Hz), lower alpha (8–10 Hz), upper alpha (10–13 Hz), and beta (13–30 Hz) bands. For these frequency bands, the current density on each voxel was calculated by means of an adaptive spatial filtering using a single spherical volume conductor model based on the individual MR image. Power changes in the current density between the active and baseline periods for each voxel with 7 mm grid spacing were calculated. The baseline period was defined as the time between 250 and 0 ms before stimulus onset, and the active period of interest was defined as the continuously moving 250 ms windows from stimulus onset to 1000 ms after stimulus onset.
- By means of group analysis using SnPM, the statistically significant oscillatory changes were visualized as lateral (R-LAT and L-LAT), superior (SUP), anterior (ANT), and posterior (POST) images of three-dimensional images (family-wise correction error (FWE) p<0.05). Sagittal images (R-MED and L-MED) were obtained with SPM 8 (FWE p<0.05).
ERP and ERF
The P300 neural evoked response was obtained by applying phase-lock averaging to MEG and EEG data, and we evaluated the P300 amplitude and latency.
Sensor-Space Time-Frequency Representations
To reveal the time and frequency characteristics of the magnetic field data, time frequency representations on each channel were performed by Fourier transpose with a time window of 500 msec, time shift of 75% overlap, and Hanning window. ERD and ERS were described by time-frequency maps divided by a spectrum of the baseline state, which was selected in time intervals of 500 msec before stimuli, so that the final data have values that represent ERS by more than one and ERD by less than one. To confirm time-frequency aspects topographically, time-frequency maps of all of channels were displayed. Time-frequency representations were performed to both power and phase-locking factor.
Source Reconstruction Using Dual-State Adaptive Spatial Filtering
Dual-state adaptive spatial filtering is an approach to source reconstruction that can estimate neuromagnetic activities with high spatial resolution by forming a linear combination of sensors that suppresses the signals from environmental noise or other brain areas without attenuating the power from the target voxel, and which is optimized for time-frequency source reconstructions from MEG/EEG data [46-49]. The adaptive spatial filtering using a single spherical volume conductor model based on the individual MR image was obtained as follows. We defined the magnetic field measured by the m-th sensor at time t as bm(t), and a set of measured data as a column vector b(t) = [b1(t),b2(t),...,bM(t)]T where M is the total number of sensors and superscript T indicates the matrix transpose. The covariance matrix of the measurement was denoted
where
indicates the ensemble average over trials. We assumed that the sensor data arise from elemental dipoles at each spatial location r, represented by a three-dimensional vector such that r = [rx,ry,rz]T. The orientation of each source was defined as the vector d(r) = [dx,dy,dz]T, where dx, dy, and dz are the angles between the moment vector of the source and the x-, y-, and z-axes, respectively. We defined
as the output of the m-th sensor that would be induced by a unit-magnitude source located at r and pointing in the ζ direction. The column vector lζ(r) was defined as
The lead field matrix, which represents the sensitivity of the whole sensor array at r, was defined as L(r) ≡ [lx(r),ly(r),lz(r)]. The lead field vector for a unit-dipole oriented in the direction d was defined as l(r), where l(r) ≡ l(r)d(r).
An adaptive spatial filter estimate of the source moment is given by
,
where w(r) is the weight vector. The weight vector w(r) of an adaptive spatial filter called the array-gain constraint minimum variance scalar beamformer is calculated by minimizing wT(r)Rw(r) subject to
The solution is known to be [46]:
where is the normalized lead-field vector defined as . An optimal orientation dopt(r) was determined by computing the solution that maximizes output SNR with respect to d [45, 47]. The estimated source power can be computed from the weights w(r) and the covariance .
With a dual-state paradigm, such as those involving power changes on oscillatory activities, one is interested in the change in power from a baseline time period to an active time period. These periods are denoted as vectors of time samples, tbase and tact, respectively. In this case:
where Rbase is the covariance of the baseline period and Ract is the covariance of the active period. To improve numerical stability, dopt(r) and w(r) are computed using the average covariance of the active and baseline period, i.e., substituting R = (Rbase + Ract) / 2. Note that tbase must be the same length as tact. The contrast between and can then be expressed as an F-ratio [dB] [49]:
Basic brain rhythms, event-related (de)synchronization (ERD/ERS), change their signal power due to brain activation. ERD and ERS are decreases and increases in oscillatory power, respectively, and are denoted as negative/positive F-ratio values.
Group Analysis
The significance of activations across subjects was tested with statistical non-parametric mapping (SnPM) (http://www.sph.umich.edu/ni-stat/SnPM/). The functional images were normalized to template brain images created by the Montreal Neurological Institute (MNI) template (in SPM; Wellcome Department of Imaging Neuroscience, London, UK). The paired t-test between patients and controls corresponding to target stimuli was performed using a nonparametric pseudo-t statistic incorporating variance smoothing with a Gaussian kernel (full width at half maximum) of 20 mm. Voxels with differences at p<0.05 (FWE) were considered statistically significant. Three-dimensional images were made on the MNI template brain using MRIcroGL (http://www.cabiatl.com/mricrogl/).
RESULTS
The P300 neural evoked potential component during the auditory oddball task was obtained by EEG, and ERP was obtained by MEG. ERP in MEG in patients with schizophrenia had smaller amplitude and greater latency than in control subjects, showing the same tendency as those in EEG (Table 1). No significant correlation was found between PANS and MEG and EEG findings.
Demographic and Clinical Characteristics of Subjects and Results of Oddball Task in MEG and EEG
| 1-A: Patients with schizophrenia | ||||||||||
|---|---|---|---|---|---|---|---|---|---|---|
| Age (Years) | Sex | Handedness | PANSS | Correct Answer Rate | P300 | MEG | EEG | |||
| Positive | Nagative | G | Time(ms) | amp(fT) | amp(mV) | |||||
| 1 | 37 | M | R | 18 | 33 | 47 | 92.2% | 360 | 394.23 | -0.112 |
| 2 | 35 | M | R | 15 | 27 | 39 | 100.0% | 364 | 143.23 | -0.012 |
| 3 | 28 | M | R | 24 | 28 | 67 | 100.0% | 458 | 213.66 | -0.129 |
| 4 | 35 | M | R | 27 | 35 | 75 | 83.7% | 376 | 275.83 | -0.083 |
| 5 | 22 | M | R | 15 | 21 | 33 | 98.5% | 334 | 257.81 | -0.322 |
| 6 | 27 | M | R | 18 | 20 | 27 | 92.2% | 350 | 180.29 | -0.316 |
| 7 | 34 | M | R | 20 | 28 | 52 | 95.9% | 333 | 396.63 | -0.140 |
| 8 | 32 | M | R | 20 | 25 | 37 | 100.0% | 275 | 138.46 | -0.139 |
| 9 | 34 | M | R | 11 | 19 | 26 | 100.0% | 328 | 243.46 | -0.143 |
| 10 | 25 | M | R | 21 | 29 | 42 | 86.8% | 543 | 150 | -0.054 |
| Mean | 30.9 | 94.9% | 372.1 | 239.360 | -0.145 | |||||
| SD | 5.0 | 0.06 | 75.8 | 95.43 | 0.10 | |||||
| 1-B: Controls | ||||||||
|---|---|---|---|---|---|---|---|---|
| Age (Years) | Sex | Handedness | Correct Answer Rate | P300 | MEG | EEG | ||
| Time(ms) | amp(fT) | amp(mV) | ||||||
| 1 | 38 | M | R | 98.2% | 342 | 365.18 | -0.334 | |
| 2 | 22 | M | R | 98.2% | 351 | 250 | -0.220 | |
| 3 | 28 | M | R | 98.3% | 320 | 238.22 | -0.150 | |
| 4 | 25 | M | R | 96.5% | 375 | 119.37 | -0.103 | |
| 5 | 27 | M | R | 95.9% | 287 | 231.68 | -0.155 | |
| 6 | 25 | M | R | 97.0% | 367 | 219.9 | -0.217 | |
| 7 | 31 | M | R | 98.5% | 319 | 184.55 | -0.243 | |
| 8 | 28 | M | R | 98.5% | 369 | 259.16 | -0.193 | |
| 9 | 33 | M | R | 95.6% | 298 | 268.78 | -0.181 | |
| 10 | 28 | M | R | 98.5% | 363 | 314.14 | -0.260 | |
| Mean | 28.5 | 97.5% | 339.1 | 245.098 | -0.206 | |||
| SD | 4.6 | 0.01 | 31.4 | 66.920 | 0.065 | |||
Functional maps in event-related magnetic field (ERF) during the oddball task showed significant differences in theta, alpha, and beta bands between patients with schizophrenia and control subjects. In the 104 channel, which we arbitrarily chose as an example of the 160 channels (Fig. 1A), a grand average of the time frequency map during the odd ball task showed that beta ERD was increased in patients compared to control groups. However, the grand average of time frequency map at phase-lock during the odd ball task in channel 104 showed that power was not found in either patients or control groups (Fig. 1B, 1C, Fig. 2A, 2B).
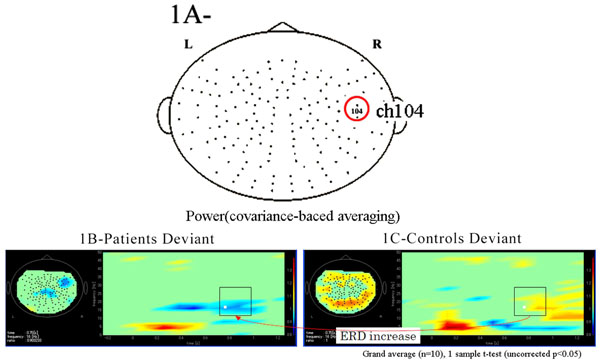
(A) We arbitrarily chose the 104 channel as an example from 160 channels. (B). Grand average of time frequency map of schizophrenic patient group (n=10) during the odd ball task in channel 104. (C). Grand average of time frequency map of control group (n=10) during the odd ball task in channel 104. Beta ERD was increased in patients group compared to controls during the odd ball task.
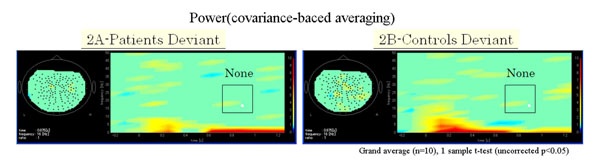
(A) Grand average of time frequency map of schizophrenic patient group (n=10) at phase-lock during the odd ball task in channel 104. (B) Grand average of time frequency map of control group (n=10) at phase-lock during the odd ball task in channel 104. Power was not found at phase-lock in all frequencies compared to at no phase-lock, as shown Figs. (1B and 1C) in both patient and control groups.
ERS power in the theta band (4–8 Hz) during the oddball task in patients was significantly increased in the left temporal pole regions at 250–500 ms, compared to controls at FWE (p<0.05)(Fig. 3A). Theta ERS power at 500–750 ms in patients was significantly increased in midline frontal and anterior portions of anterior cingulate cortex regions in both hemispheres, and the left portion of lateral temporal regions (FWE p<0.05)(Fig. 3B). ERS power in the lower alpha band (8–10 Hz) in patients was significantly decreased in the right occipital region at 500–750ms (Fig. 4A), and in the right midline parietal and left occipital regions at 750–1000 ms (Fig. 4B). ERS power in the upper alpha band (10–13 Hz) at 750–1000 ms in patients was significantly decreased in the right midline parietal and left occipital regions (FWE p<0.05) (Fig. 4C). ERS power in the beta band (13–30 Hz) in patients was significantly decreased in the right occipital region at 500–750ms (Fig. 5A), and in the region from the right frontal to temporal and right anterior portion of anterior cingulate cortex at 750–1000ms (Fig. 5B). Beta ERD power in patients was significantly increased in the right temporal pole and parietal regions, and small upper portions of the bilateral parietal and midline parietal regions at 750–1000 ms, compared to the control group (FWE p<0.05) (Fig 5C).
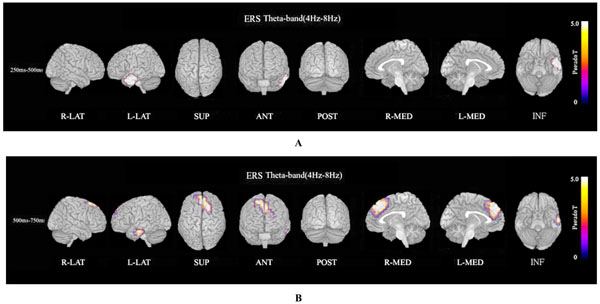
Theta ERS. (A). Functional maps of ERS power in the theta band (4–8 Hz) during the oddball task show statistical differences between patients with schizophrenia and normal controls. Theta ERS at 250–500 ms in patients was significantly increased in the left temporal pole during oddball task (FWE p<0.05). (B). Theta (4–8 Hz) ERS power at 500–750ms in patients was significantly increased in midline frontal and anterior portion of anterior cingulate cortex regions in both hemispheres, and left portion of lateral temporal regions during the oddball task (FWE p<0.05).
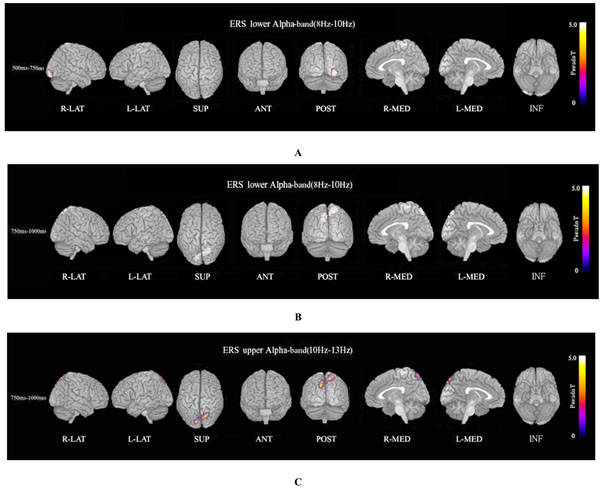
Alpha ERS. (A) Lower alpha (8–10 Hz) ERS power at 500–750ms in patients was significantly decreased in the right occipital region during the oddball task (FWE p<0.05). (B) Lower alpha (8–10 Hz) ERS power at 750–1000 ms in patients was significantly decreased in the right midline parietal and bilateral occipital regions during the oddball task (FWE p<0.05). (C) Upper alpha (10–13 Hz) ERS power at 750–1000ms in patients was significantly decreased in the right midline parietal and left occipital regions during the oddball task (FWE p<0.05).
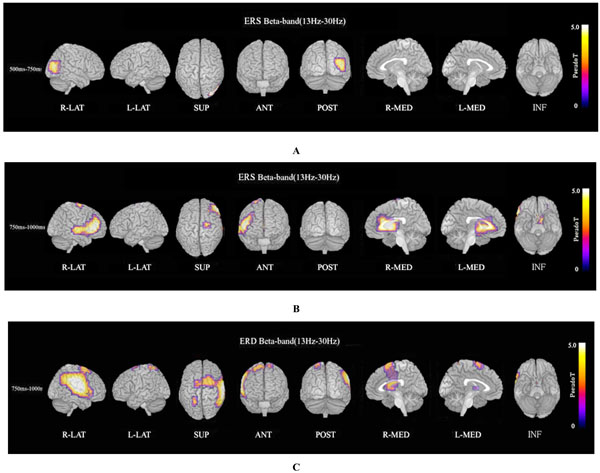
Beta ERS and beta ERD. (A). Beta (13–30 Hz) ERS power at 500–750ms in patients was significantly decreased in the right occipital region during the oddball task (FWE p<0.05). (B). Beta (13–30 Hz) ERS power at 750–1000ms in patients was significantly decreased in the region from right frontal to temporal and right anterior portion of anterior cingulate cortex during the oddball task (FWE p<0.05). (C). Beta ERD power at 750–1000 ms in patients was significantly increased in the right posterior frontal, upper temporal, and parietal region, and small upper portions of bilateral dorsal frontal and dorsal-medial parietal regions, compared to control subjects (FWE p<0.05).
DISCUSSION
In this study we applied a newly developed adaptive spatial filtering algorithm optimized for robust source time-frequency reconstruction from MEG and EEG data [49]. The results showed marked differences in ERD and ERS on MEG between patients with schizophrenia and control subjects during the ordinary auditory oddball task.
Theta Band (4–8 Hz)
The ERS power map in the theta band (4–8 Hz) during the oddball task showed that the patient group response was significantly increased in the left temporal pole at 250–500 ms (Fig. 3A), and was significantly increased in the dorsal and medial frontal and anterior portions of the anterior cingulate cortex in both hemispheres, and the left-hand portion of lateral temporal regions at 500–750 ms, compared to the control group (Fig. 3B). The theta band responds selectively to the encoding of new information related to the hippocampal theta induced in the cortex via hippocampo-cortical feedback loops [36, 51-55]. Significant theta ERS was found during the encoding phase for only those words that could be remembered later and only for correctly recognized targets during the actual recognition phase but not for distractors and unremembered targets [36]. An attentive state during complex task performance and meditative concentration is closely associated with high amplitude theta activity of the frontal midline and anterior cingulate cortex (ACC) [56].
Lower Alpha (8–10 Hz) and Upper Alpha (10–13 Hz) Bands
Lower alpha ERS power in patients was significantly decreased in the right occipital region at 500–750ms (Fig. 4A), and in the right midline parietal and bilateral occipital regions at 750–1000ms (FWE p<0.05) (Fig. 4B). Upper alpha ERS power in patients was significantly decreased in right midline parietal and left occipital regions at 750–1000ms (FWE p<0.05) (Fig. 4C). Recently it was reported that alpha oscillations in the sensorimotor network of monkeys affect discrimination performance by rhythmical inhibition of neural spiking [44]. Decreased ERS in the alpha band may suggest dysfunction in cortical inhibition and discriminating performance by rhythmical inhibition of neural spiking in schizophrenia. Alpha ERD is observed in response to a variety of different types of tasks, and different frequencies of task-related reactivity and topography [57]. Lower (7–10 Hz) and upper (10–13.5 Hz) alpha ERD bands reflect different functions. Lower alpha ERD is topographically widespread over the entire scalp, and its function may be related to general intentional demands; on the other hand, upper ERD is much more topographically restricted and shows a clear relation to semantic processing. Upper alpha ERD has a clear relation to semantic processing demands [36, 39, 51, 53, 54, 57, 58].
Beta Band (13–30 Hz)
Beta ERS power in patients was significantly decreased in the right occipital region at 500–750 ms (Fig. 5A), and in the right frontal to temporal region and right anterior portion of anterior cingulate cortex at 750–1000 ms (FWE p<0.05) (Fig. 5B). Beta ERD power at 750–1000 ms in patients was significantly increased in large right posterior frontal, upper temporal, and parietal regions, and small upper portions of bilateral dorsal frontal and dorsal-medial parietal regions compared to control subjects (FWE p<0.05) (Fig. 5C).
The alpha and beta ERD bands are an electrophysiological correlate of an activated cortical network, preparation for information processing, and increased excitability of cortical neurons. The beta ERD is elicited by preparation, execution, and imagining a motor act [59-61], and mu and central beta activity may be indicative of the activity state of neural networks in the somatosensory cortex [62]. Increased beta activity in patients may be related to dysfunction of a neural network.
Possibility of Classification of Schizophrenia Using MEG
Studies of schizophrenic patients using MEG in a working memory test showed a possibility of classifying schizophrenia by spectro-temporal-spatial MEG patterns [7, 8]. These studies showed that most ERD patterns are extracted in delta, alpha, and beta frequency bands, and these features were located in the left dorso-frontal, occipital, and left fronto-temporal areas, respectively, in the word condition. Compared to these studies, our finding corresponded to ERD patterns as dysfunctions in the dorso-frontal, occipital, and fronto-temporal areas, but did not always correspond to them as to laterality. These differences may be caused by differences between the oddball task and the working memory test. Our study also confirmed a possibility of classification of schizophrenia using measurement of spatiotemporal dynamics of cortical oscillation across brain regions with MEG.
However, all patients were taking antipsychotic medication, and its effects must be considered. It has been reported that increased latency does not appear to be related to medication [63], changes in P300 amplitude do not appear to be affected by antipsychotic medication [32], and attenuation of P300 in the frontal areas is greater in unmedicated than medicated patients and during the first episode of schizophrenia [64]. General slowing EEG frequencies has been reported as a consequence of neuroleptic medication, but differences slow wave activity in patients on and off neuroleptic might be the consequence of medication effect but also the consequence of symptom differences [65]. 5-HT promotes the theta rhythm and facilitates learning [66]. In addition, psychopathological states of schizophrenic patients temporally change due to various treatments, and must sufficiently recover so that the MEG examination can be conducted. Further studies on whether ERD/ERS are affected by antipsychotic medication and mental state are needed.
Theoretical Speculation
A disconnection hypothesis was proposed in which the pathophysiology of schizophrenia is expressed at the level of modulation of associative changes in synaptic efficacy, specifically modulation of plasticity in those brain systems [67-71]. The theoretical mechanism of dysfunction in connectivity in the higher order cognitive task may be associated with disturbance of the local inhibitory local cortical circuit [72] and the subcortical generation system, that is, dysfunction of the thalamo-cortical tract [73]. Although the mechanisms involved in large scale integration are still unknown, the formation of dynamic links may be mediated by synchrony over multiple frequency bands [74]. The “communication-through-coherence” hypothesis showed that oscillations in neural activity are fundamental for modulat-ing, filtering, and routing information in the nervous system [42, 43]. The neuronal communication is mechanically subserved by neuronal coherence, and activated neuronal groups oscillate and undergo rhythmic excitability fluctuations that that produce temporal windows for communication [42, 43]. The alpha oscillations exercise a strong inhibitory influence on both spike timing and firing rate, and thus the pulsed inhibition by alpha oscillation plays an important role in the extended sensorimotor system [44]. Characteristic changes in ERD and ERS power in schizophrenia during the classic oddball task may be caused by dysfunction in a flexible pattern of coherence that defines a flexible communication structure related to synchronization of a large population of neurons.
CONCLUSION
This study demonstrated characteristic changes in ERD and ERS power during the classic oddball task in schizophrenic patients. These changes reflected abnormalities and different modalities in data processing during the oddball task, and suggested that abnormal cognitive and psychopathological functions in schizophrenia are related to disturbances in interaction among active large neuronal groups and their communication with each other.
CONFLICT OF INTEREST
None declared.
ACKNOWLEDGEMENT
None declared.

