All published articles of this journal are available on ScienceDirect.

Extension of Quantifiable Modification of sLORETA for Induced Oscillatory Changes in Magnetoencephalography
Authors Info & Affiliations
Abstract
Quantifiable modification of standardized low-resolution brain electromagnetic tomography (sLORETA-qm), which is one of the non-adaptive beamformer spatial filtering techniques, has been applied to source localization and quantification of evoked field or oscillatory changes in magnetoencephalography (MEG). Here, we extended this technique to induced oscillatory brain activity changes, so-called event-related desynchronization or event-related synchronization. For localizing of significantly activated brain areas at the whole-brain level, permutation tests and multiple comparison corrections with false discovery rate were applied. Induced β- and γ-band oscillatory changes by right hand clenching task were demonstrated as an example of simple induced brain activity.
INTRODUCTION
Conventional equivalent current dipole (ECD) estimation in magnetoencephalography (MEG) has two major disadvantages in the analysis of higher brain function. The first is derived from the principles of ECD estimation. Although in ECD, neuronal activity in the whole brain at a certain time point is represented with one or several points to solve the so-called inverse problem, several different brain areas, not points, are presumed to be activated simultaneously, especially in higher brain function. The spatial filtering technique is a method used to address this problem, and it has been studied extensively. Source reconstruction by spatial filtering techniques can be performed without sensor selection, therefore excluding the arbitrariness of sensor selection.
The other disadvantage is the difficulty in fitting the dipole model for non-phase-locking brain activity induced by the instruction cue. Analysis of the oscillatory change is an alternative method for this disadvantage because the phase of brain activity need not be locked precisely and averaging the data is not always necessary. Neuronal activity by the instruction cue induces a decrease or increase in synchrony of the underlying neuronal populations. These synchronous changes result in decreases or increases of oscillation in specific frequency bands, and these oscillatory changes are called event-related desynchronization (ERD) [1] or event-related synchronization (ERS) [2].
In the present study, visualization of the significant induced oscillatory changes was attempted for the analysis of higher brain function. For statistical evaluation, quantification of the oscillatory changes was mandatory. Therefore, quantifiable modification of standardized low-resolution brain electromagnetic tomography (sLORETA-qm) [3-7], that is one of the non-adaptive spatial filtering technique, was adopted for the analysis. The usefulness of sLOREA-qm with regard to quantification of evoked fields, quantification of interictal epileptic spike, and its applications to the spontaneous oscillatory neuromagnetic activities have been demonstrated previously [5-7]. To our knowledge, this is the first application of sLORETA-qm for induced oscillatory change.
For the simple example of the induced oscillatory change, induced β- and γ-band oscillatory changes by right hand clenching task were demonstrated as an example of simple induced brain activity. That was because β-band ERD [1] and γ-band ERS [2] were reported to be demonstrated on both sides of the sensorimotor cortex [8, 9].
METHODS
Subjects and MEG Measurement Protocol
Ten healthy subjects (all right-handed, 7 male and 3 female, 33.7 ± 8.5 [mean ± SD] years; range, 21 - 49 years) participated in this study. All subjects gave their informed consent, and the study was approved by the Ethics Committee of Osaka City University Hospital.
MEG was performed in a magnetically shielded room at Osaka City University Hospital using a 160-channel gradiometer (MEG vision PQ1160C; Yokogawa Electric Corporation, Tokyo, Japan) with a magnetic field resolution of 4 fT/Hz1/2 in the white noise region. The sensing and reference coils in this system were both 15.5 mm in diameter, with a 50-mm baseline. The subjects were positioned in the supine position with the use of a horizontal-type dewar. MEG data were recorded through a 0.3 - 200 Hz bandpass filter with a sampling rate of 1000 Hz.
Tasks
Right hand clenching task by the visual cue was adopted as an example of simple induced brain activity. A white circle on a black background on a computer screen was used as the cue. This cue was presented for 0.5 s with an interval of 4.5 s, and the subjects were instructed to clench their right hand once at the timing of the cue (Fig. 1). Fifty trials were continuously repeated and recorded.
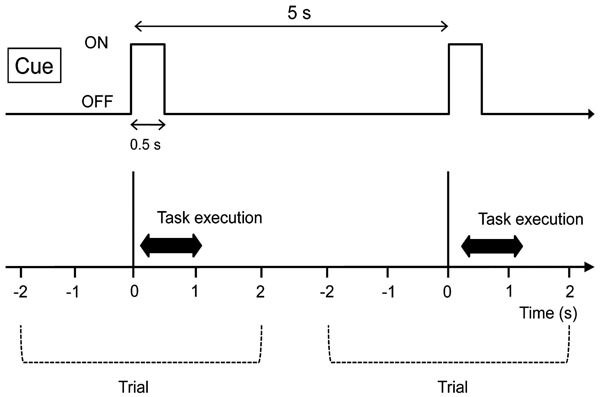
Experimental paradigm. The subjects were instructed to clench their right hand at the timing of the visual cue instruction. This cue was presented for 0.5 s with an interval of 4.5 s. Fifty trials were continuously repeated and recorded.
Data Analysis
1. Preprocessing
To reduce noise caused by the surrounding environment, data from the reference magnetometers, which were located outside the dewar and picked up only environmental noise, were subtracted from the obtained MEG data. Next, regarding the beginning of the visual cue as a trigger, the data were epoched for a period of 4 s between -2 s before and 2 s after the trigger. Trials containing extensive eye movements or body motions were excluded from analysis.
2. Sensor Time-Frequency Analysis
To determine the time, frequency, and topographic characteristics of induced oscillatory changes by the task on the magnetic field level, time-frequency analysis on each channel was performed by Fourier transformation with a time window of 0.5 s, time shift of 75% overlap, and the Hanning window. After averaging the time-frequency maps of all trials, the baseline state was selected as a time interval of 0.5 s before the trigger. The power of oscillatory change was described as the amplitude compared with the baseline state. If this amplitude ratio was less than 1 at some specific time and frequency, it was regarded as ERD; otherwise, if the ratio was more than 1, it was regarded as ERS. From the results of this analysis, the existence of induced oscillatory changes in β-band (15 - 30 Hz) or γ-band (60 - 80 Hz) in the frontoparietal region was confirmed. Next, the adequate time range needed for further source analysis in each subject was determined referring to the results of channels located at the frontoparietal region.
3. Source Analysis (Location of the Peak Distribution of ERD/ERS and its Quantification)
To obtain the quantitative and statistically-significant ERD/ERS source image, we extend sLORETA-qm technique [6] to induced activities, and apply statistical evaluation based on a permutation test and correction of multiple comparisons.
Quantitative Multiple-Source Estimation Based on sLORETA-qm
We defined the magnetic field measured by the m-th sensor at time t as bm(t), and a set of measured data as a column vector:
b(t)=[b1(t),b2(t),...,bNC(t)]T
where NC is the total number of sensors and T indicates the matrix transpose. We defined the lead field vector from the i-th voxel to all sensors as Ii of NC × 1 vector, and the composite lead field matrix for all voxels as
L = [I1, I2, …, Ii ,… INi] (NC × NV matrix)
where NV is the total number of voxels set in the brain area.
Using sLORETA, the estimated source on the i-th voxel is expressed as
where G is the gram matrix, defined as G = LLT [4].
Although sLORETA has almost no localization bias, it has point spread function [3], and thus false-positive sources can be estimated around the actual source localization. As a result, we regarded the voxel with a spatially or locally maximum among adjacent voxels as the most reliable information for source estimation. From these perspectives, after source reconstruction by sLORETA, a voxel with spatially or locally maximum at each time point was chosen as a feasible source and used for further analyses.
To quantify current density estimated by sLORETA, we assumed the actual single source to be on the k-th voxel and the lead field from to sensors to be equal to Ik. Under these conditions, sensor signals from are expressed as
Substituting Eq. (2) into Eq. (1), we obtain:
With regard to the voxel with spatially or locally maximum, the i-th voxel is considered to be close to the k-th voxel. Hence, Eq. (3) is expressed as
As G is constant after definition of brain area and lk decreases in proportion to square of the distance between the source and sensors, Eq. (4) indicates that the deeper the location of the estimated sources, the smaller the current density that can be estimated as compared with the actual current density. We therefore quantified current density using the following equation to correct such errors:
where is a quantitative value of .
In cases involving multiple sources, Eq. (2) is described as
where NS is the number of actual sources, is the actual source on kj voxel and is the lead field vector from to sensors.
In the same manner as the derivation of Eq. (4), estimated sources are expressed as
where are estimated sources at -th voxels. Finally, we can obtain quantified current density using the following equation:
where represent the quantitative current density of .
The following steps are performed on sLORETA-qm:
- After the data were separately bandpass filtered in β-band or γ-band, the sLORETA-qm technique was performed for a certain time range. In this step, the lead field vector and matrix were calculated with a spherical model fit to the brain area of each subject. The center of the spherical model was determined as the mid point between anterior commissure and posterior commissure. The brain area in the spherical model was divided into approximately 2000 voxels with 10 × 10 × 10 mm3. The actual count of voxels depends on the head size of each subject. MEG data from all sensors were used for this calculation, thus avoiding arbitrary sensor selection.
- The sLORETA-qm technique was performed on the results of the previous step. That is, voxels with spatially or locally maximum at each time point were selected and transformed using Eq. (8) to obtain quantitative values. In this step, voxels in areas without effect from brain activities, such as in the vicinity of eyes, were excluded. This operation can be performed automatically by referring to the spherical model of each subject.
- Finally, calculated current density [nAm/mm2] for each voxel was averaged to the selected time interval and images of time-averaged sources were super-imposed on individual images from MRI.
Extension of sLORETA-qm Technique to Induced Oscillatory Changes
Next, the sLORETA-qm technique was extended to the induced oscillatory changes. Induced activities were considered as the current intensity variation in two states, i.e., baseline (resting) and active (task-related) states. From the results of sensor time-frequency analysis, the active state was determined to be the time range of β-band ERD or γ-band ERS appearing after the trigger, while the baseline state was determined to be that before the trigger with the same time range in each subject. With the sLORETA-qm technique, “Baseline Source Image” and “Active Source Image” were obtained in each trial (Fig. 2). Next, the “Differential Source Image” was obtained by subtracting the current intensity of the baseline source image from that of the active source image. This “Differential Source Image” was considered to be a source image of the oscillatory changes in each trial. In this process, the source image of oscillatory changes in each trial as well as the quantities in each voxel could be obtained. Next, “Differential Source Images” from all trials were averaged, and this image was designated as the “Original Image” (Fig. 3a).
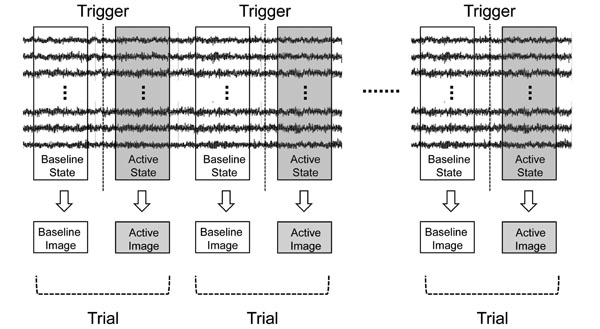
Basic concepts of applying sLORETA-qm to induced activities. Induced activities were considered as the current intensity variation of two states, i.e., baseline (resting) and active (task-related) state. The active state was determined to be the time range of β-band ERD or γ- band ERS appearing after the trigger, while the baseline state was determined to be that before the trigger with the same time range in each subject. Source images were reconstructed for two states in each trial by the sLORETA-qm technique.
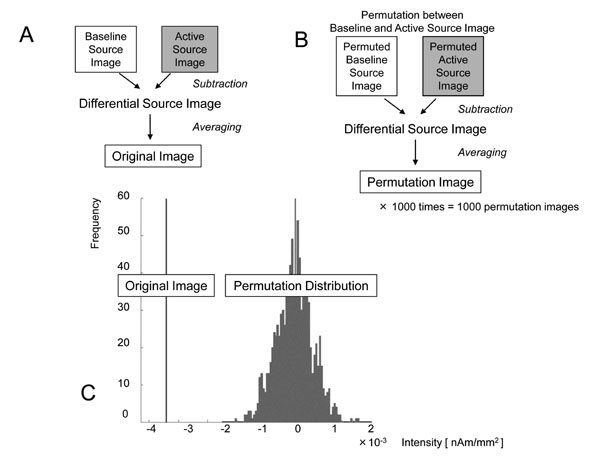
Processing to determine the locations and quantities of statistically significant ERD/ERS. a: The “Differential Source Image” was obtained by subtracting the “Baseline Source Image” from the “Active Source Image” in each trial. By averaging all “Differential Source Images,” the “Original Image” was obtained and the decrease or increase in current intensity in each voxel was considered to be the quantity of the oscillatory change. b: All “Baseline Source Images” and “Active Source Images” were permuted randomly, and “Permuted Baseline Source Images” and “Permuted Active Source Images” were obtained. By subtracting between them and averaging, the “Permutation Image,” with quantities in each voxel, was obtained. This permutation process was repeated 1000 times and the distribution of quantities in these 1000 permutation images was obtained in each voxel. c: By comparing the quantities in the “Original Image” with those in the permutation distribution, the one-tailed probability P-values were obtained in each voxel. For example, the quantity was -3.62×10⁻³ [nAm/mm2] and the uncorrected P-value was 0.016 in this voxel. After applying the multiple comparison correction with false discovery rate, the corrected P-value was 0.038. ERD in this voxel was considered to be significant.
Statistical Evaluation of the Spatial Filter Output
As the original source image obtained in the previous step could have contained unexpected artifacts and less repeatable components, statistical evaluation of the spatial filter output was needed. In the present study, a random permutation test with the null hypothesis was applied for statistical evaluation [10, 11].
All baseline and active images were permuted randomly, and “Permuted Baseline Source Image” and “Permuted Active Source Images” were obtained. By subtracting them and averaging, a “Permutation Image” with quantities in each voxel was obtained (Fig. 3b). This permutation process was repeated 1000 times and the distribution of quantities in these 1000 “Permutation Images” was obtained in each voxel. By comparing the quantities in the “Original image” with that in permutation distribution, the one-tailed probability P-values were obtained in each voxel. One example of permutation test for β-band ERD in the voxel near the contralateral primary motor cortex (M1) in subject 1 was demonstrated (Fig. 3c). In this voxel, the quantity was -3.62×10⁻³ [nAm/mm2] and the uncorrected P-value was 0.016.
Next, multiple comparison correction was conducted to identify the activated voxel at the whole-brain level. In the present study, a procedure was adopted based on the false discovery rate (FDR) [12]. In the voxel noted above, the corrected P-value was 0.038. The significance level was defined as corrected P < 0.05 and ERD in this voxel was considered to be significant.
Using these two statistical steps, permutation test and correction of multiple comparisons with FDR, a statistically significant source image was obtained.
Evaluation
The locations of the significant oscillatory changes in β-band ERD and γ-band ERS were spatially compared with bilateral M1. Individual M1 were detected with MRI referring to the precentral knob sign [13]. In the case of significant oscillatory changes that were located within 20 mm of the precentral knob sign, these oscillatory changes were considered to be the activation of M1, and the quantities of the local maximum were evaluated within and between subjects.
RESULTS
Distances from M1 and the quantities of the oscillatory changes are shown in Table 1. With the exception of 2 subjects (subjects 8 and 10), bilateral M1 activations were recognized in both β-band ERD and γ-band ERS. The oscillatory changes had various quantities, but they consisted of the same order of magnitude (ranging from -0.94 to -7.47×10⁻³ nAm/mm2 in β-band ERD, and 0.91 to 6.71×10⁻⁴ nAm/mm2 in γ-band ERS). Although the quantities of the oscillatory changes were greater or almost the same on the contralateral M1 in most cases (6 subjects on β-band ERD and 8 subjects on γ-band ERS), there were some subjects in whom the quantities were higher on the ipsilateral M1 (3 subjects on β-band ERD and 1 subject on γ-band ERS).
Distances from M1 and the Quantities of the Oscillatory Changes
| No. | Age, Sex | Contralateral Side | Ipsilateral Side | ||||||
|---|---|---|---|---|---|---|---|---|---|
| β-ERD | γ-ERS | β-ERD | γ-ERS | ||||||
| Distance from M1 [mm] | Intensity ×10-3 [nAm/mm2] | Distance from M1 [mm] | Intensity ×10-4 [nAm/mm2] | Distance from M1 [mm] | Intensity ×10-3 [nAm/mm2] | Distance from M1 [mm] | Intensity ×10-4 [nAm/mm2] | ||
| 1 | 22, M | 8.23 | -3.62 | 17.47 | 1.28 | 8.42 | -1.48 | 12.27 | 0.91 |
| 2 | 37, M | 3.06 | -1.86 | 19.43 | 3.82 | 7.91 | -1.52 | 17.89 | 1.24 |
| 3 | 33, F | 14.17 | -7.47 | 18.28 | 1.84 | 8.66 | -3.81 | 13.77 | 1.30 |
| 4 | 39, F | 15.22 | -2.08 | 4.96 | 2.88 | 11.58 | -4.30 | 16.90 | 2.35 |
| 5 | 30, M | 4.13 | -2.48 | 6.95 | 5.80 | 15.80 | -2.45 | 10.45 | 2.86 |
| 6 | 41, M | 14.40 | -2.59 | 4.34 | 3.35 | 16.83 | -2.52 | 19.53 | 1.83 |
| 7 | 30, F | 17.96 | -1.53 | 11.40 | 3.79 | 10.61 | -2.34 | 5.58 | 2.21 |
| 8 | 49, M | 6.36 | -1.68 | 8.56 | 1.85 | 1.99 | -1.26 | nd | |
| 9 | 35, M | 19.00 | -0.94 | 19.00 | 2.12 | 9.78 | -4.00 | 3.53 | 6.71 |
| 10 | 21, M | 18.75 | -0.98 | 11.46 | 2.64 | nd | 10.40 | 1.61 | |
M, male; F, female; ERD, event-related desynchronization; ERS, event-related synchronization; M1, primary motor area; nd, not detected.
Representative Case (Subject 1)
From the results of sensor time frequency analysis, the time range from 0.2 to 0.5 s was determined to be the active state of β-band (15 - 30 Hz) and from 0.25 to 0.55 s was determined to be the active state of γ-band (60 - 80 Hz). The baseline state was determined to be from -0.5 to -0.2 for β-band and from -0.55 to -0.25 for γ-band. With the sLORETA-qm technique, the original β-band and γ-band images were obtained separately. After applying a permutation test and multiple comparison correction, statistically significant source images were obtained and superimposed on MRI (Fig. 4). In this subject, bilateral high frontal cortices were demonstrated as areas with emergence of significant ERD (Fig. 4A) and ERS (Fig. 4B) in performing the task. The quantities of ERD were -3.62×10⁻³ [nAm/mm2] on the contralateral side and -1.48×10⁻³ [nAm/mm2] on the ipsilateral side. In ERS, the quantities were 1.28×10⁻⁴ [nAm/mm2] on the contralateral side and 0.91×10⁻⁴ [nAm/mm2] on the ipsilateral side.
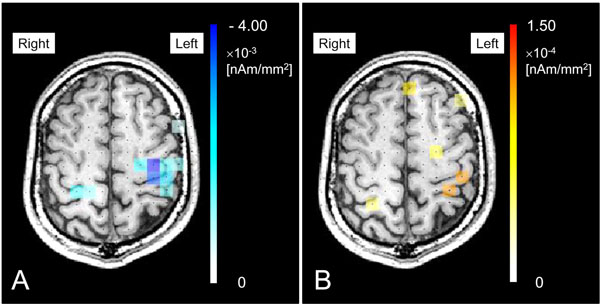
Statistically significant source images were obtained and superimposed on MRI. In this subject, bilateral high frontal cortices were demonstrated as areas with emergence of significant ERD (A) and ERS (B) in performing the task. The quantities of ERD were -3.62×10⁻³ [nAm/mm2] on the contralateral side and -1.48×10⁻³ [nAm/mm2] on the ipsilateral side. In ERS, the quantities were 1.28×10⁻⁴ [nAm/mm2] on the contralateral side and 0.91×10⁻⁴ [nAm/mm2] on the ipsilateral side.
DISCUSSION
In the present study, we utilized sLORETA-qm technique. In this approach, the source reconstruction was performed by sLORETA at each time point as a first step. Subsequently, a voxel with a spatially maximum or local maximum intensity at each time point was chosen as a peak source. Finally, on the voxel chosen as the peak source, the quantified source intensity was estimated by correcting the lead-field component.
In the point of obtaining the absolute quantitative value, this technique is different from other spatial filtering techniques in previous reports [9, 14, 15].
In the presented method, resting baseline and task-related active states were separately analyzed with sLORETA-qm. Then, differential images between the two states were obtained in each trial. Source images of the oscillatory changes were obtained by averaging differential images in all trials. For localizing significant oscillatory changes at the whole-brain level, a permutation test [10, 11] and following multiple comparison correction with FDR [12] were applied. The spatial filter output is not always distributed with normal probability because the probability of source image is generally unknown. This was because the random permutation test with null hypothesis was applied in the present study. This method is based on nonparametric statistics in which the probability distribution at each voxel is determined from the data, and a priori assumption of Gaussianity is not needed. The FDR is the ratio of the number of voxels that are truly inactive but discovered to be active to the total number of voxels discovered to be active. This correction procedure guarantees the expectation of false discovery rate to be less than a user-specified significance level.
As an example of this analytical method, induced β- and γ-band oscillatory changes by right hand clenching were evaluated with this analytical method in 10 healthy subjects. With the exception of 2 subjects, β-band ERD and γ-band ERS at bilateral primary motor cortices were recognized and quantified.
In the present study, ipsilateral M1 was also identified as a significantly activated area. Although the quantities of the oscillatory changes were higher or almost the same on the contralateral M1 in most cases, there were some subjects in whom the quantities were higher on the ipsilateral M1. This ipsilateral movement-related activity was reported previously in EEG and MEG, and was considered to be due to the processing of somatosensory reafferences supplied by double crossed and uncrossed pathways [16-18]. The results of the present study also supported these ipsilateral involvements in voluntary movement.
In future studies, other higher brain functions should be analyzed with this method for evaluating activated areas with significance. Furthermore, whether these quantities are correlated with other neurophysiological indices, such as the power of performing tasks, or other psychological indices, such as attention or fatigue, must be evaluated.
CONCLUSION
We extended sLORETA-qm for induced oscillatory changes in MEG. With the present proposed analytical method, the locations and quantities of statistically significant oscillatory changes were obtained.
CONFLICT OF INTEREST
None declared.
ACKNOWLEDGEMENT
None declared.

