All published articles of this journal are available on ScienceDirect.

A Three-dimensional Deformable Brain Atlas for DBS Targeting. I. Methodology for Atlas Creation and Artifact Reduction
Authors Info & Affiliations
Abstract
Background:
Targeting in deep brain stimulation (DBS) relies heavily on the ability to accurately localize particular anatomic brain structures. Direct targeting of subcortical structures has been limited by the ability to visualize relevant DBS targets.
Methods and Results:
In this work, we describe the development and implementation, of a methodology utilized to create a three dimensional deformable atlas for DBS surgery. This atlas was designed to correspond to the print version of the Schaltenbrand-Bailey atlas structural contours. We employed a smoothing technique to reduce artifacts inherent in the print version.
Conclusions:
We present the methodology used to create a three dimensional patient specific DBS atlas which may in the future be tested for clinical utility.
BACKGROUND
Deep brain stimulation (DBS) has revolutionized the treatment of movement and certain neuropsychiatric disorders and recently has been investigated for novel applications such as obesity, cluster headache, depression, Tourette syndrome, and epilepsy. The efficacy of DBS is largely contingent upon the ability to precisely target specific brain structures. This type of highly specific targeting is usually achieved using stereotactic neurosurgery, and a 3-D Cartesian coordinate system that together can precisely localize brain structures. Initially, a vacuum in quality brain imaging, the field of stereotaxis initially relied heavily on histological brain atlases and physiology.
Many standard print brain atlases have emerged over the past century [1-5] including most prominently in DBS, the Schaltenbrand-Wahren [4] and the Schaltenbrand-Bailey [3] atlases. These texts have commonly been utilized to supplement microelectrode recording in order to facilitate target refinement in DBS, and lesion based procedures. Despite the development of high-resolution imaging, atlases have continued to play a critical role in DBS surgery especially since the targets of interest (usually basal ganglia structures) typically appear below the threshold for very accurate contrast resolution [6].
Atlases help clinicians supplement their implicit knowledge of a structure’s location with an explicit contour. Clinically, this knowledge may be key to proper surgical guidance. The transition of standard print atlases, that clinicians have been trained with, to a deformable digital atlas is an important one that is not trivial. If a new digital atlas is created from a print atlas, it is important for this atlas to accurately represent the print atlas, limit or remove inherent artifacts in the original atlas, and be aligned with the patient’s anatomy. In this paper, we describe the methodology employed at our center to accomplish those goals through the digitization of the Schaltenbrand-Bailey atlas [3], and we detail the steps necessary to create a smoothed deformable three-dimensional atlas for subcortical structure targeting. The process of image digitization, contour extraction, tetrahedrization (to develop a surface), and smoothing of the surface will be described towards the development of our atlas.
MATERIALS AND METHODS
Atlas Digitization and Interpolation
The first step in the methodology was to scan photographs of each atlas slice for computer processing. Atlas slices in the sagittal plane were used. A high quality scanner (EpsonTM Expression 1600) was employed to produce TIFF image files. The scanner resolution was set to 600 dots per inch resulting in a resolution of 23.6 pixels/mm, scans of the photographs were later converted to high quality JPEG images. While the resolution of the scans may limit the accuracy of the depiction of the atlas structures, there are a number of other considerations that will practically limit its accuracy such as: overall print atlas 3D consistency (slice to slice consistency) [7], voxel resolution of the final reconstructed atlas (discussed in later sections), and size of the smallest feature to be modeled in the print atlas. While subcortical structures tend to be small, all were larger than around 2 mm along its most narrow axis. The resolution chosen for modeling of the structures within the digital atlas were therefore based off the size of the smallest relevant feature within these structures. The smallest features that we chose to model were about 1mm in size (about the width of the lamina within the globus pallidus interna) which would require a voxelized atlas with voxels of 0.5 mm or less (in each dimension).
Each section had a predefined coordinate system based on the anterior commissure and posterior commissure. For sagittal sections, each section had a set of predefined axes. The horizontal axis defined the commissural line, while the vertical axis defined the mid-commissural plane. When the sections with corresponding contours were physically scanned, the resulting images were not consistently straight or centered. To correlate these contours with each slice (through the coordinate system), it was necessary to reorient each scanned image. This reorientation required that the origin be defined as the intersection of the axes, and that the horizontal and vertical axes were rotated for proper alignment. A program was created that would read the image files and allow for selection of the origin, and selection of the furthest left and furthest right points on the horizontal axis. The horizontal axis was translated and rotated such that the horizontal axis was straight. The center of the image’s matrix was then defined as the origin, and the horizontal line was aligned along a single row on the image matrix. The required translation and rotation was calculated and a new centered and reoriented image was then saved to an updated image file.
Once each image was scanned and properly reoriented, the structures of interest were extracted. For example, the subthalamic nucleus (STN) would be extracted from each slice in the sagittal plane. Since each structure in each plane was defined by a contour, and there were many structures in each plane. The structures of interest had to be manually extracted from structures found in its surroundings. Each file was read into Adobe PhotoshopTM (San Jose, CA), and the structure of interest was identified and its contour selected and all other undesirable objects removed from the binary image. This method created an image that ultimately included only the contour of the structure of interest. The resulting image was saved as an updated file. Matlab™ (Nantick, MA) was used to contour each structure for each plane, and the resulting set of points was stored in a matrix that was indexed by the corresponding plane.
The set of points along one contour were connected to the set of points along the neighboring contour(s). In 2-D, this process would involve connecting points with a series of triangles in a method referred to as triangulation. A generalization of this method to 3-D is tetrahedization. Delaunay tetrahedization [8] was used to determine the set of lines that connect a point to its natural neighbors. Applying this algorithm across the set of contours of a structure results in a linearly interpolated surface. The surfaces of these structures typically are composed of a complex geometry and thus require a robust method for surface interpolation. Other groups have solved this problem with differing techniques and variable results [9-11], involving either linear or non-linear interpolation. For the interpolation of the surface and volume of the anatomic structure of interest we employed a linear interpolation method. Even though our atlas surfaces were based off of a linear interpolation method since we employ smoothing in a later step of our atlas creation process, the resulting atlas structures had a surface that was not as linear as the initially created surface. In general, higher order (non-linear) models are preferred to linear methods for data modeling. However in the special case of modeling print atlas data, there are known inconsistencies in the 3D spatial alignment of the atlas slices [7, 12, 13]. As such, the accurate creation of a surface to fit the print atlas slices may not be as important of an issue as the ability to reduce the effect of inconsistencies in the digital atlas which was accomplished in this work through smoothing.
The smoothing algorithm was implemented by convolving the data with a kernel. Two different kernels were utilized; the kernel used for all small to medium sized structures was a Gaussian kernel with a standard deviation of 0.5 mm. The kernel used for large sized structures (only striatum and thalamus) was a Gaussian kernel with a standard deviation of 0.25 mm. Since these structures are binary prior to smoothing, smoothing essentially operates upon the surface. As the larger structures have greater surface areas, less smoothing was necessary to achieve a similar effect. Upon smoothing, the mesh was no longer purely composed of binary intensities and a new surface was thus determined from an isosurface of an appropriate value. The smoothing created a surface that was no longer a simple linear interpolation of the initial data and was also able to reject some of artifacts in the data.
In Fig. (1A), we present an example of a triangulated surface which lacks smoothing and possesses edges that are not differentially continuous. Therefore, we subsequently smoothed the surfaces by first voxelizing the data and then convolving with a smoothing kernel. The smoothed surface of this figure lacks rough edges and may produce a more reasonable reconstruction (Fig. 1B). This process first requires a mesh of the structure of interest, a mesh with voxels of 0.25 mm3 were used. This voxel size roughly corresponds to 1/3 to 1/4 of the size of the smallest feature of any anatomical structure of interest. The individual voxels were created to possess binary intensity (prior to smoothing) and thus the intensity was set as 1 for a voxel that corresponded to the inside of a structure, and 0 for a voxel that corresponded to the outside region of a structure (Fig. 2A).
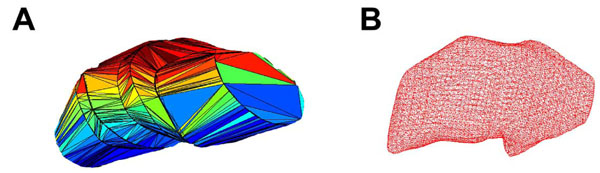
Surfaces of STN reconstructed from sagittal data by tessellation of contours. Panel A is a polyhedral representation of the surface of STN, and B is a wire mesh representation following smoothing.
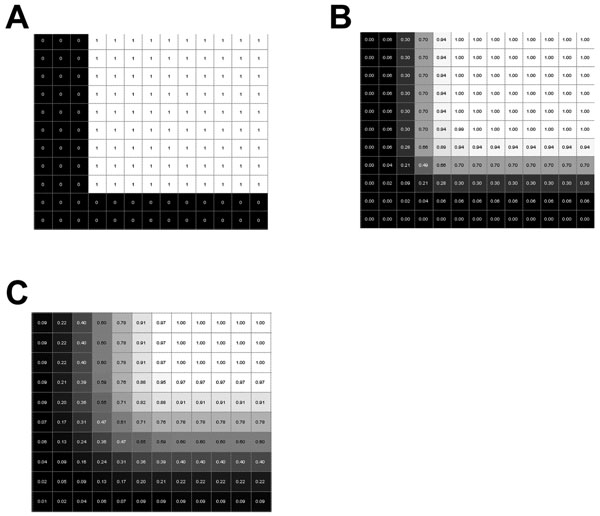
A portion of a middle cross-section of intensity data from a 49x49x49 voxel cube. Panel A is without any smoothing and is a binary image. Panels B and C were smoothed with a Gaussian kernel with a standard deviation of one voxel and two voxels, respectively.
One of the issues with Delaunay tetrahedrization is the inherent inability to correctly interpolate concave objects. The determination of lines that connect the points of two convex contours to create a surface is a relatively simple process using tetrahedrization. However, if one of these surfaces is concave, there is ambiguity in how the points of the objects connect. The solution we employed was to consider each concavity within a convex structure as a series of convex objects. We then simply subtracted out the portion of the object necessary to recreate the original concave object. This process of creating structures from the union or elimination of convex sub-pieces was repeated across all subcortical structures that were modeled. The following atlas structures were created (from anterior most to posterior most): striatum, globus pallidus externa (GPe), anterior commissure (AC), globus pallidus interna (GPi), optic tract (OT), thalamus, zona incerta (ZI), subthalamic nucleus (STN), substantia nigra pars reticulata (SNr), and red nucleus. Five thalamic nuclei were also created using this approach: ventralis oralis anterior (Voa), ventralis oralis posterior (Vop), ventralis intermedius (Vim), ventralis caudalis (Vc), and centromedian (CM).
Intensity Cut-Off Determination
Due to the necessary voxelization of the data, interpolation, and smoothing used to create the digitized three-dimensional atlas, it was not ultimately a perfect representation of the print atlas. The voxelization of the structure can only approximate the data because the smallest feature that could be represented was limited by the size of our voxels (0.25 mm in each direction). In addition, the smoothing process made the binary digital voxelized atlas possess smoother boundaries than the original dataset. Two steps were undertaken to evaluate the digital atlas accuracy versus the print atlas. First, an intensity cut-off value was determined for each structure when the surface was smoothed, since each voxel could range in values between 1 and 0. The atlas was evaluated at various cut off values to determine how accurate the smoothed digitized atlas was compared to the respective planes in the print atlas.
The smoothing used in our methodology convolves the binary matrix of the structure with a Gaussian kernel. The cut-off value used to designate the boundary of a structure was determined using three methods: 1) an initial value was determined from analysis of a test cube, 2) a qualitative evaluation of the effect of the change of the cut-off value using custom in-house print atlas and digital atlas viewing software, and 3) a quantitative analysis of the effect the intensity cut-off value had on the resultant area of the structure. For the initial value determination, a 49x49x49 voxel cube was created and smoothed. Figure 2 shows an edge of a square taken from a middle cross-section of a cube and the effect of smoothing on the structure. For the qualitative evaluation, each atlas slice was displayed over the digitally reconstructed atlas and compared to the corresponding slices from the print atlas version. Finally, the GPi was used as an example for a medium sized structure to quantitatively determine the effect of the intensity cut-off value. Areas of intersection between the print atlas structures and digital atlas structures were calculated to quantitatively determine the difference between the reconstructed atlas and the print atlas. Three areas were calculated, the area of intersection, A ∩ B, the area in A that was not in the intersection of A and B, A ∩ BC, and the area in B that was not in the intersection of A and B, B ∩ AC, where A was a print atlas structure and B was a digital atlas structure in the same plane.
RESULTS
Atlas Evaluation
First, a test cube was smoothed and examined along edges and corners to determine reasonable values for the intensity threshold. In the case of an unsmoothed structure (as in Fig. 2A), the linearly interpolated value at the boundary of the cube is 0.5. The interpolated intensity value at the boundary of either of the smoothed cubes was 0.5. Upon smoothing with a Gaussian kernel using a standard deviation equal to one voxel (0.25 mm), the intensity at a boundary along the edge of the cube varied between 0.3 and 0.7 within 0.125 mm of the actual boundary. It varied between 0.18 and 0.82 within 0.25 mm of the actual boundary (see Fig. 2B). Similarly smoothing with a Gaussian kernel with a standard deviation of two voxels (0.5 mm), intensities of 0.4 and 0.6 were within 0.125 mm of the actual boundary, and intensities of 0.31 and 0.69 were within 0.25 mm of the actual boundary (see Fig. 2C). For these relatively small amounts of smoothing used, the intensities at the boundaries dropped off quickly to zero, so most intensity cut-off values between zero and one may produce reasonable descriptions of the boundaries of the respective structures.
Second, the sagittal reconstruction of the GPi was examined to quantitatively determine the effect of the intensity cut off value on an actual (medium sized) atlas structure. Since the GPi was of an ellipsoidal type shape, the results were not the same when compared to a cubed shape. In the case of the cube, the intensity cut-off value that exactly represented the boundary of the cube was found to be 0.5. As can be seen from Fig. (3), the optimal intensity cut-off value for any plane is not necessarily 0.5. Optimally, the dotted line and the solid line for all colors should be zero as that would show that the intersection of the print atlas slice and the digital atlas slice were exactly equal (A = B), and thus A ∩ BC and B ∩ AC would be the null set. In all cases, these intersection metrics did not reach zero area. This result, while seemingly unwanted, may actually be useful in reducing the effect of known artifacts in the print atlas such as spatial 3D inconsistency. Since the exact location and extent of these artifacts are not well characterized, smoothing may provide a reasonable methodology for reduction of these artifacts. Each plane exhibited differing effects on accuracy following smoothing. This effect may be useful in “smoothing out” inconsistencies from 3D spatial slice alignment.
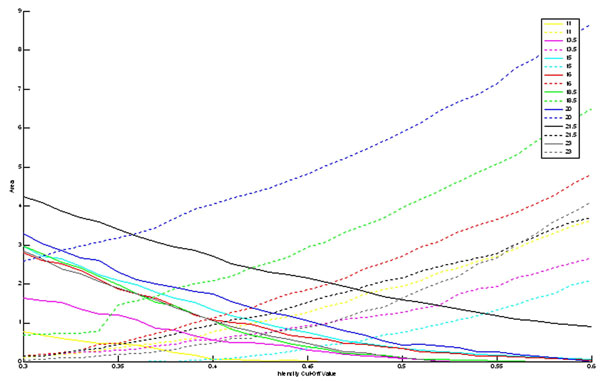
Area of slices (in mm3) through the sagittal reconstruction of the GPi that are not in the intersection of the reconstructed atlas with the print atlas planes with varying intensity cut-off values. The dotted line represents A ∩ BC, while the solid line represents B ∩ AC. Each color represents a different slice through the GPi, as given by the legend (distance in mm from midline).
The effect of the cut-off value was examined quantitatively, as seen in Fig. (3), as well as qualitatively (as in Fig. 4). Values that were less than 0.5 were chosen as the intensity cut-off value (these values were found to best model and approximate the structures). As noted previously, only particularly small or large values had a marked effect on the accuracy of the boundary. As can be seen in Fig. (4), the intensity cut-off values in the range of 0.3 and 0.5 did not drastically alter the shape and size of the structures, but did show a noticeable effect on accuracy of the boundary. The voxelization of the atlas, in addition, limited the size of the smallest distinguishable component of the structure. An example of this effect can be viewed on sagittal atlas planes 21.5 mm, 23.0 mm, and 24.5 mm, where it is evident that the protrusions of the striatum were not present due to their small size.
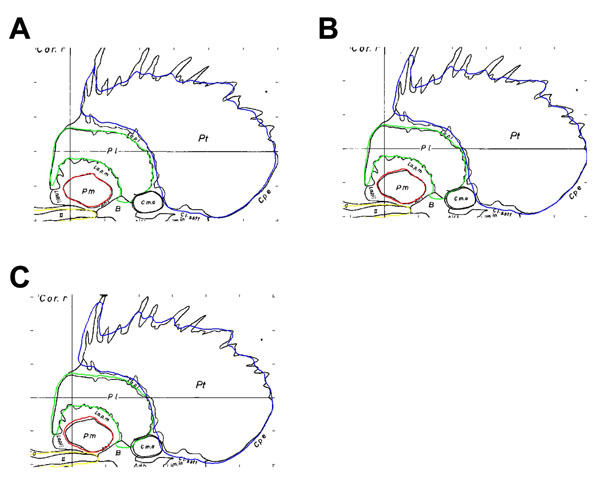
Schaltenbrand-Bailey sagittal atlas plane 23.0 mm overlaid with contours from the digitally reconstructed atlas created from sagittal contours. Panels A, B, and C use an intensity cut-off value of 0.5, 0.4, and 0.3, respectively.
Atlas Application
Using in-house created software, we have displayed example images showing the digital atlas on sample MRI and microelectrode data. The panels of Fig. (5) are a set of sagittal images showing a T1-weighted MRI (parameters from [14]) with an intraoperatively acquired electrophysiological map (green dots) corresponding to the thalamus overlay. Fig. (5A) provides an example of target visualization without the aid of the atlas, panel B shows the same image of panel A but with an undeformed atlas overlaid on top. In Fig. (5C), a best fit linear affine deformed atlas is shown overlaid on the sagittal T1-weighted MRI. Atlas deformation (Fig. 5C) qualitatively appears to improve the fit of the atlas to the subcortical anatomy as well as the microelectrode map (specifically of the thalamus) of this patient.
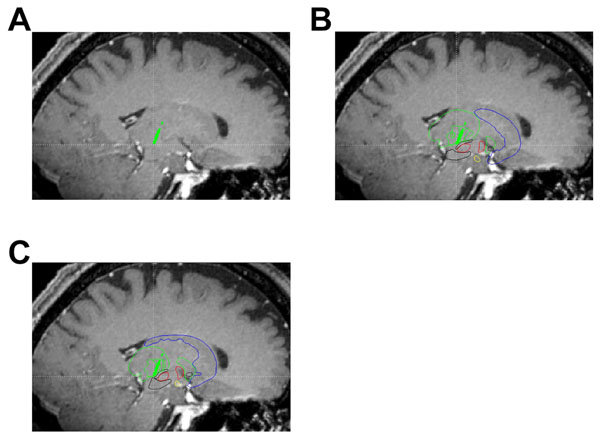
Sagittal slices through a T1-weighted MRI (parameters previously reported in Sudhyadhom et al. [14]) showing intraoperatively acquired microelectrode data overlays (green dots). Panel A is a sagittal slice along the trajectory of the electrode showing the thalamic cells acquired. Panel B is the same slice as panel A but with an undeformed atlas overlaid. Panel C is the same slice as panel A but with a deformed atlas overlaid.
DISCUSSION
In this work, we outlined the methods we employed to create an atlas for use in image guidance for deep brain stimulation. The atlas itself was made up of a set of structures with each individually stored as a set of voxels. This general framework for the atlas allowed each structure to be described independently of other structures. Although we did not evaluate the correlation of clinical data against the deformable atlas, this will be the next step in this work. A plethora of digital atlases have been created by many groups. The group of Nowinski et al. has extensively published on their atlas creation and validation of the Schaltenbrand Wahren and Talairach-Tournoux atlases [15-20]. Nowinski et al have shown their ability to display their atlas on MRI scans with adjustments made in particular planes (where the atlas slices are) and deformations in 2D [17, 19]. St-Jean et al have also created a similar atlas based off the Schaltenbrand Wahren atlas and described their creation of a 3D volume based off spline interpolation [21] but did not focus on the reduction of spatial inconsistencies. In contrast to their works, our work focused on the creation of an atlas based off the Schaltenbrand Bailey atlas and we focused on smoothing of this atlas. The works of these previous groups have been significant but also have not focused on the reduction of spatial inconsistencies in the print atlas as we have strived to do with spatial smoothing in our work. Important other atlases have been created using non-print atlases (such as histological, immunohisto chemistry, MRI data, and even population based data [6, 22, 23]) and may prove to be useful in the future once there has been adequate validation and acceptance by the community.
Our atlas was created to closely approximate the contours of the original Schaltenbrand-Bailey atlas [3], while at the same time reducing artifacts inherent to the print version of the atlas. The original print atlas had noticeable inconsistencies even once an interpolated surface was created to represent it. The relevant lack of consistency and spatial sparseness we observed in the Schaltenbrand-Bailey atlas are similar with those found by other groups who have previously examined the Schaltenbran-Wahren atlas [7, 12, 13]. Our method of smoothing may reduce the effect of these artifacts in the original print atlas and allowed for the selection of a specific amount of smoothing. The effect of smoothing could be observed across the slices through qualitative evaluation and by comparison with print atlas slices. Further it could be quantitatively examined by using intersection of common areas with the existing print atlas structures. The amount of smoothing employed in this work was a compromise that had to be struck between an accurate description of the print atlas and the removal of artifacts.
CONCLUSIONS
The consequences of employing an atlas based methodology for target refinement may prove important clinically and although we have developed a methodology it will now need to be tested with clinical data (microelectrode and outcome) to determine its applicability to clinical practice. The development of this atlas for use in DBS surgery has been the focus of this work but the methodology developed may be used for numerous clinical and research ventures. The concept of an ideal brain atlas being comprised of probabilistic functional components has been recently proposed [24] where it would be possible to add population based physiology data. A distinct advantage of our voxelized atlas model is that it naturally lends itself towards addition of population based data. Voxels can be used to represent not only structures but probabilities values and future work to integrate population based electrophysiology and optimal lead locations may prove to be useful in future clinical application. We believe this atlas will be useful in the localization and delineation of deep brain structures and that this will allow more accurate implantation of deep brain stimulators.
CONFLICT OF INTEREST
The authors confirm that this article content has no conflicts of interest.
ACKNOWLEDGEMENT
Publication of this article was funded in part by the University of Florida Open-Access Publishing Fund.

