All published articles of this journal are available on ScienceDirect.

Comparison of In Vivo and Ex Vivo Diffusion Tensor Imaging in Rhesus Macaques at Short and Long Diffusion Times
Abstract
Diffusion tensor imaging (DTI) is widely used to non-invasively study neural tissue micro-structure. While DTI tractography of large nerve fibers is well accepted, visualization of smaller fibers and resolution of branching fibers is challenging. Sensitivity of DTI to diffusion anisotropy can be further enhanced using long diffusion time that can provide a more accurate representation of the tissue micro-structure. We previously reported that ex vivo fixed brain DTI at long tdiff (192 ms) showed improved sensitivity to fiber tracking compared to short tdiff (48 ms) in 4% formalin-fixed non-human primate (NHP) brains. This study further tested the hypothesis that DTI at longer diffusion time improves DTI fiber tracking in the in vivo NHP brains on a clinical 3 Tesla MRI scanner. Compared to fixed brains, the in vivo ADC was larger by a factor of 5. Also, the white-matter FA was 28% higher in the in vivo study as compared to our ex vivo experiments. Compared to short tdiff, long tdiff increased white-matter FA by 6.0±0.5%, diffusion was more anisotropic, tensor orientations along major fiber tracts were more coherent, and tracked fibers were about 10.1±2.9% longer in the corpus callosum and 7.3±2.8% longer along the cortico-spinal tract. The overall improvements in tractography were, however, less pronounced in the in vivo brain than in fixed brains. Nonetheless, these in vivo findings reinforce that DTI tractography at long diffusion time improves tracking of smaller fibers in regions of low fractional anisotropy.
INTRODUCTION:
Diffusion tensor imaging (DTI) is widely used to non-invasively study neural tissue micro-structure from the entire brain and related central nervous system pathologies [1-4]. Diffusion contrast arises from the non-uniform water motion in the brain tissue. Cell membrane constitutes a significant barrier to water motion. In white matter (WM), water motion is less restrictive along the axonal fibers than across axonal fibers, resulting in anisotropic water motion. In grey matter (GM) however, the motion of water is comparatively isotropic, thus generating diffusion contrast between gray and white matter. DTI can also estimate the direction of nerve fibers from the direction of maximum diffusivity of water along the axon bundles.
While DTI tractography of large nerve fibers is well accepted, visualization of smaller fibers and resolution of fiber branching is challenging. A few methods have been proposed to overcome these challenges. Multiple fiber orientations and fiber branching can be inferred using various high angular diffusion imaging (HARDI) methods such as Q-ball imaging [5, 6], generalized DTI [7], spherical harmonic transformation [8]. Some of these approaches require very high b-values, large number of directions, or are constrained by low signal-to-noise (SNR). Developing DTI techniques, to better visualize smaller fibers and resolve fiber crossings, remains an active area of research.
DTI data is acquired with a diffusion time (tdiff) in the range of 30-50 ms. The root-mean-squared (rms) displacement [9] is about 13.5 μm for a tdiff of 40 ms with a typical apparent diffusion coefficient (ADC) of ~ 0.76 x 10⁻³mm2/s in the in vivo brain. This dimension is of the order of a typical brain cell size. At longer diffusion times, water molecules are likely to encounter more barriers and thus could more accurately sample tissue structure [10, 11]. DTI at longer tdiff could potentially increase its sensitivity [12, 13] and provide more accurate tensors to improve nerve fiber tracking. Nair et al. [14] showed that fractional anisotropy (FA) at longer tdiff is more sensitive to changes in myelin-deficient mice. We recently reported that ex vivo brain DTI at long tdiff (192 ms) showed improved sensitivity to fiber tracking compared to short tdiff (48 ms) in 4% formalin-fixed non-human primate (NHP) brains [11]. FA increased at longer tdiff, and the tensor orientations in neighboring voxels along the fiber tract were more coherent [11]. The nerve fibers traced in the corpus callosum were ~10% longer and ~20% longer in the internal capsule at tdiff = 192 ms compared to tdiff = 48 ms.
This study further tested the hypothesis that DTI at longer diffusion time improves DTI fiber tracking in the in vivo NHP brains on a clinical 3 Tesla MRI scanner. Comparisons with previously published ex vivo DTI data on fixed NHP brains [11] were made. In conventional spin-echo DTI sequences, longer diffusion time requires longer echo time resulting in significant signal loss due to T2 decay. In contrast, in Stimulated-Echo-Acquisition-Mode (STEAM) sequence [3, 15], the mixing time can be increased to achieve long diffusion time without increasing echo time, avoiding signal loss due to T2 decay (Fig.1). DTI was performed with short (50 ms) and long (200 ms) diffusion times. DTI parameters such as FA, CL (linear anisotropy), CP (planar anisotropy) and CS (spherical anisotropy) [16] , directional entropy (DE) [17] and deterministic fiber tractography using line propagation [18] were compared between long and short tdiff with matched signal-to-noise ratio (SNR) and identical statistical thresholds. Comparison was also made with conventional DTI acquisition using double spin-echo acquisition (DSE) [19].
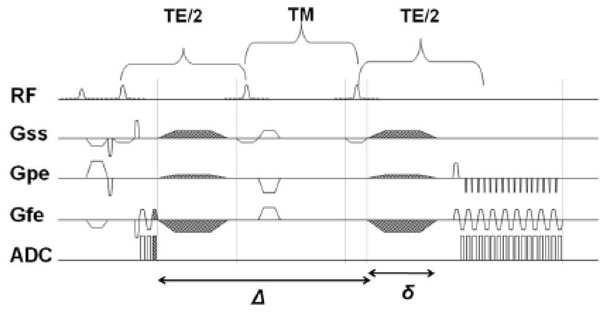
Stimulated Echo Acquisition Mode Sequence with diffusion gradients. The mixing time, TM, can be increased, thereby increasing Δ (duration for which diffusion gradients are applied), and thereby achieve longer diffusion times without increase in TE.
MATERIALS AND METHODOLOGY
Ex vivo Preparation
For the ex vivo studies, data were those from a previous study [11]. Eight rhesus monkey brains were perfusion-fixed with 4% formalin for 2-3 days as reported in this study. The sample was rinsed with water to remove formalin and immersed in water containing 0.018 mg/ml MION particles. Submersion in aqueous solution prevented susceptibility artifacts at the tissue-air interface. Images suffered from Gibbs ringing artifact due to the strong signal that was detected if pure water or saline was used. Addition of MION particles reduced the T2* of the solution, thereby eliminating Gibbs ringing. MION particles were large enough to remain outside the brain tissue. The sample was immobilized in the container using plastic holders.
In Vivo Preparation
For the in vivo studies, six rhesus monkeys (2 male, 4 female) were anesthetized initially with telazol (3-5 mg/kg) and maintained with 1-1.5% isoflurane during MRI scans as per institutional approval. The eyes were coated with PuraLube to prevent dryness. Lactate ringer solution (10 ml/kg/hr) was administered via an i.v. line. The animals were placed in a holder using a mouth-piece and ear bars. Heart-rate, respiration, temperature and blood pressure were continuously monitored during the experiment. All procedures were performed with Institutional Animal Care and Use Committee approval.
MRI
All experiments were done on a Siemens® TRIO 3 Tesla (Siemens, Erlangen, Germany) human scanner. Stimulated Echo Acquisition Mode (STEAM) [20,21] sequence was used to allow an increase in diffusion by increasing the mixing time, TM. Geometric averaging was used for STEAM to reduce the contribution of cross terms [22, 23].
The ex vivo MRI parameters were: 16-shot STEAM EPI, TR/TE = 3000 ms/80 ms, δ = 17 ms, Δ = 21 ms for short tdiff (48 ms) and 169 ms for long tdiff (192 ms), directions = 30, b = 1700 s/mm2, resolution = 0.54 x 0.54 x 2 mm and number of averages = 34 for short tdiff, 70 for long tdiff. These sequences are referred to as STEAM48 and STEAM196 henceforth.
The in vivo MRI parameters were: 4-shot EPI, TR /TE = 3000/63 ms, δ = 17 ms, Δ = 31 ms for short tdiff (50 ms) and 181 ms for long tdiff (200 ms), directions = 60, b = 1200 s/mm2, resolution = 1x1x1 mm and number of averages = 3 for short tdiff, 6 for long tdiff. These in vivo sequences are referred to as STEAM50 and STEAM200.
DSE was also acquired with MRI parameters similar to the STEAM50 except TE = 91 ms which was the shortest TE possible. The numbers of averages among STEAM DTI acquisitions at short and long tdiff and DSE were adjusted to match SNR for comparison.
Geometric Measures of Anisotropy and Directional Entropy
In addition to the commonly used DTI parameters such as ADC and FA, geometric measures of anisotropy – CL, CP and CS [11, 16] – were also analyzed to evaluate the diffusion sensitivity at long tdiff. CL, CP and CS are measures of linear, planar and spherical anisotropy and are derived from the principle eigen values λ1, λ2 and λ3 as follows [16]:
Geometric measures were plotted in the form of three phase plots [11]. To that effect, x and y co-ordinates [32] to represent anisotropy can be plotted using
Changes in anisotropic diffusion in terms of CL and CP and isotropic diffusion in term of CS due to long tdiff can be depicted on these plots.
Further, to verify the coherence of tensor directionality along a fiber tract, directional entropy (DE) [17] was also measured. DE is inversely proportional to the inter-voxel tensor coherence along a nerve fiber. DTI at long tdiff would produce more coherent tensor orientations along a fiber tract and hence a reduced DE is expected.
Tractography
FA, ADC, parallel and perpendicular diffusivity were calculated. Nerve fiber tracks were tracked from the tensor data, using either line propagation techniques or probabilistic maps. While line propagation techniques such as Fiber Assignments by Continuous Tracking (FACT) [24] offer a comparatively simple approach to visualize various neural pathways, the technique relies heavily on the estimated tensor data and hence on image quality and SNR. Probabilistic approaches [25-27] compute a 3D connectivity map representing all the likely neural pathways that may exist at the selected seed in the brain volume. However, these techniques require a priori knowledge of the neural tracts in the brain region of interest were a database of numerous DTI scans is required to obtain comprehensive information about the similarities and differences in each nerve fiber tract across different animals of the same species. In this study, tractography was performed using the Diffusion TENSOR Visualizer [28], a software package that uses an advanced line propagation method.
RESULTS
ADC and FA in Ex vivo and In Vivo Samples
Fig. (2) shows the ADC and FA values in WM and GM for the ex vivo and in vivo studies using the typical DSE sequence. The ADC values in the fixed tissue were much lower than those in the in vivo data in the white matter WM (p < 0.01) (Fig.2a). ADC was also measured in the fixed tissue and found to be 0.27 ± 0.02 x 10⁻³ mm2/s in the grey matter as opposed to 0.74 ± 0.01 x 10⁻³ mm2/s in vivo. The WM ADC in fixed tissue was 0.16 ± 0.02 x 10⁻³ mm2/s and in vivo, it was 0.81 ± 0.02 x 10⁻³ mm2/s. Surprisingly, WM ADC was higher than GM ADC, which also has been reported previously in some WM regions [29]. In addition, the ratio of parallel diffusivity to perpendicular diffusivity [i.e., 2λ1/ (λ2+ λ3)] was 1.53 ± 0.08 for ex vivo WM and 2.10 ± 0.08 for in vivo WM.
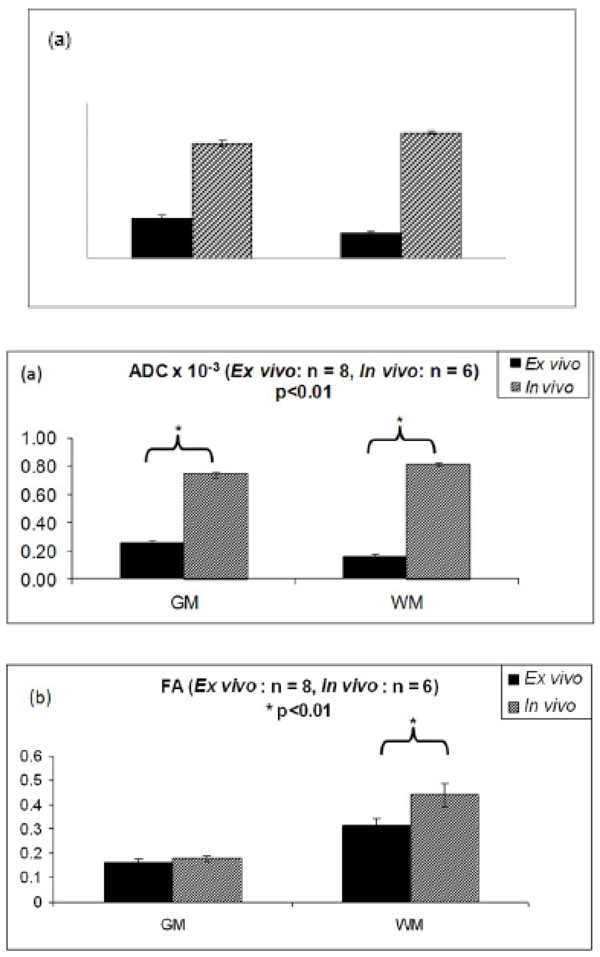
(a) ADC in the GM and WM in the in vivo and ex vivo experiments. Compared to the in vivo values, ADC in the WM was reduced by almost by 61 ± 5% and ADC in the GM decreased by 39 ± 8% in the ex vivo samples. (b) Comparison of FA in the in vivo and ex vivo samples. FA reduced by almost 28% in the WM in the ex vivo study while in the GM the decrease was less prominent at 10% compared to the in vivo FA. (Ex vivo data obtained from [11])
The FA values in the fixed tissue were also much lower than those in the in vivo data in the white matter WM (p < 0.01) (Fig.2b). FA decreased by 28% in fixed WM compared to in vivo WM. FA decrease in GM was much less (10%).
DTI at Long Diffusion Time
The ex vivo and in vivo WM and GM FA values at the two tdiff are summarized in Table 1.Ex vivo GM FA was unchanged, whereas ex vivo WM FA increased by 11.5 ± 5.0% (p < 0.05) for tdiff = 196 ms compared to tdiff = 48 ms. Similarly, in vivo GM FA was unchanged, whereas in vivo WM FA increased by 6.03 ± 0.52% for tdiff = 200 ms compared to tdiff = 50 ms (p<0.01). Further, FA estimated with STEAM50 and DSE in the in vivo studies were not significantly different. Similar results were observed for the ex vivo study, thereby confirming that the DTI parameters evaluated with STEAM and DSE sequences do not differ significantly. SNRs calculated for the STEAM50, STEAM200 and DSE sequence were 24.58, 22.87 and 28.45 respectively.
Three-phase plots were obtained for the in vivo experiments at tdiff = 50 ms and tdiff = 200 ms (Fig.3a). The three-phase plot shows voxels of the cortical terminations of the callosal fiber tract as shown in the inset. The tendency for linear anisotropic diffusion increased significantly (p < 0.05) at tdiff = 200 ms as opposed to tdiff = 50 ms. Similar results were also obtained with DSE sequence. Fig. (3b) compares the geometric measures of diffusion for DSE and STEAM200 in the cortico-spinal tract. DE along the same callosal fibers (Table2) were reduced significantly (p<0.01). Similar results were also obtained for the cortico-spinal tract. Thus the tensors along the nerve fiber pathway not only became more linearly anisotropic (i.e. directional) but also showed increased inter-voxel coherence. Comparison of the directional entropy revealed that DE decreased by 17 ± 4% in the callosum and by 10 ± 2% in the cortico-spinal tract at tdiff = 200ms as opposed to tdiff = 50 ms (p < 0.05). Comparison of DE between DSE and STEAM200 showed a decrease of 12 ± 2% in callosum and of 15 ± 3% in the cortico-spinal tract in STEAM200 (p < 0.05).
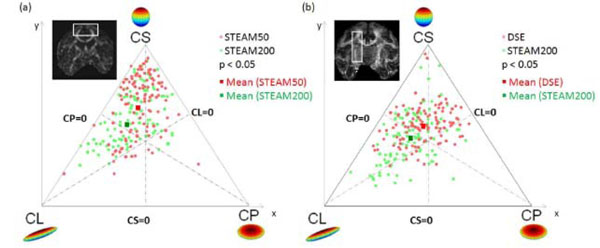
Geometric measures of diffusion: CL, CP and CS are plotted as three phase plot. (a) Comparison of short and long tdiff by STEAM from the same animal. (b) Comparison of DSE and long tdiff by STEAM from the same animal. Light red dots indicate diffusion in voxels at short tdiff = 50 ms, Green dots represent diffusion in the same voxels at tdiff = 200 ms. At long tdiff, diffusion tends to be significantly (p < 0.05) more linearly anisotropic. The red and green squares represent the mean diffusivity at tdiff = 50 ms and 200 ms respectively.
Directional Entropy (p < 0.05)
| STEAM50 vs. STEAM200 | DSE vs. STEAM200 | |||
|---|---|---|---|---|
| tdiff | 50 ms | 200 ms | DSE (48 ms) | 200 ms |
| Corpus Callosum | 2.33 ± 0.51 | 1.93 ± 0.48 | 2.98 ± 0.49 | 2.60 ± 0.48 |
| Cortico-spinal tract | 2.00 ± 0.54 | 1.80 ± 0.52 | 2.46 ± 0.48 | 2.10 ± 0.60 |
Tractography outcome for ex vivo and in vivo experiments at short and long tdiff were compared (Fig.4). The fibers traced at long diffusion time were much longer than those traced at short diffusion time. The length of fibers and the % increase in the length of fibers at long tdiff are tabulated in Table3 for the fiber tracts in the internal capsule and corpus callosum. In the ex vivo experiments, the callosal fibers were 14.6 ± 5.8% longer for the long tdiff compared to short tdiff. In the in vivo experiments, the callosal fibers were 10.1 ± 2.9% longer. Similarly, the increase in fiber length in the internal capsule was 24.8 ± 6.9% for the ex vivo experiments and was 7.3 ± 2.8% for the in vivo experiments for the long tdiff compared to short tdiff. In comparison with the conventional sequence, the increase in fiber length in STEAM200 with respect to DSE was 6.2 ± 1.5% in the corpus callosum and about 11.5 ± 2.9% in the internal capsule. Overall, in the acquired brain volume, the improvement in tractography was more significant in the ex vivo studies.
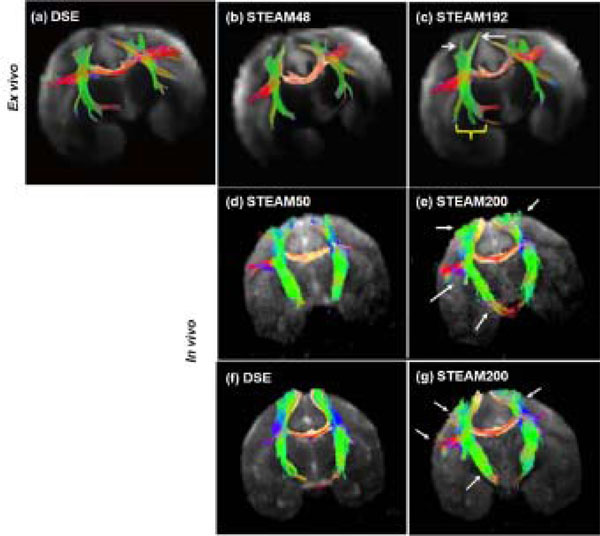
DTI tractography: For the ex vivo study, fiber tracking using (a) DSE, (b) STEAM48 and (c) STEAM192 is shown in the same sample. White arrows and a yellow bracket mark the regions of improvement (longer fibers) using long tdiff. In vivo (d) short and (e) long tdiff tractography results by STEAM sequence were obtained from the same animal. In vivo (f) DSE and (g) long tdiff by STEAM sequence were obtained from the same animal. Arrows mark the regions of improvement (longer fibers) using long diffusion time. (Ex vivo tractography obtained from experimental data in [11])
Percent Increases in Fiber Length and Brain Volume in the Ex vivo and In Vivo corpus callosum and internal capsule as a Result of Increased tdiff.
| Corpus Callosum | Internal Capsule | Total Brain Volume | |
|---|---|---|---|
| Ex Vivo | |||
| STEAM48 vs. STEAM192 | 14.6 ± 5.8 | 24.8 ± 6.9 | 20.4 ± 9.1 |
| In Vivo | |||
| STEAM50 vs. STEAM200 | 10.1 ± 2.9 | 7.3 ± 2.8 | 8.5 ± 3.6 |
| DSE vs. STEAM200 | 6.2 ± 1.5 | 11.4 ± 4.6 | 6.3 ± 2.2 |
DISCUSSION
The major findings of this study are: (1) FA and ADC of fixed tissue were markedly different from those of in vivo in our study. (2) DTI at longer tdiff increased WM FA, linear anisotropy, tensor magnitude and tensor coherence amongst adjacent voxels, and tractography outcome compared to DTI at short tdiff. Specifically, nerve fibers tracked in the corpus callosum and cortico-spinal tracts in the in vivo rhesus brains were significantly longer at long tdiff compared to short tdiff, consistent with our previous ex vivo study [11]. (3) The improvements in tractography and DTI characteristics at long diffusion time in the in vivo brains, however, were less pronounced than in the ex vivo brains reported earlier [11].
For the in vivo study, an isotropic resolution of 1 mm3 was used, in contrast to the ex vivo studies with a high in-plane resolution of 0.54 x 0.54 x 2 mm3 acquired over ~20 hours [11]. Lower resolution in the in vivo experiments causes larger partial volume effects which could affect DTI results. This is in part constrained by the duration for which the animals can be placed under anesthesia as well as physiological (respiratory and cardiac) motion.
The outcome of STEAM DTI at long diffusion time was compared with STEAM DTI at conventional diffusion time and also with the conventional spin echo DTI (DSE) sequence. T1 and T2 weightings for the WM and GM tissue with the STEAM and DSE acquisition are different. Signal intensity in the DSE sequence is affected more by protons with long T2 while in the STEAM sequence; protons with long T1 weigh more on the measured signal intensity. However, DTI parameters such as FA and ADC were not significantly different between STEAM50 and DSE, indicating that the tractography outcome is not significantly affected by different sequences.
Comparisons Between In Vivo and Ex vivo Tissue Properties
Protein cross-linking, dehydration, and tissue degradation in formalin fixation post-mortem could alter MRI tissue properties [30, 31]. Fixation shortens tissue T1 and T2 relaxation. Since the T2 values of the brain tissue, in vivo, are much longer than those measured ex vivo, in vivo scans have an advantage of higher SNR per acquisition. In vivo brain T1 is also comparatively longer, translating into better SNR in the DTI with STEAM acquisitions compared to ex vivo.
Fixation decreases ex vivo ADC. The in vivo brain ADC was ~0.8 x 10⁻³ mm2/s and a b value of 1200 mm2/s produced e-fold attenuation which produced optimal diffusion weighting. The fixed brain ADC was 0.16 ± 0.02 x 10⁻³ mm2/s and a higher b value of 1700 mm2/s was used. Ideally, the b value for the tissue sample with an ADC of 0.16 ± 0.02 x 10⁻³ mm2/s would be ~ 4700mm2/s. The optimal b value could not be achieved in the ex vivo experiments because it was constrained by SNR. Importantly, due to the reduced ADC in fixed tissue samples, the tdiff of 48ms results in a rms displacement of 6 μm, whereas the root-mean-squared (RMS) displacement in vivo is 15 μm. At a tdiff of 196 ms in the ex vivo studies, this RMS displacement is approximately 14 μm and about 30 μm for the in vivo studies. Thus, the sampling of the diffusion space is expected to yield more improvement with increasing tdiff for the fixed brain than for the in vivo brain as observed.
The study by D’Arceuil showed no significant change in FA values between in vivo and fixed samples at 7T [32]. However, fixation decreased FA 28% in WM and 10% in GM in our studies. This discrepancy could be due to different degree of tissue degeneration after post mortem [29,32]. Similar to the observation in the aforementioned study [32], the fiber bundles in our study were sparse in the fixed brain tissue compared to in vivo. Fixation also decreased fiber length, consistent with that reported previously.
Geometric Measures of Anisotropy and Directional Entropy
The geometric measures of diffusion anisotropy serve as excellent measures to determine whether the diffusion tensor in a voxel is linear, planar or spherical. Linear diffusion represents the presence of uni-directional nerve fibers, while planar diffusion represents the presence of multiple fiber directions. Spherical diffusion is equivalent to isotropic diffusion. This study showed that the diffusion along a fiber tract became more linear at long tdiff (200 ms), especially along the fiber terminations of the callosal tract in the cortical surface. Additionally, neighboring voxels showed more inter-voxel coherence of the tensor directions at long tdiff, consistent with the white matter anatomy in the cortical regions.
Tractography
Tractography in the acquired brain volume revealed that the length of the tracked fibers increased significantly with tdiff = 200 ms when compared with tractography outcome at tdiff = 50 ms. The major nerve fiber pathways such as the corpus callosum and the cortico-spinal tract were tracked. The fiber branches of the callosal tract were much more abundant at tdiff = 200 ms (Fig.3). Further, the fibers traced in the callosum and the internal capsule were much longer at long tdiff than at the conventional diffusion time. The improvements in tractography and DTI characteristics, although significant, were much less in the in vivo data which could be due to lower spatial resolution and fixation effect in the ex vivo study.
CONCLUSION
In conclusion, this study demonstrates that in vivo DTI at long diffusion time significantly improves tractography outcome. Although these improvements were of a lesser magnitude than the ex vivo results, these in vivo experiments reinforce our findings that DTI tractography at long diffusion time significantly improves tracking of smaller fibers in regions of low fractional anisotropy. The use of long diffusion time increased FA values in the brain tissue, provided more coherent and directionally oriented tensors and resulted in tracking of longer fibers when compared to conventional tractography. Future studies will explore DTI at longer diffusion time and in human applications.
CONFLICT OF INTREST
None decleared.
ACKNOWLEDGEMENTS
This work was supported by the American Heart Association (AHA), Established Investigator Award (EIA 0940104N) and NIH/NINDS NIH (R01NS45879) to TQD.

